The SARS-CoV-2 coronavirus and subsequent COVID-19 pandemic have brought the subject of viruses and virology to the forefront of everyone’s mind. As we all work together to navigate these challenging times, LI-COR continues to support the researchers who will lead us through this. We provide the products, tools, and services they rely on to better understand SARS-CoV-2 and other viruses.
Near-infrared (NIR) Western blotting and the In-Cell Western™ Assay are valuable tools for virology researchers seeking quantifiable assays for their studies. Results from the In-Cell Western have been shown to correlate well with traditional methods used in virology, such as the standard plaque assay (SPA), quantitative reverse transcription polymerase chain reaction (qRT-PCR), flow cytometry (FCM), and enzyme-linked immunosorbent assay (ELISA).
For the latest on the COVID-19 pandemic, visit the WHO or CDC websites.
When investigating viruses, such as SARS-CoV-2—the coronavirus that causes COVID-19—it is critical to characterize viral infectivity.
Traditionally, infectivity of viruses that exhibit cytopathic effect (CPE) has been characterized using assays such as SPA. While effective, these methods can be tedious, time-consuming, and the results are subject to human error.
The In-Cell Western Assay, a quantitative immunofluorescence assay performed using microwell plates, combines the specificity of Western blotting with the replicability and throughput of an ELISA. The result is a high quality and reliable means to perform many assays, including viral titrations on both plaque forming and non-plaque forming viruses, antiviral molecule screens, and more.1
The In-Cell Western Assay is effective for quantifying virus titrations of both cytopathic and non-cytopathic viruses.2 The “Reliable Quantification of Virus Using Infrared Digital Imaging” webinar provides an in-depth look at the many advantages of the In-Cell Western Assay for viral titration and other assays.
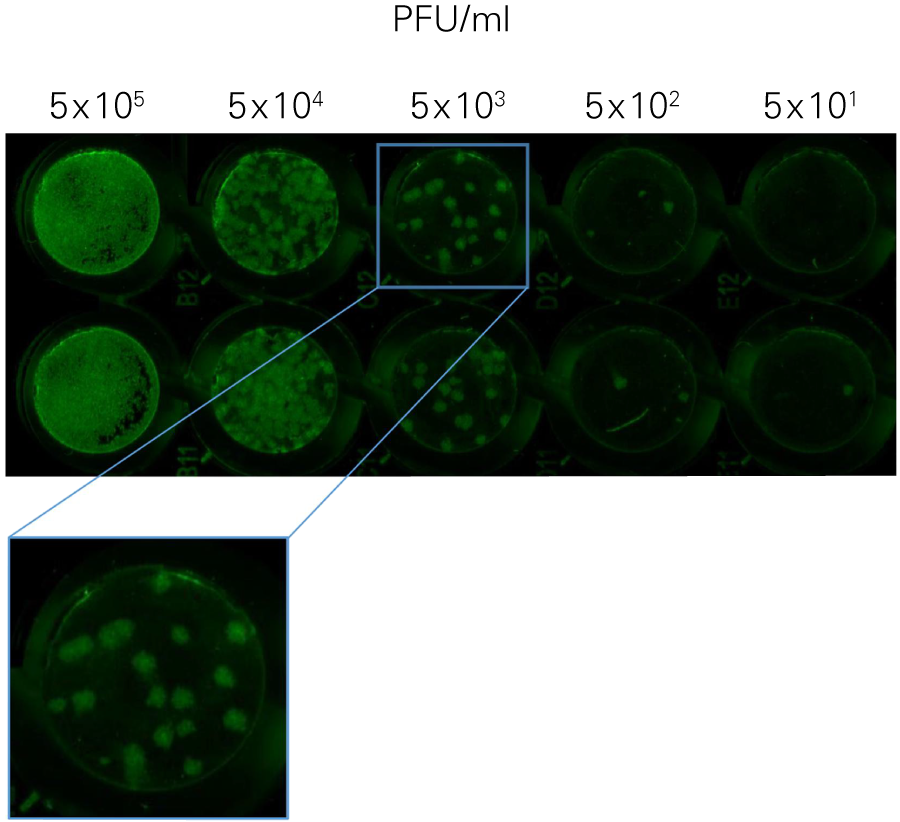
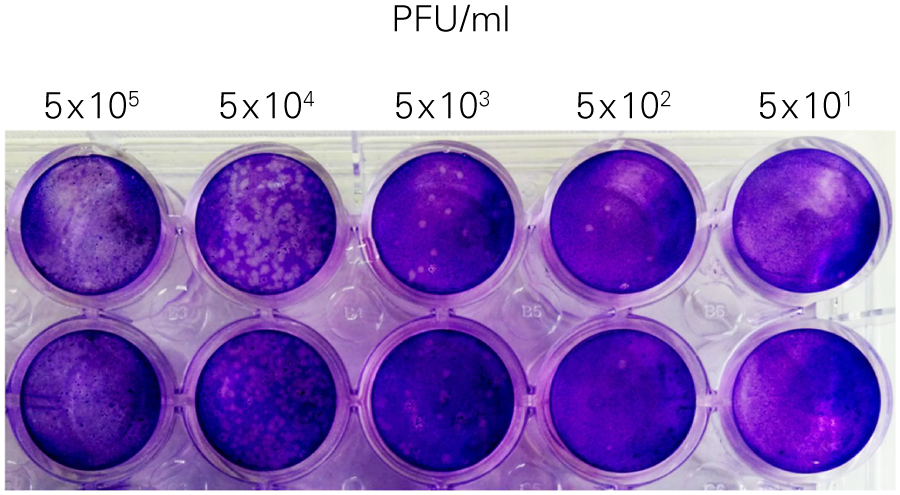
The SPA can be used to evaluate virus infectivity and replication, but it is prone to operator subjectivity and is labor intensive. In this study, viral titer of Herpes simplex virus-1 (HSV-1) was determined in parallel using NIR immunodetection of viral proteins in an In-Cell Western Assay and using SPA.
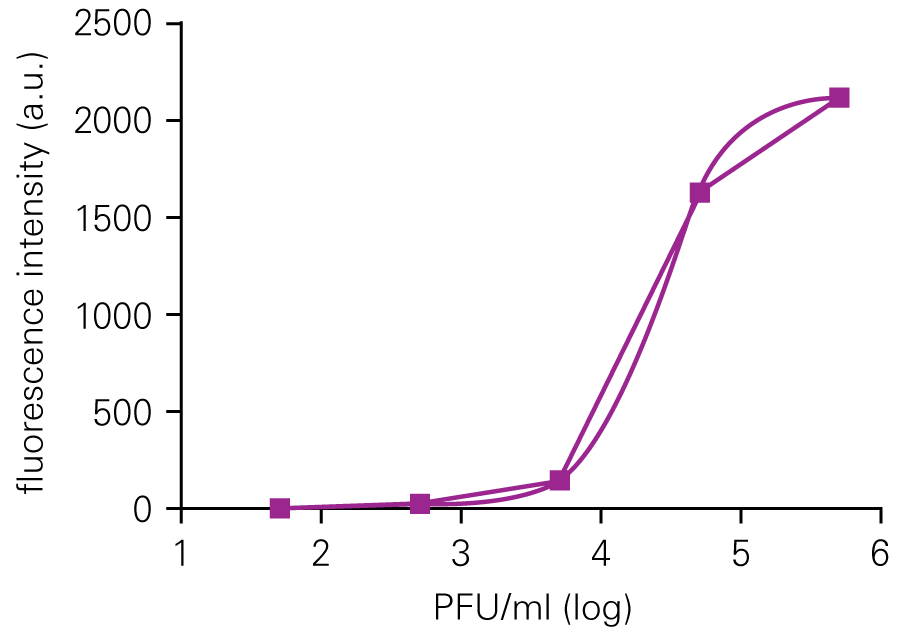
The In-Cell Western Assay and SPA produced nearly superimposable results, but the In-Cell Western Assay was faster, detecting HSV-1 24 hours post infection versus 48-72 hours post infection for SPA, enabled many samples to be measured in parallel, and was found to be more suitable for titrations that produced plaques too numerous to count using SPA.
A. In-Cell Western Assay
B. Standard Plaque Assay
C
Understanding the mechanism of action (MoA) of a virus is key to developing a plan for effective treatment options. If the MoA can be determined, then a means of preventing infection or mitigating disease symptom severity might be developed.
Researchers often use Western blotting to learn more about the MoA of a virus.4, 5 , 6 The In-Cell Western Assay can also be used to identify aberrent signalling pathways, detect apoptosis, or screen therapeutic agents. Both assays can be performed with exceptional quality and consistency using an Odyssey imaging system, such as the Odyssey M.
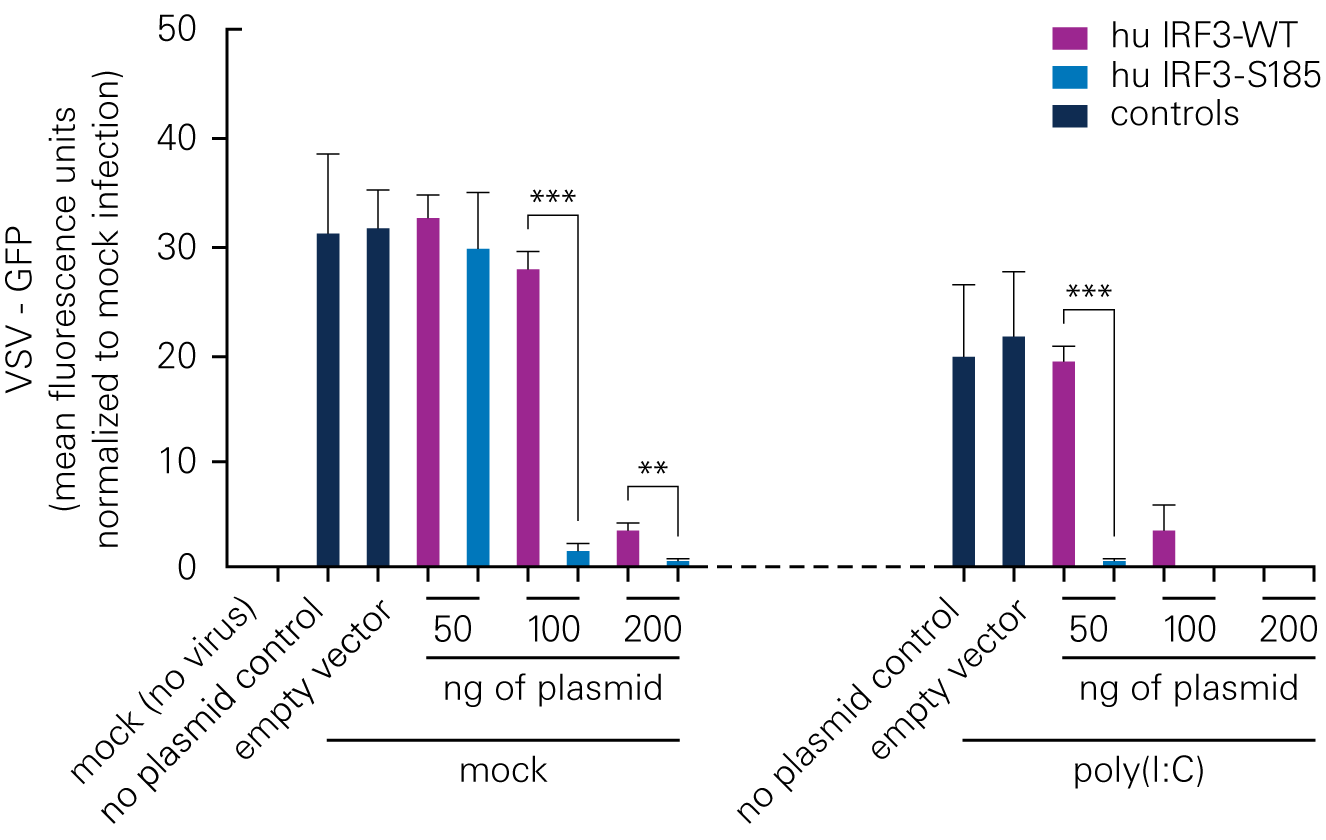
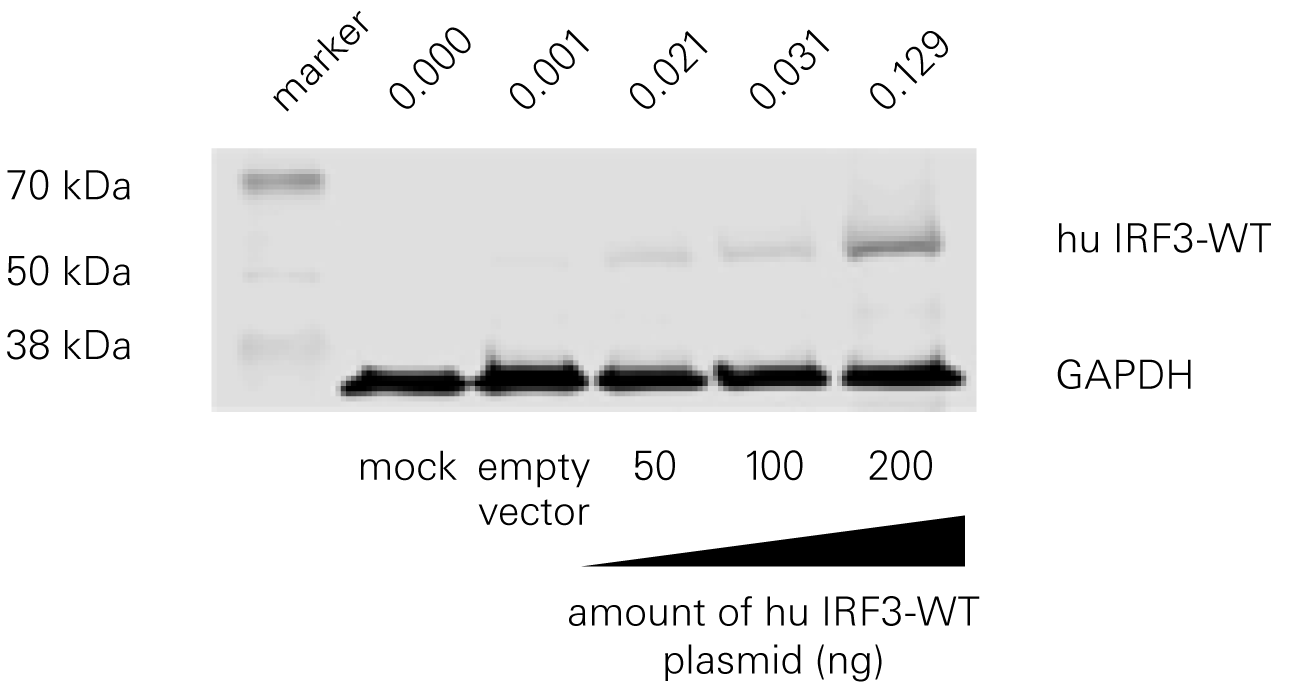
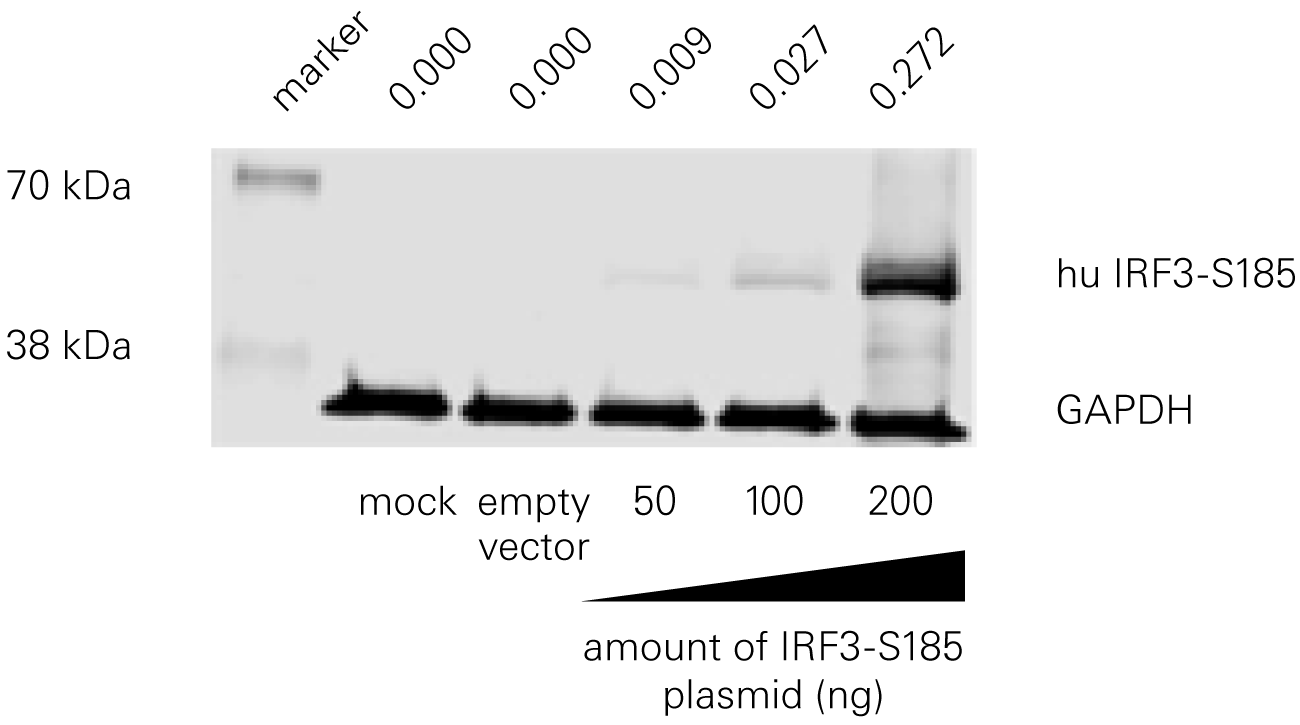
Bat species harboring viruses often do not demonstrate signs of disease because of a robust antiviral response at low levels of infection. According to a study by Banerjee, A., et al., a serine residue in interferon regulatory factor 3 (IRF3) confers enhanced antiviral protection in bats.
Replacing a leucine residue with a serine residue in the human IRF3 resulted in a significant increase in the antiviral response of human cells. Conversely, replacing a serine residue with a leucine residue in the bat IRF3 led to decreased antiviral protection in the bat cells.
A
B
“This automated technique provides not only rapid detection of viral infection status but can also be optimized to detect changes in host-cell protein expression during JCPyV challenge.”
Antiviral therapeutics or vaccines that have shown promise in preclinical studies may then move on to clinical trials. During clinical trials, potential antiviral therapeutics or vaccines will have their efficacy in humans evaluated.
NIR Western blotting and In-Cell Western Assays performed using Odyssey Imaging Systems have played a critical role in assessing the efficacy of both antiviral therapeutics and vaccines.1
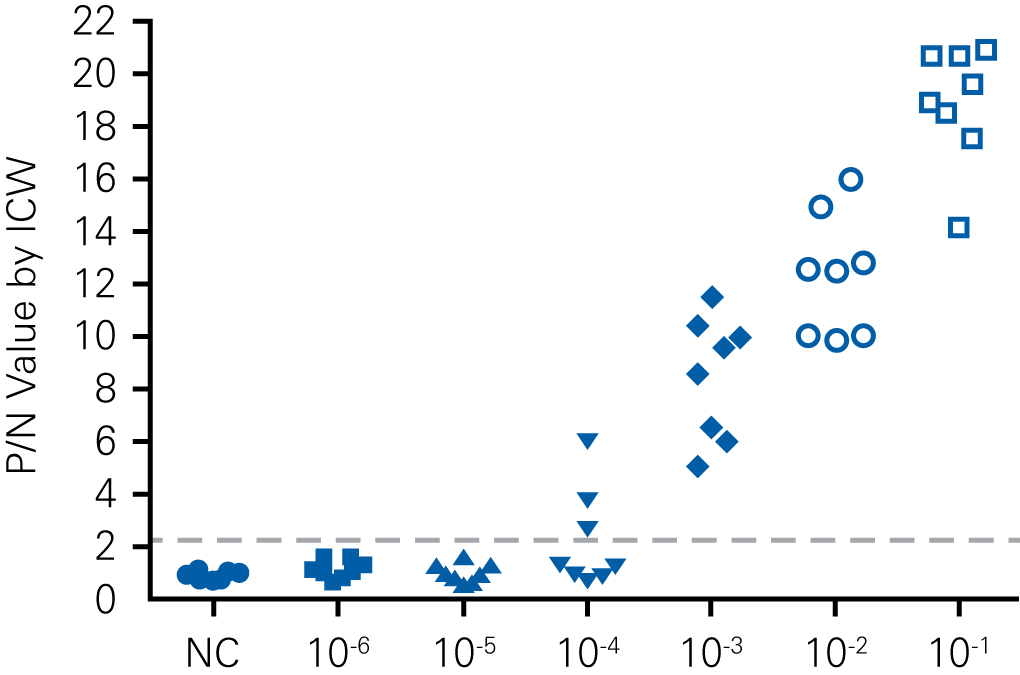
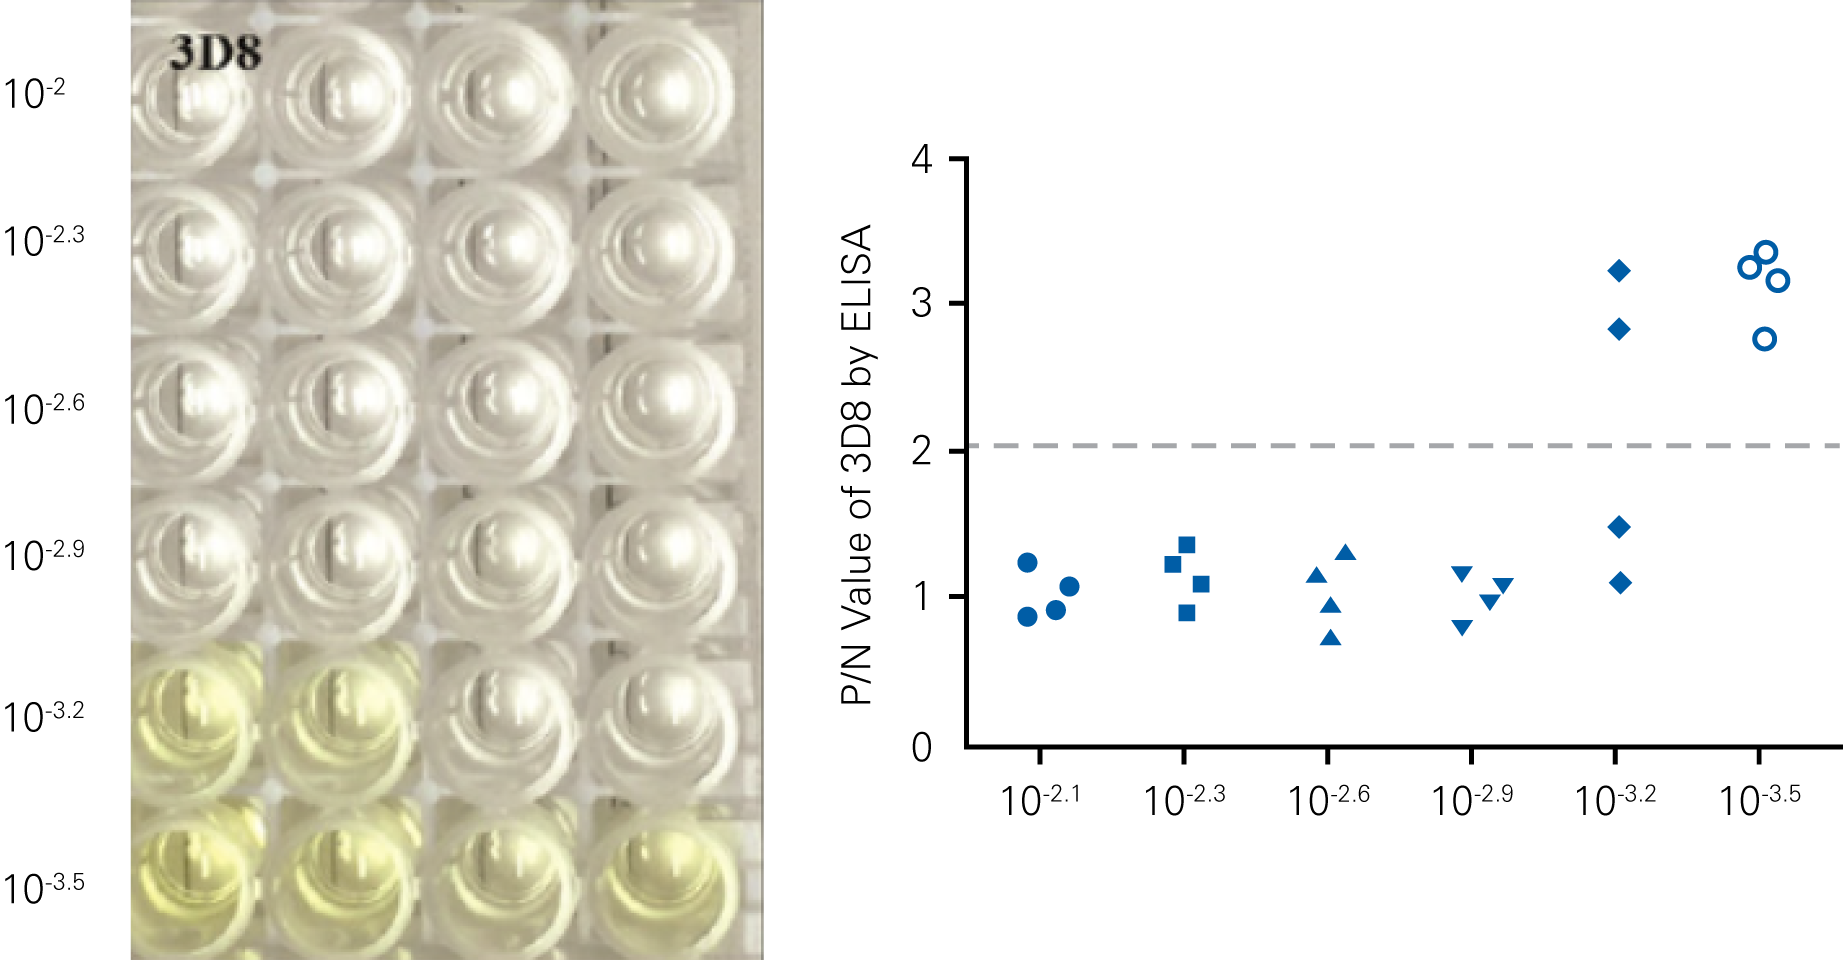
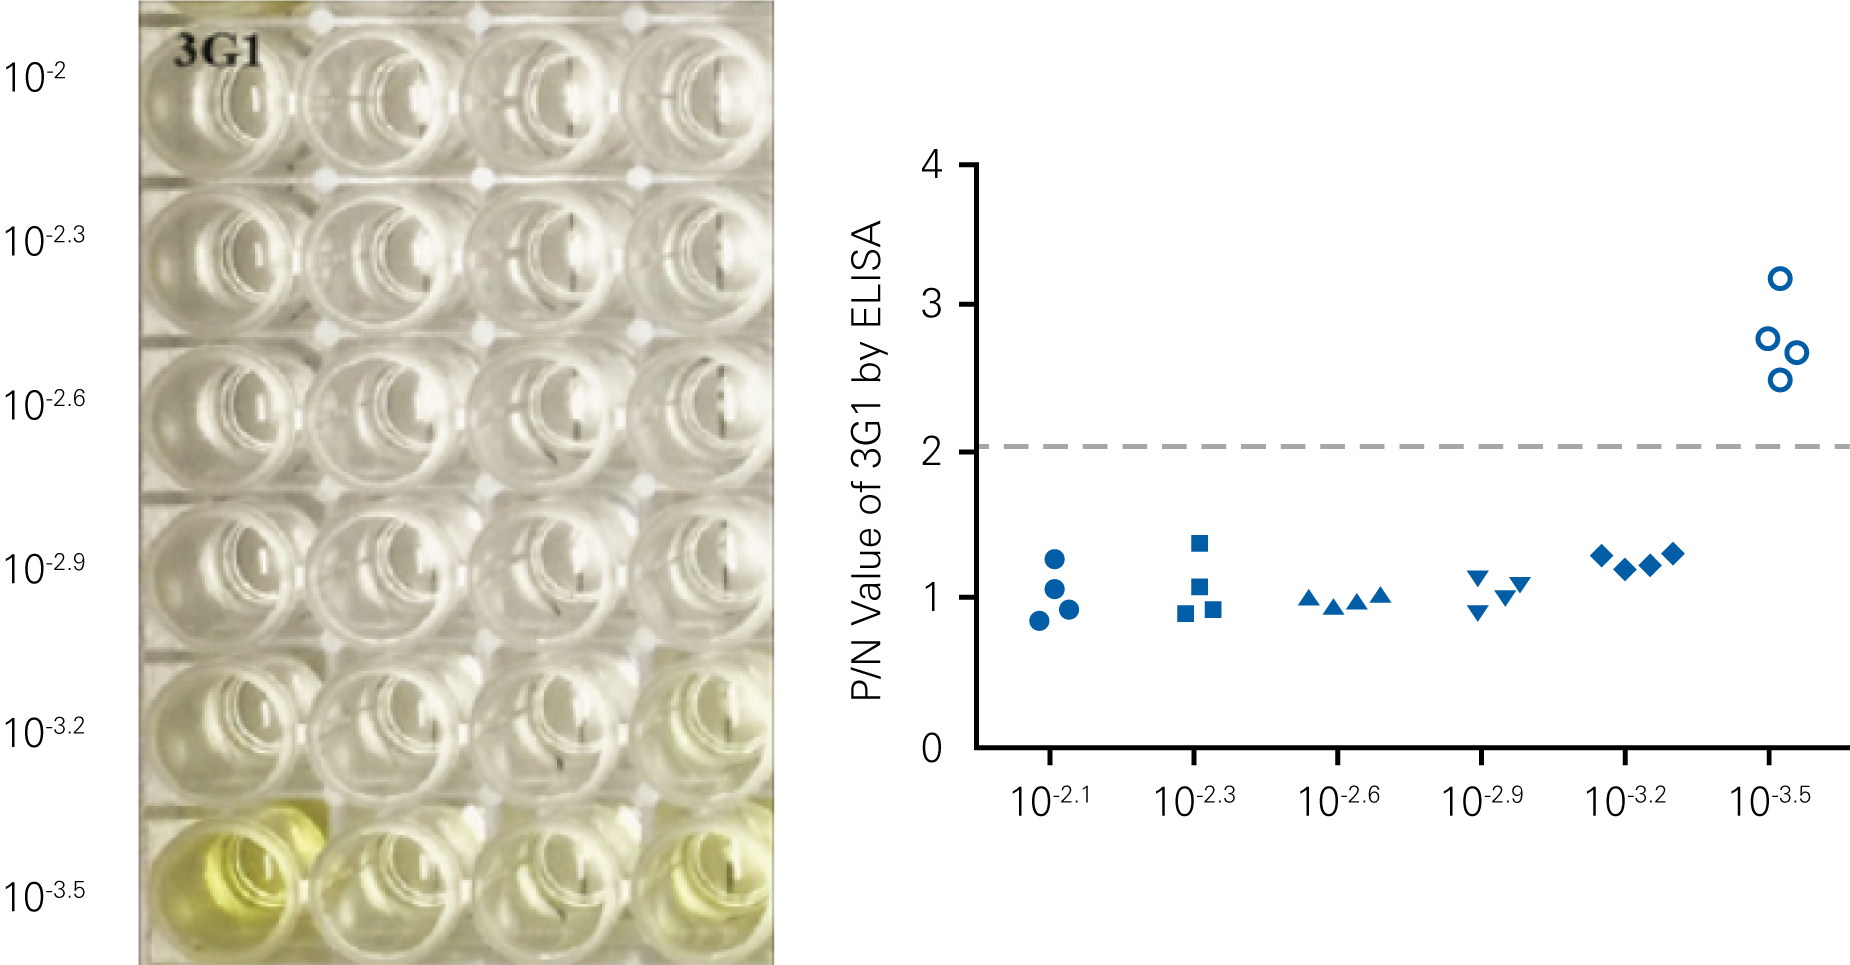
“The ICW assay was also applied to assess Nab (neutralizing antibodies) titers in patients and vaccine recipients… Our results indicate that the use of the ICW assay to evaluate non-CPE Hantaan virus titer demonstrates a significant improvement over current infectivity approaches and a novel technique to screen antiviral molecules and detect NAb efficacies.”
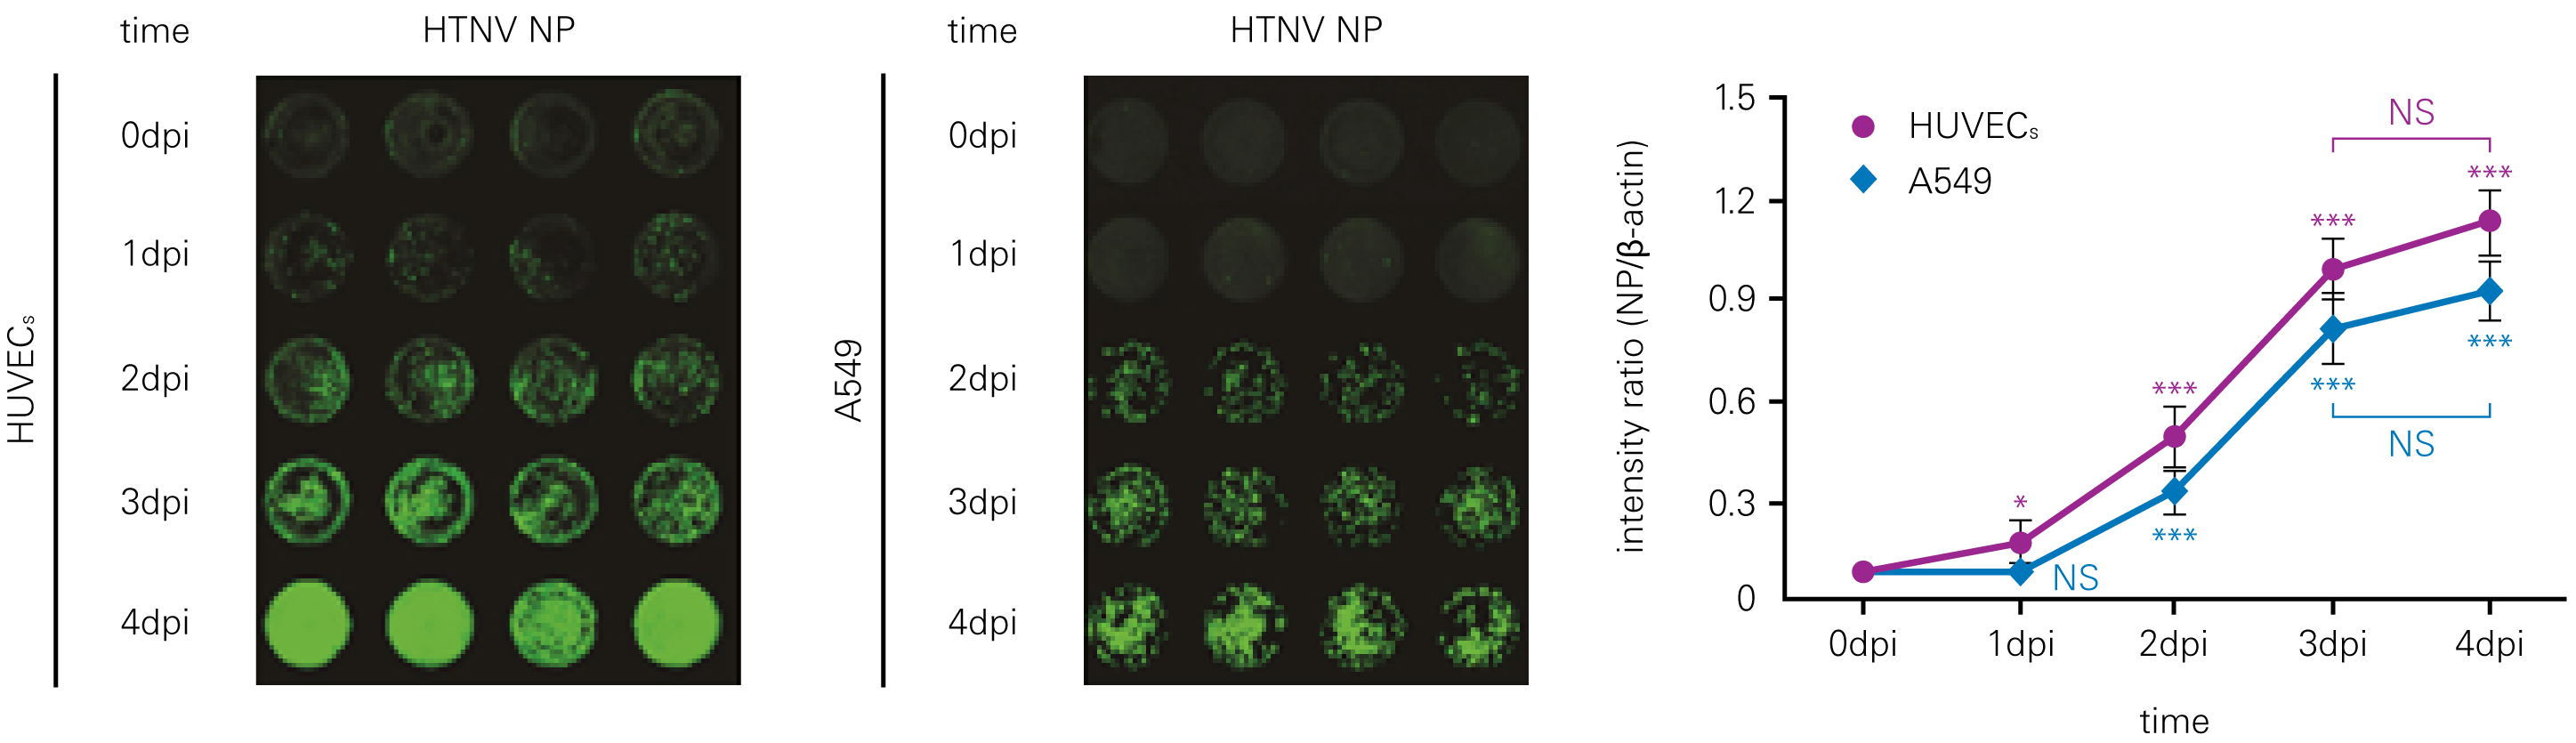
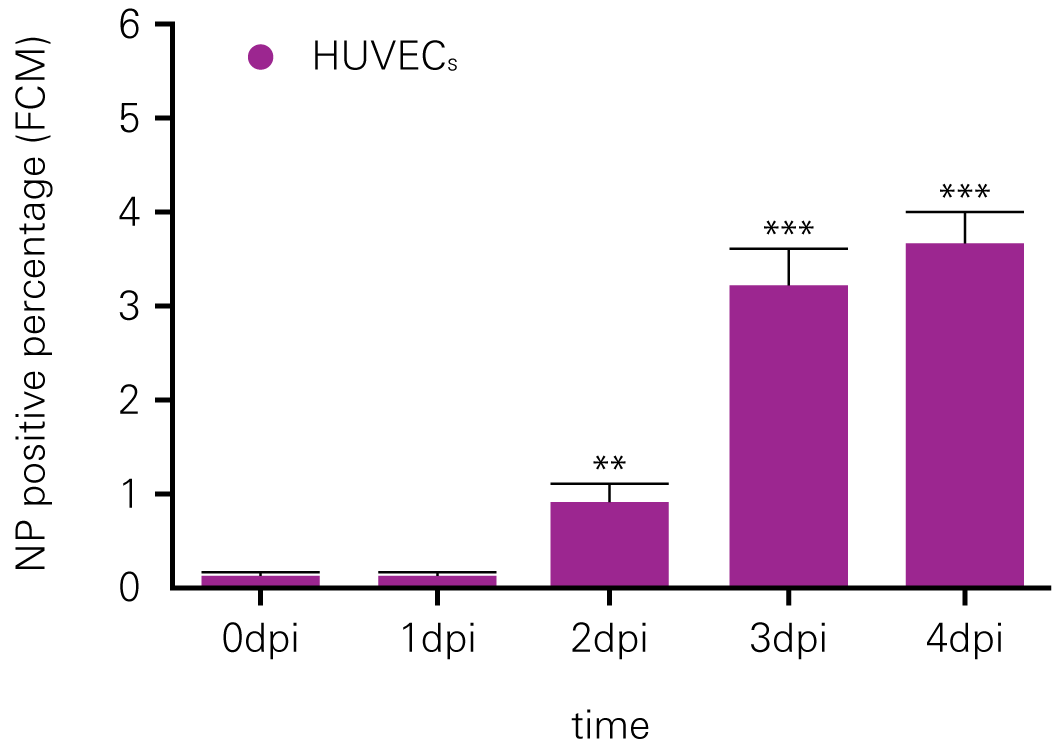
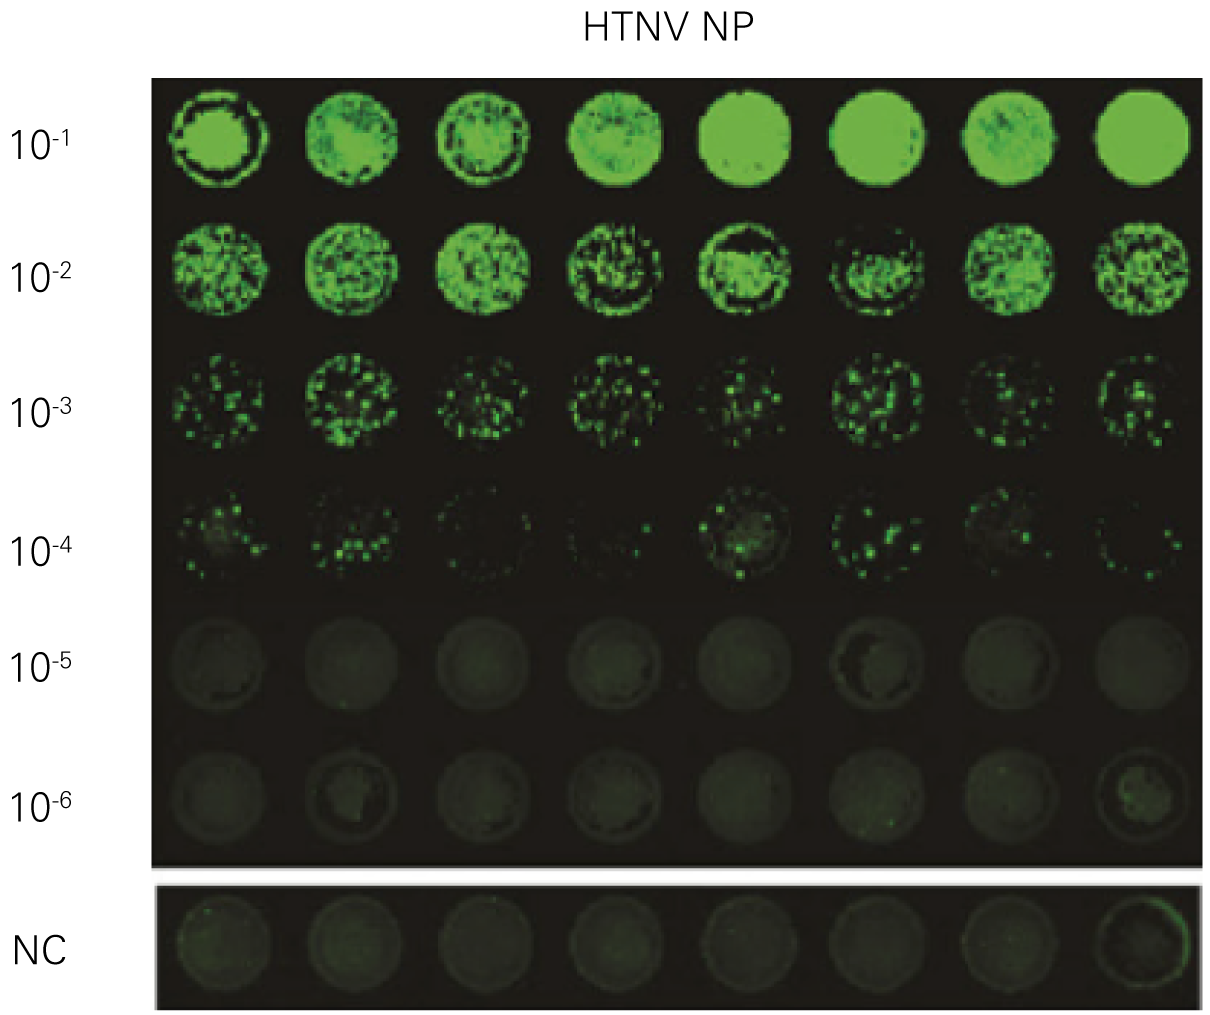
Detecting infectious virus titers commonly rely on visible CPEs; however, viruses such as the Hantaviruses do not produce CPE in cell culture. Instead, a study by Ma, H.W., et. al. sought to quantify virus replication by monitoring viral protein expression and neutralizing antibody (NAb) titers with Hantaan virus (HTNV)—the prototype hantavirus—using an In-Cell Western Assay.1
The study compared the In-Cell Western Assay with three common methods: qRT-PCR, FCM, and ELISA. It determined that the In-Cell Western Assay was as equally sensitive as qRT-PCR and ELISA and more sensitive than FCM. These results suggest that an In-Cell Western Assay is a highly accurate method for assessing HTNV and NAb titers, detecting NP expression and production, and evaluating HTNV replication.
A. In-Cell Western Assay
B. qRT-PCR
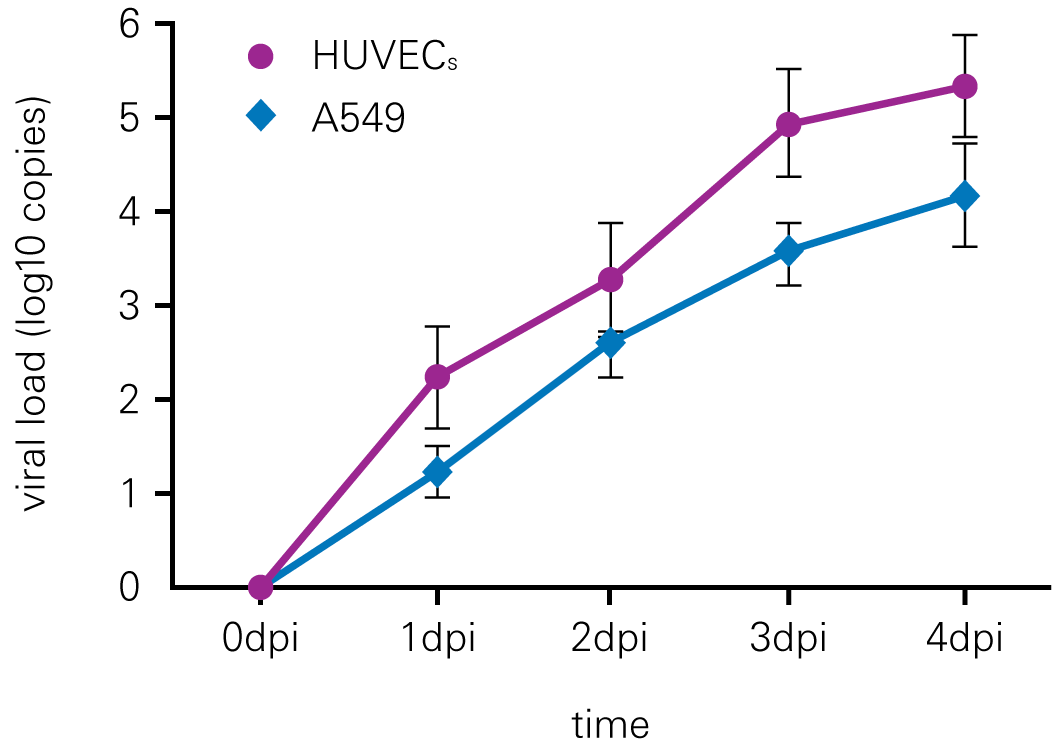
C. Flow Cytometry
A
B
C
D
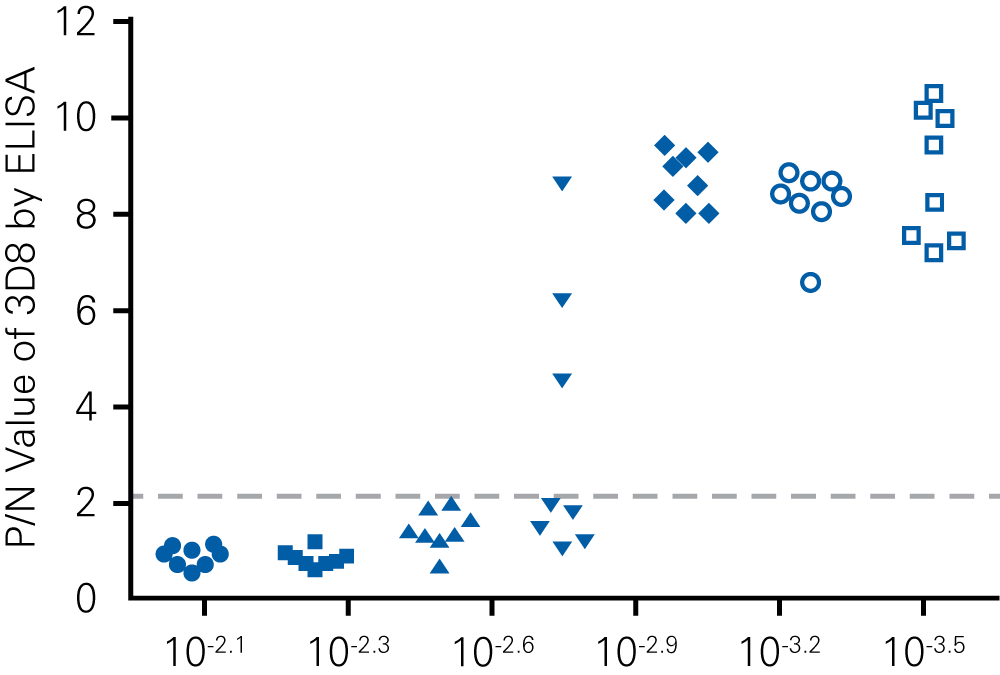
“For viral titer assessment, the TCID50 detected by the ICW assay was more convenient and rapid than the ELISA-based TCID50 assay.”
A
B
C
D
LI-COR considers it a great privilege to provide the products, tools, and services researchers need to learn more about SARS-CoV-2 and other viruses.
The Odyssey Viral Solution Package is currently available at a reduced price. This system is ready to be delivered immediately, and installation and training can be done virtually with a Solutions & Support Scientist.
Let us know how we can help you.
Get in touchYour information has been sent to our Product Support Team who will be following up with you.
If you do not receive a response within 2 business days, please contact: biosales@licor.com
When you complete this form, your information is collected by LICORbio (United States) and shared with LI-COR and its subsidiaries, LI-COR INC, LI-COR GmbH (Germany) and LI-COR Ltd (United Kingdom). LI-COR and its subsidiaries work closely together to provide scientific expertise and prompt responses to customers globally. Depending on your location, your information may also be shared with a distribution partner. For more details, view our Privacy Policy (www.licor.com/privacy) or contact privacy@licor.com.