What's New

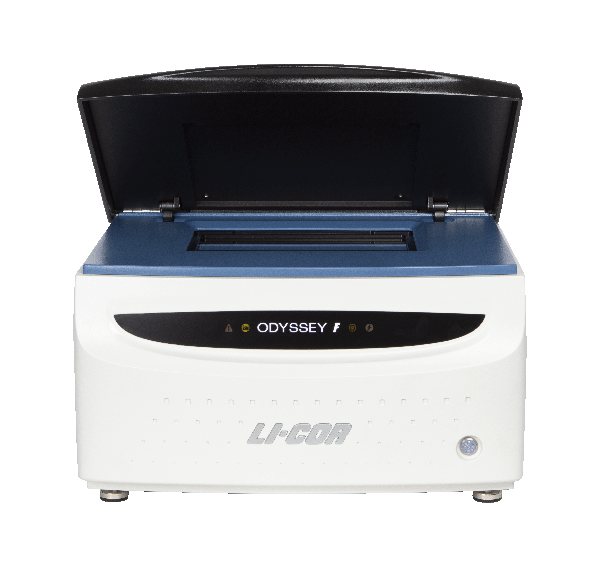
The latest version of Empiria Studio® Software is version 3.0. This pages highlights some important changes in Empiria Studio 3.0.

Support for More Assays!

You can now quantify slides in the Slide workflow. Empiria Studio also has a new workflow for quantifying small animal images acquired on the Pearl Trilogy Small Animal Imaging System. Use Collections A Collection is a group of Acquisitions. to quickly transfer images from LI‑COR® Acquisition Software 2.0 to Empiria Studio for analysis.

See Slide and Small Animal Image Analysis for more information.

Mouse image open in the Slide and Small Animal Analysis workflow in Empiria Studio.
Figure 243. You can now quantify small animal images in Empiria Studio.

Quickly Declutter Your Image Gallery

You can now delete multiple Acquisitions at the same time in the Image Gallery. Use CTRL + Click (⌘ + Click on macOS) or SHIFT + Click to select all the Acquisitions you want to delete.

Collections

A Collection is a group of image acquisitions. Collections help with organization and managing multiple images at the same time. For example, you can quickly set the display settings for all images in a Collection.

The blue dropdown arrow button next to the Image Gallery (or Collections) text is used to switch between viewing the Image Gallery and viewing Collections.
Figure 244. Click the blue dropdown arrow button next to the Image Gallery (or Collections) text to switch between viewing the Image Gallery and Collections.

Free Rotate

The Image Gallery now has an option to free rotate images. Open an image in the Image Gallery and click Free Rotate to rotate the image to the orientation you need.

Dot blot before free rotation to horizontally align dots.
Dot blot after free rotation to horizontally align dots.

Color Bars

Color bars, also known as color maps, can be displayed (when only one channel is visible) by adding the color bar to the image in the Image Gallery or in an Experiment workflow.

  • Click to view the color bar. In the Color Bar dialog, select Display on image to display the color bar on the image (when only a single channel is visible).

  • The color bar can be exported by itself or with the image.

This is a 700 channel image of a mouse with a color bar displayed.
Figure 245. In this image, a color bar is displayed for the 700 nm channel image.

Faster and Easier Process for Making Plate Templates

You can now change the Assay or Category for a Plate Template, and the other settings in the Plate Template will be preserved.

This makes it easy to copy an existing Plate Template and adapt it for a new purpose! As a reminder, you can also use the Preset Plate Templates that come with Empiria Studio or you can copy a Preset Plate Template to adapt it for your analysis. Click the copy button next to a Plate Template in the Template Library to copy it.

See Getting Started with Plate Templates for more information.

Empiria Studio Plate Template Add Details Page
Figure 246. You can now change the Assay and Category for a Plate Template without changing the other settings and steps. This makes it easier to copy and adapt existing Plate Templates for new uses.