For information about small animal image analysis, see Slide and Small Animal Image Analysis.
Slide Analysis
Examine, organize, annotate, and quantify slide images.
Start Microscope Slide Analysis
On this page, select the slide Acquisition(s) that you want to examine, organize, and annotate.
-
Click Image Gallery.
-
In the Select Acquisition dialog, use CTRL + Click (Command + Click on macOS) or SHIFT + Click to select multiple Acquisitions.
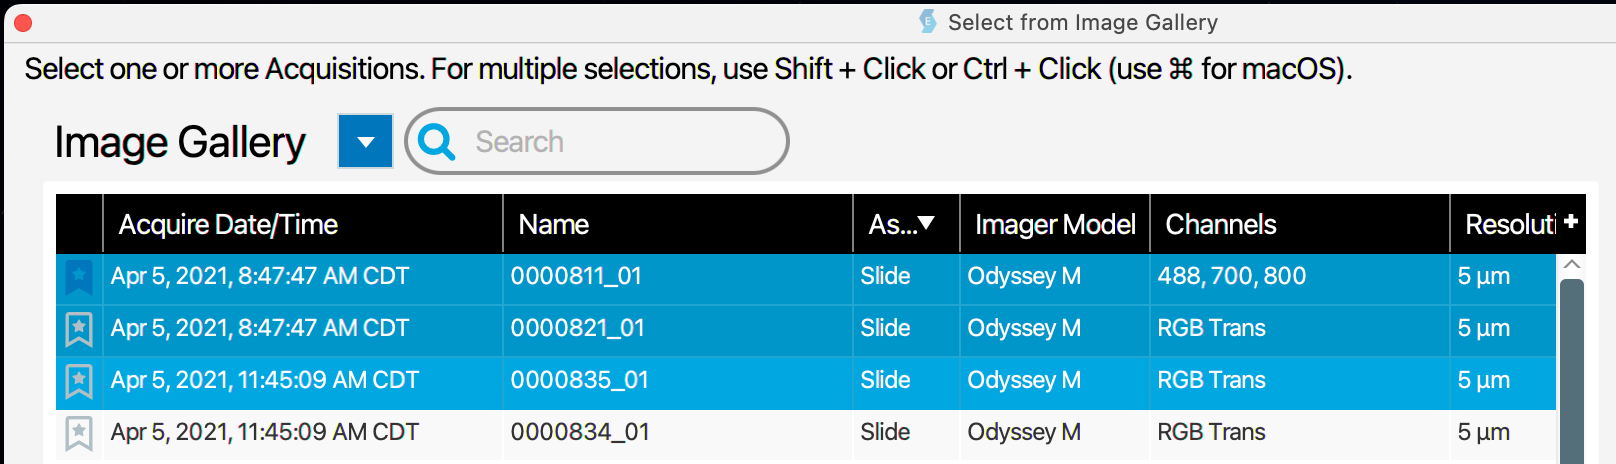
Multiple selected slide Acquisitions. -
Click Select.
Name
To help with record-keeping, give every Experiment a distinct name. The description field provides space for you to include important details about the Experiment.
Set up images
On the Set up images page, add images from your chosen Acquisitions to the figure. On the Report page, you can export this figure as a single image file.
-
Add the images in the order you want them to appear in the figure. Rows are created automatically as you add images.
-
Click Adjust All Display to simultaneously adjust the display settings for all the images and to make the display settings the same for all the images. Move the Adjust All Display Controls dialog to the side of the Empiria Studio window to watch how the images change as you change the display settings.
-
Right click an image, and then click Remove Image... to remove an image from the grid.
-
In the Columns menu, select the number of image columns you want in the figure.
-
In the Acquisitions list, select an Acquisition with images that you want to add to the figure.
-
In the Channels list, select the channels from the Acquisition that you want to add to the figure.
Leaving multiple channels selected will show an overlay of the Acquisition in the figure.
-
Click Add to Grid. The image for the selected channel (or the image overlay) will be added.
-
Repeat as needed for all the images you want to add to the figure.
-
To add multiple channels from an Acquisition to the figure separately, leave one Acquisition selected, change the selection in the Channel list, and click Add to Grid after changing the channel selection.
-
Rows will be added to the figure automatically as you add images to the figure.
-

Annotate Image
Click the zoom buttons above the image to make the displayed image smaller or larger . A zoom level, shown as a percentage relative to the size of the software window, is shown next to the zoom buttons. When the image is zoomed in, click and drag the image to see a different part of the image.
Shapes, text, and a scale bar can be added on this page. When one or more annotations are selected, options specific to the annotation(s) are displayed in the Options section of the control pane. The scale bar or text box can quickly be moved to one of the corners of the image by clicking a corner option 


 in the Options section.
Click  to adjust the display settings for images individually.
To delete a selected annotation, click Delete or press Delete on the keyboard.
Quantify Slide
-
Add a shape to define the region of interest (ROI) that you want to quantify.
Click or to draw a circle or square around the ROI.
Click to draw an irregular polygon around the ROI. You can move, add, and delete points from the irregular polygon to tightly fit it around the ROI.
-
Press ALT (⌥ on macOS), and click the polygon to add a point.
-
Hover the mouse pointer over a point and press Delete to delete a point.
-
-
Add a shape to define the background region (see the previous step for information about adding shapes to the image).
-
With the background shape selected, click Assign Background.
If you want to assign more than one background or more than one ROI, use the Link Shapes/Backgrounds option to associate the ROI shapes and background shapes in the way that is appropriate for your analysis.
-
When your ROI and background shape are defined the way you need, you can view quantification data by clicking
 Analysis Table.
Refine
Click Refine to more specifically define the pixels in the ROI that you want to quantify.
When the Refinement tool is applied to selected shape(s) on the image, pixels below a user-defined threshold intensity are eliminated from the calculation of Signal for the shape(s). This is similar to some image mask features in some software applications that hide some pixels in the image from view. However, the refinement tool affects only quantification and does not change the image view. See Refine Quantification Tool in the Calculations Section for more information.
Review and report
The data in the report is organized into sections. Click to expand a section to view data and export options.
Images
-
If you want to view your slide images in a third-party software (e.g. Fiji), select the slide Acquisition in the Image Gallery and click . Locate the exported Zip File and extract it. Use the TIFF file in the extracted folder in the third-party software. Do not attempt to analyze files exported for publication or presentation.
-
Click Export above an image to export the image. Images can be exported as a high resolution TIFF for publication in a journal or as a PNG appropriate for slide show presentations. Do not use these images for analysis.
-
The units for image size can be set to English or metric on the General Options page.
-
Click Hide features to hide annotations. If annotations are hidden, they will not be included in the exported image or report.
Export Menu Options
On the right side of the window, there is a menu with three export options.
-
Click PDF Report to export a PDF of the images and data on the Review and report page.
-
Click Experiment File to export all the images, quantification steps, and data from this Experiment to a single file that can be imported into Empiria Studio on another computer.
-
Click All Report Images to export all images from the Experiment to separate files for use in print publications or digital media (such as a slide presentation). Do not use these images for analysis.
In the export dialog, click Browse to find a parent folder for the images and enter a name for a new folder in the Folder Name field. The images will be exported into the new folder, which will be inside the parent folder.
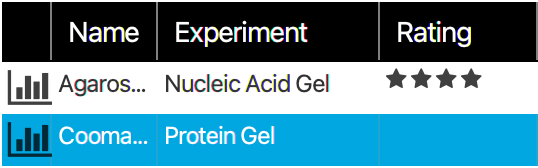
Rate Experiment
Rate the Experiment for your records. This is an opportunity to record if the Experiment went "well" or not, depending on the specific requirements for your research.
Done
Click Done to mark this Experiment as complete and return to the Experiment List.