Programming examples
The Biomet Programs are good examples to follow if you want to create a custom program. You can start with a program and customize it, or you can make a program from scratch, using a biomet program as an example. In this section, we break down the programming for several sensors.
Data Acquisition Module
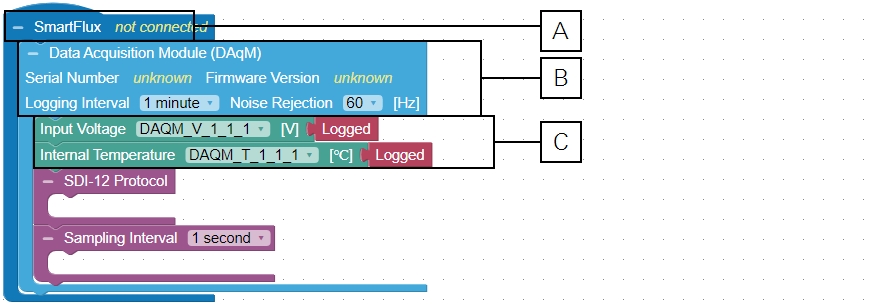
- The top level of every program is the SmartFlux block.
- The Data Acquisition Module (DAqM) block specifies the Logging Interval for all sensors contained within and noise rejection.
- Two variables can be logged directly under the block: DAqM Input Voltage and Internal Temperature. The presence of a Logged block indicates that these variables are logged with the associated variable name and units.
Each DAqM in the system will be uniquely identified. You can set the logging interval to whole number minutes or hours. The logging interval applies to all sensors connected to the DAqM. Choose the Noise Rejection setting that corresponds to the main power frequency in your region (e.g., 60 Hz in the US, 50 Hz in Europe).
Data Retention Module
This example describes the basic functions of the Data Retention Module block. The DRM container should be the first container in your program.
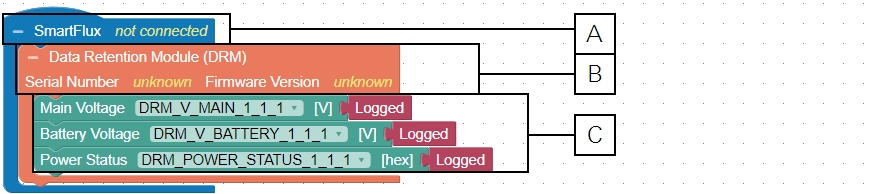
- The top level of every program is the SmartFlux block.
- The Data Retention Module (DRM) container indicates the serial number and firmware version (if connected) of your system.
- Three variables can be logged directly under the block: Main Voltage, Battery Voltage, and Power Status. The presence of a Logged block indicates that these variables are logged with the associated variable name and units.
SDI-12 soil probes (HydraProbe)
This example shows an SDI-12 configuration, using the Stevens HydraProbe as an example. Each SDI-12 sensor requires a unique address. For the Stevens HydraProbe, the measurement set defines which variables are sent from the sensor. Measurement Set M specifies a default set of variables. Measurement #1 and #3 are soil water content and soil temperature, which are logged as SWC_1_1_1 and TS_1_1_1, respectively.
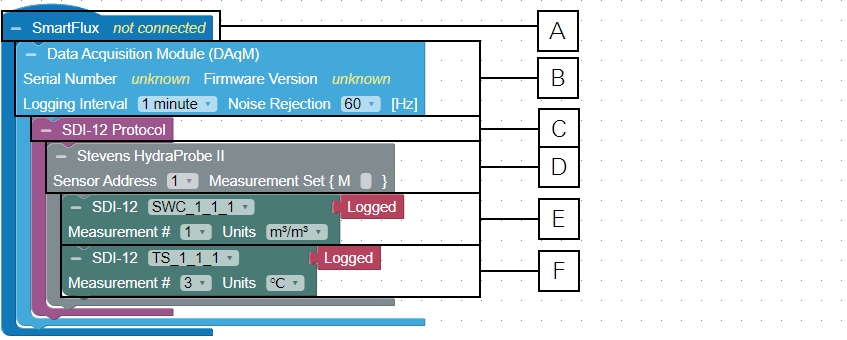
- The top level of every program is the SmartFlux block.
- The Data Acquisition Module (DAqM) block specifies the Logging Interval for all sensors contained within and noise rejection.
- The SDI-12 Protocol container holds blocks for SDI-12 sensors.
- The Stevens HydraProbe block represents one of the HydraProbes. The Sensor Address must be set to the address of your sensor. Change the address to match that of your sensor. The Measurements Set represents a setting in the HydraProbe.
- The first SDI-12 block represents one of parameters measured by HydraProbe and logged to dataset. In this case, it is soil water content (SWC_1_1_1). The Measurement # represents the parameter # in the sensor (1 is soil moisture). The units should be set appropriately for the variable.
- The second SDI-12 block represents another parameter measured by the HydraProbe and logged to the dataset. In this case, it is soil temperature (TS_1_1_1). The Measurement # represents the parameter number in the sensor (3 is temperature in °C). The units should be set appropriately for the variable.
Soil heat flux plates (Hukseflux)
This example shows an analog sensor, using a regular soil heat flux plate as an example. Since this is a differential measurement, two channels are required.
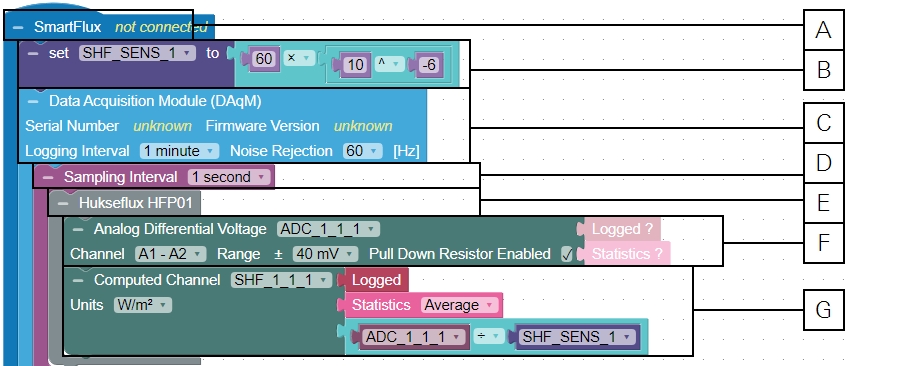
- The top level of every program is the SmartFlux block.
- The multiplier is the calibration constant for the heat flux plate.
- The Data Acquisition Module (DAqM) block specifies the Logging Interval for all sensors contained within and noise rejection.
- The Sampling Interval block specifies how often the sensors within are sampled.
- The Hukseflux HFP01 container specifies a regular soil heat flux plate.
- The Analog Differential Voltage block specifies an analog differential input (A1 and A2, in this case). The variable name identifies this as ADC_1_1_1. It is a differential measurement, so two channels are specified. Range is the voltage range for the sensor signal; select Pull Down Resistor Enabled in this case. Since this block represents the analog voltage, we aren't logging it or computing any statistics.
- The Computed Channel block transforms the analog voltage into meaningful data by naming the variable (SHF_1_1_1, in this case), specifying the units, and applying the calibration multiplier (as a variable). The Logged block instructs the system to log the variable; the Statistics block specifies the statistics to perform prior to logging, and the math block specifies "divide ADC_1_1_1 by a variable" before logging.
Tipping bucket rain gauge (TR-525M)
This example shows a pulse-counting channel, using a tipping bucket rain gauge as an example.
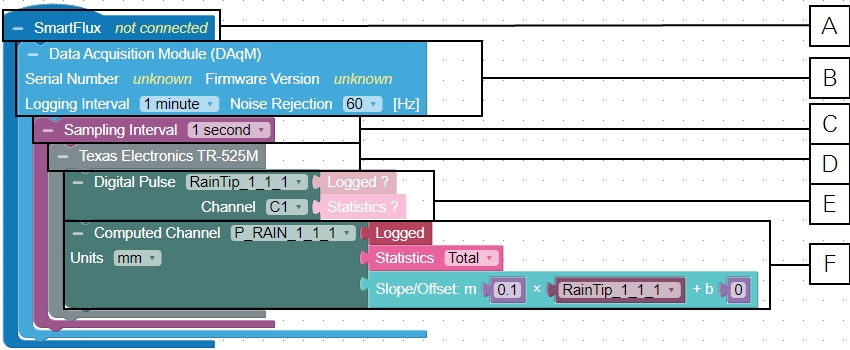
- The top level of every program is the SmartFlux block.
- The Data Acquisition Module (DAqM) block specifies the Logging Interval for all sensors contained within and noise rejection.
- The Sampling Interval block specifies how often the sensors within are sampled.
- The Texas Electronics TR-525M block specifies a TR-252M tipping bucket rain gauge.
- The Digital Pulse block configures an input (C1) to read data. The variable (RainTip_1_1_1) is named to describe what it does. The raw data aren't logged.
- The Computed Channel block transforms the reading into meaningful data by naming the variable (P_RAIN_1_1_1, in this case) and specifying the units. The Logged block instructs the system to log the variable; the Statistics block specifies the statistics to perform prior to logging, and the Slope/Offset block uses the equation to convert the value to units (each tip equals 0.1 mm of liquid precipitation).
Soil temperature thermistor (LI-COR 7900-180)
The 7900-180 soil temperature thermistor is a single-ended analog sensor that requires excitation voltage. This example describes how to connect the sensor and configure a program.
Configuration
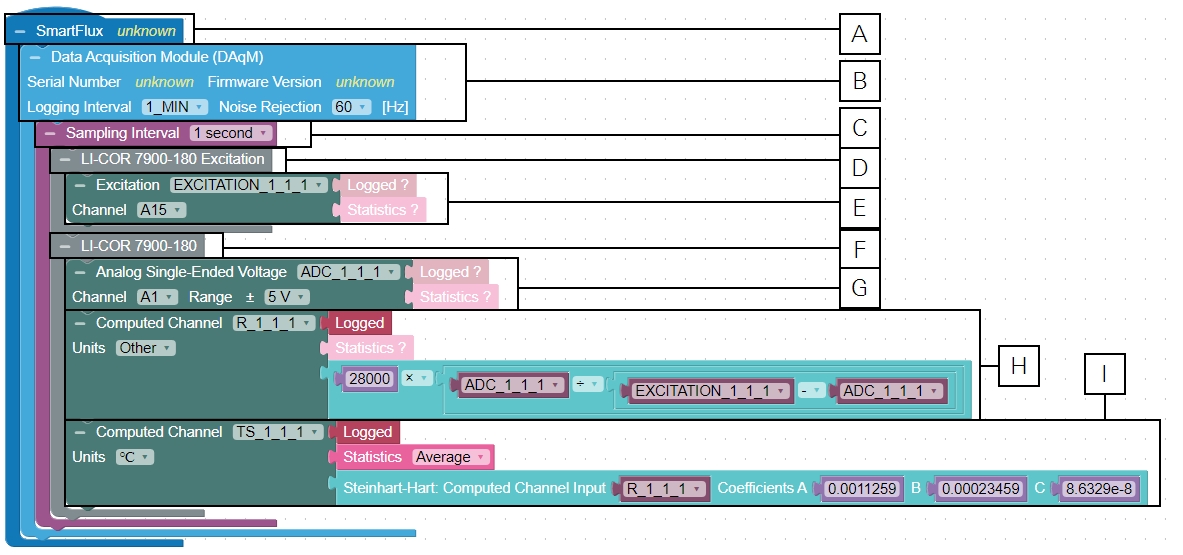
- The top level of every program is the SmartFlux block.
- The Data Acquisition Module (DAqM) block specifies the Logging Interval for all sensors contained within and noise rejection.
- The Sampling Interval block specifies how often the sensors within are sampled.
- The LI-COR 7900-180 Excitation block is a container for the excitation block.
- The Excitation block instructs the DAqM to provide excitation voltage over channel A15. It is prepopulated with the EXCITATION_1_1_1 variable.
- The LI-COR 7900-180 block is a container for the channel blocks.
- The Analog Single-Ended Voltage Channel block names the variable (ADC_1_1_1 in this case), specifies the channel for the analog input (A1), and specifies the voltage range. Since this block is the analog voltage, we aren't logging it or recording statistics.
- The first Computed Channel block transforms the variable (28000*(ADC_1_1_1/(EXCITATION_1_1_1-ADC_1_1_1).
- The second Computed Channel block applies the Steinhart-Hart equation to R_1_1_1 and records the soil temperature (TS_1_1_1) in °C.
Wiring
In the example program, channel A1 is the analog input that reads voltage from the probe. G1 is the ground. Excitation voltage is provided through channel 15.
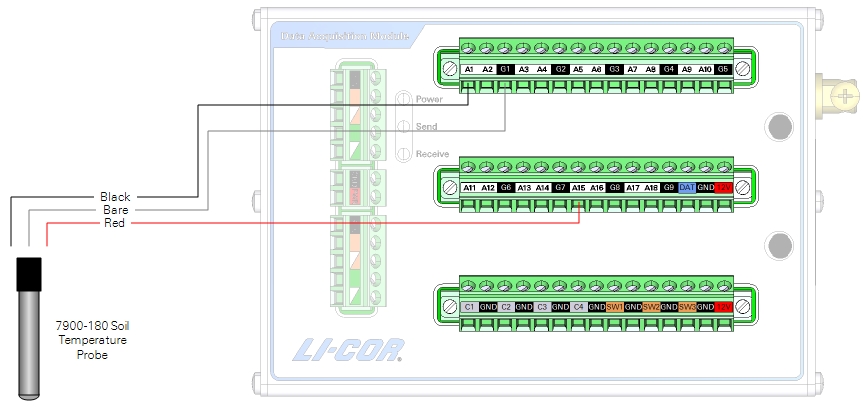
| Wire color | Description | DAqM Terminal |
|---|---|---|
| Black | Temperature from the probe | A1 |
| Bare | Ground | G1 |
| Red | Excitation Voltage | A15 |
Propeller anemometer (R.M. Young Wind Monitor)
This example shows how to add an R. M. Young 05103V Wind Monitor propeller anemometer to the DAqM. The Wind Monitor 05103V provides data over two voltage signals (one for wind speed and another for wind direction). The Blueprint Utility will be configured to read data from two analog single-ended channels.
Configuration
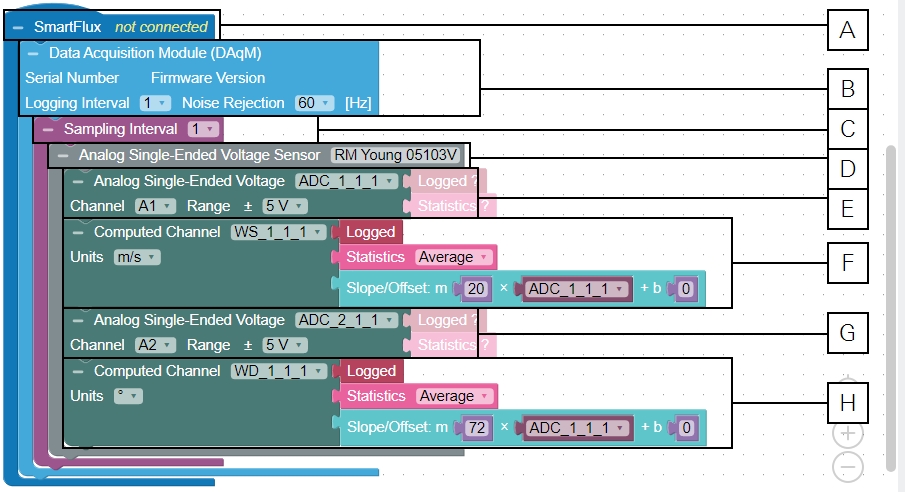
- The top level of every program is the SmartFlux block.
- The Data Acquisition Module (DAqM) block specifies the Logging Interval for all sensors contained within and noise rejection.
- The Sampling Interval block specifies how often the sensors within are sampled.
- The Analog Single-Ended Voltage Sensor block allows you to name the measurement (RM Young 05103V in this case).
- The first Analog Single-Ended Voltage block includes a variable name (ADC_1_1_1, in this case), the channel on the DAqM terminal strip (A1, in this case), and the range. Since this is the raw voltage signal, we are not logging it or computing statistics from it.
- The first Computed Channel includes the variable name that will be logged (WS_1_1_1 for Wind Speed and first repetition) and the units. The Logged block instructs the system to log the variable; the Statistics block specifies the statistics to perform prior to logging, and the Slope/Offset equation specifies the transformation that should be applied to the voltage signal (ADC_1_1_1) prior to logging.
- The second Analog Single-Ended Voltage block includes a variable name (ADC_2_1_1, in this case), the channel on the DAqM terminal strip (A2, in this case), and the range. Since this is the raw voltage signal, we are not logging it or computing statistics from it.
- The second Computed Channel includes the variable name that will be logged (WD_1_1_1 for Wind Direction and first repetition) and the units. The Logged block instructs the system to log the variable; the Statistics block specifies the statistics to perform prior to logging, and the Slope/Offset equation specifies the transformation that should be applied to the voltage signal (ADC_2_1_1) prior to logging.
Wiring
In the example program, channels A1 and A2 are the analog inputs that read wind speed and wind direction, respectively. Power can be provided through the DAqM (as shown) or from an external power supply.
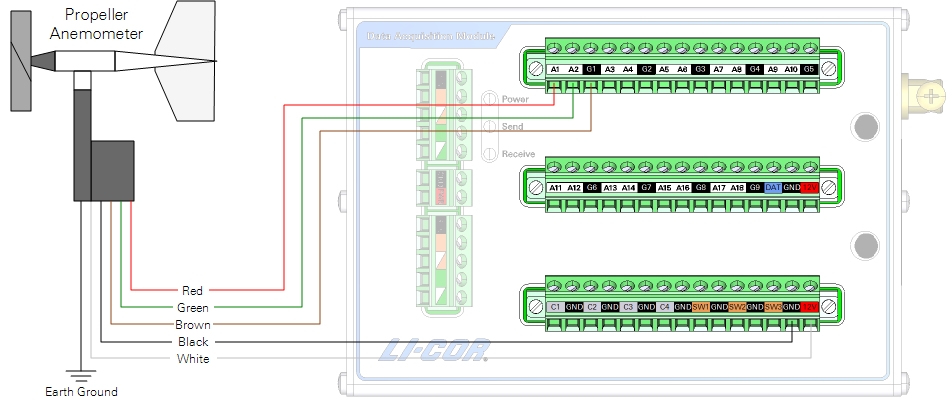
| Wire color | Description | DAqM Terminal |
|---|---|---|
| Red | Wind Speed Voltage Output | A1 |
| Green | Wind Direction Voltage Output | A2 |
| Brown | Output Reference | GND |
| Black | Power Reference | GND |
| White | +8 to +24 VDC Power | 12 VDC |
| Ground | Connects to earth ground | n/a |