Viewing and evaluating data
The relationship between variable label and sensor position
Each program in the Biomet Library includes a set of Constants and Variables. Constants represent values that do not change over time, such as a sensor calibration multiplier. Variables represent recorded values that may change over time, such as air temperature. Variable names present a simple way to organize and differentiate measurements from different sensors on the basis of position and replicate number. If you have multiple soil temperature sensors at a station, or multiple eddy covariance stations at a site, variable names will keep them organized.
Anatomy of variable labels
Variables are labeled according to the convention described below. Labels include a alpha-numeric code that identifies the parameter, horizontal position, vertical position, and replicate number (see Figure 6‑1). If you use a custom program, variables are logged with the label you specify in the program. Use the conventions described here to ensure that EddyPro will process your data and to have a simple way to keep track of which sensor is which.
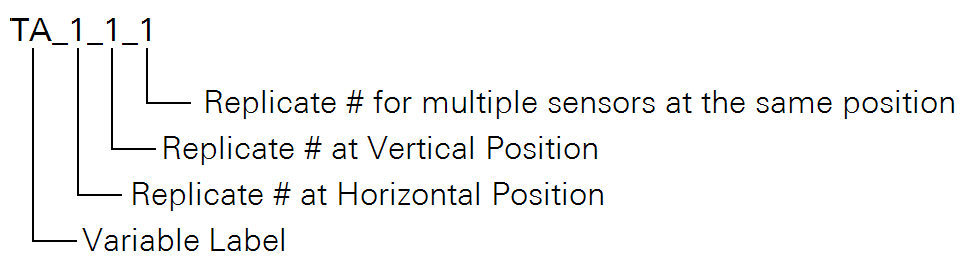
Sensor position and replicate number
The position and replicate number of each sensor is indicated by the variable label. Figure 6‑2 shows an example with biomet sensors and variable labels. Figure 6‑3 shows an example with two towers and additional air temperature sensors.
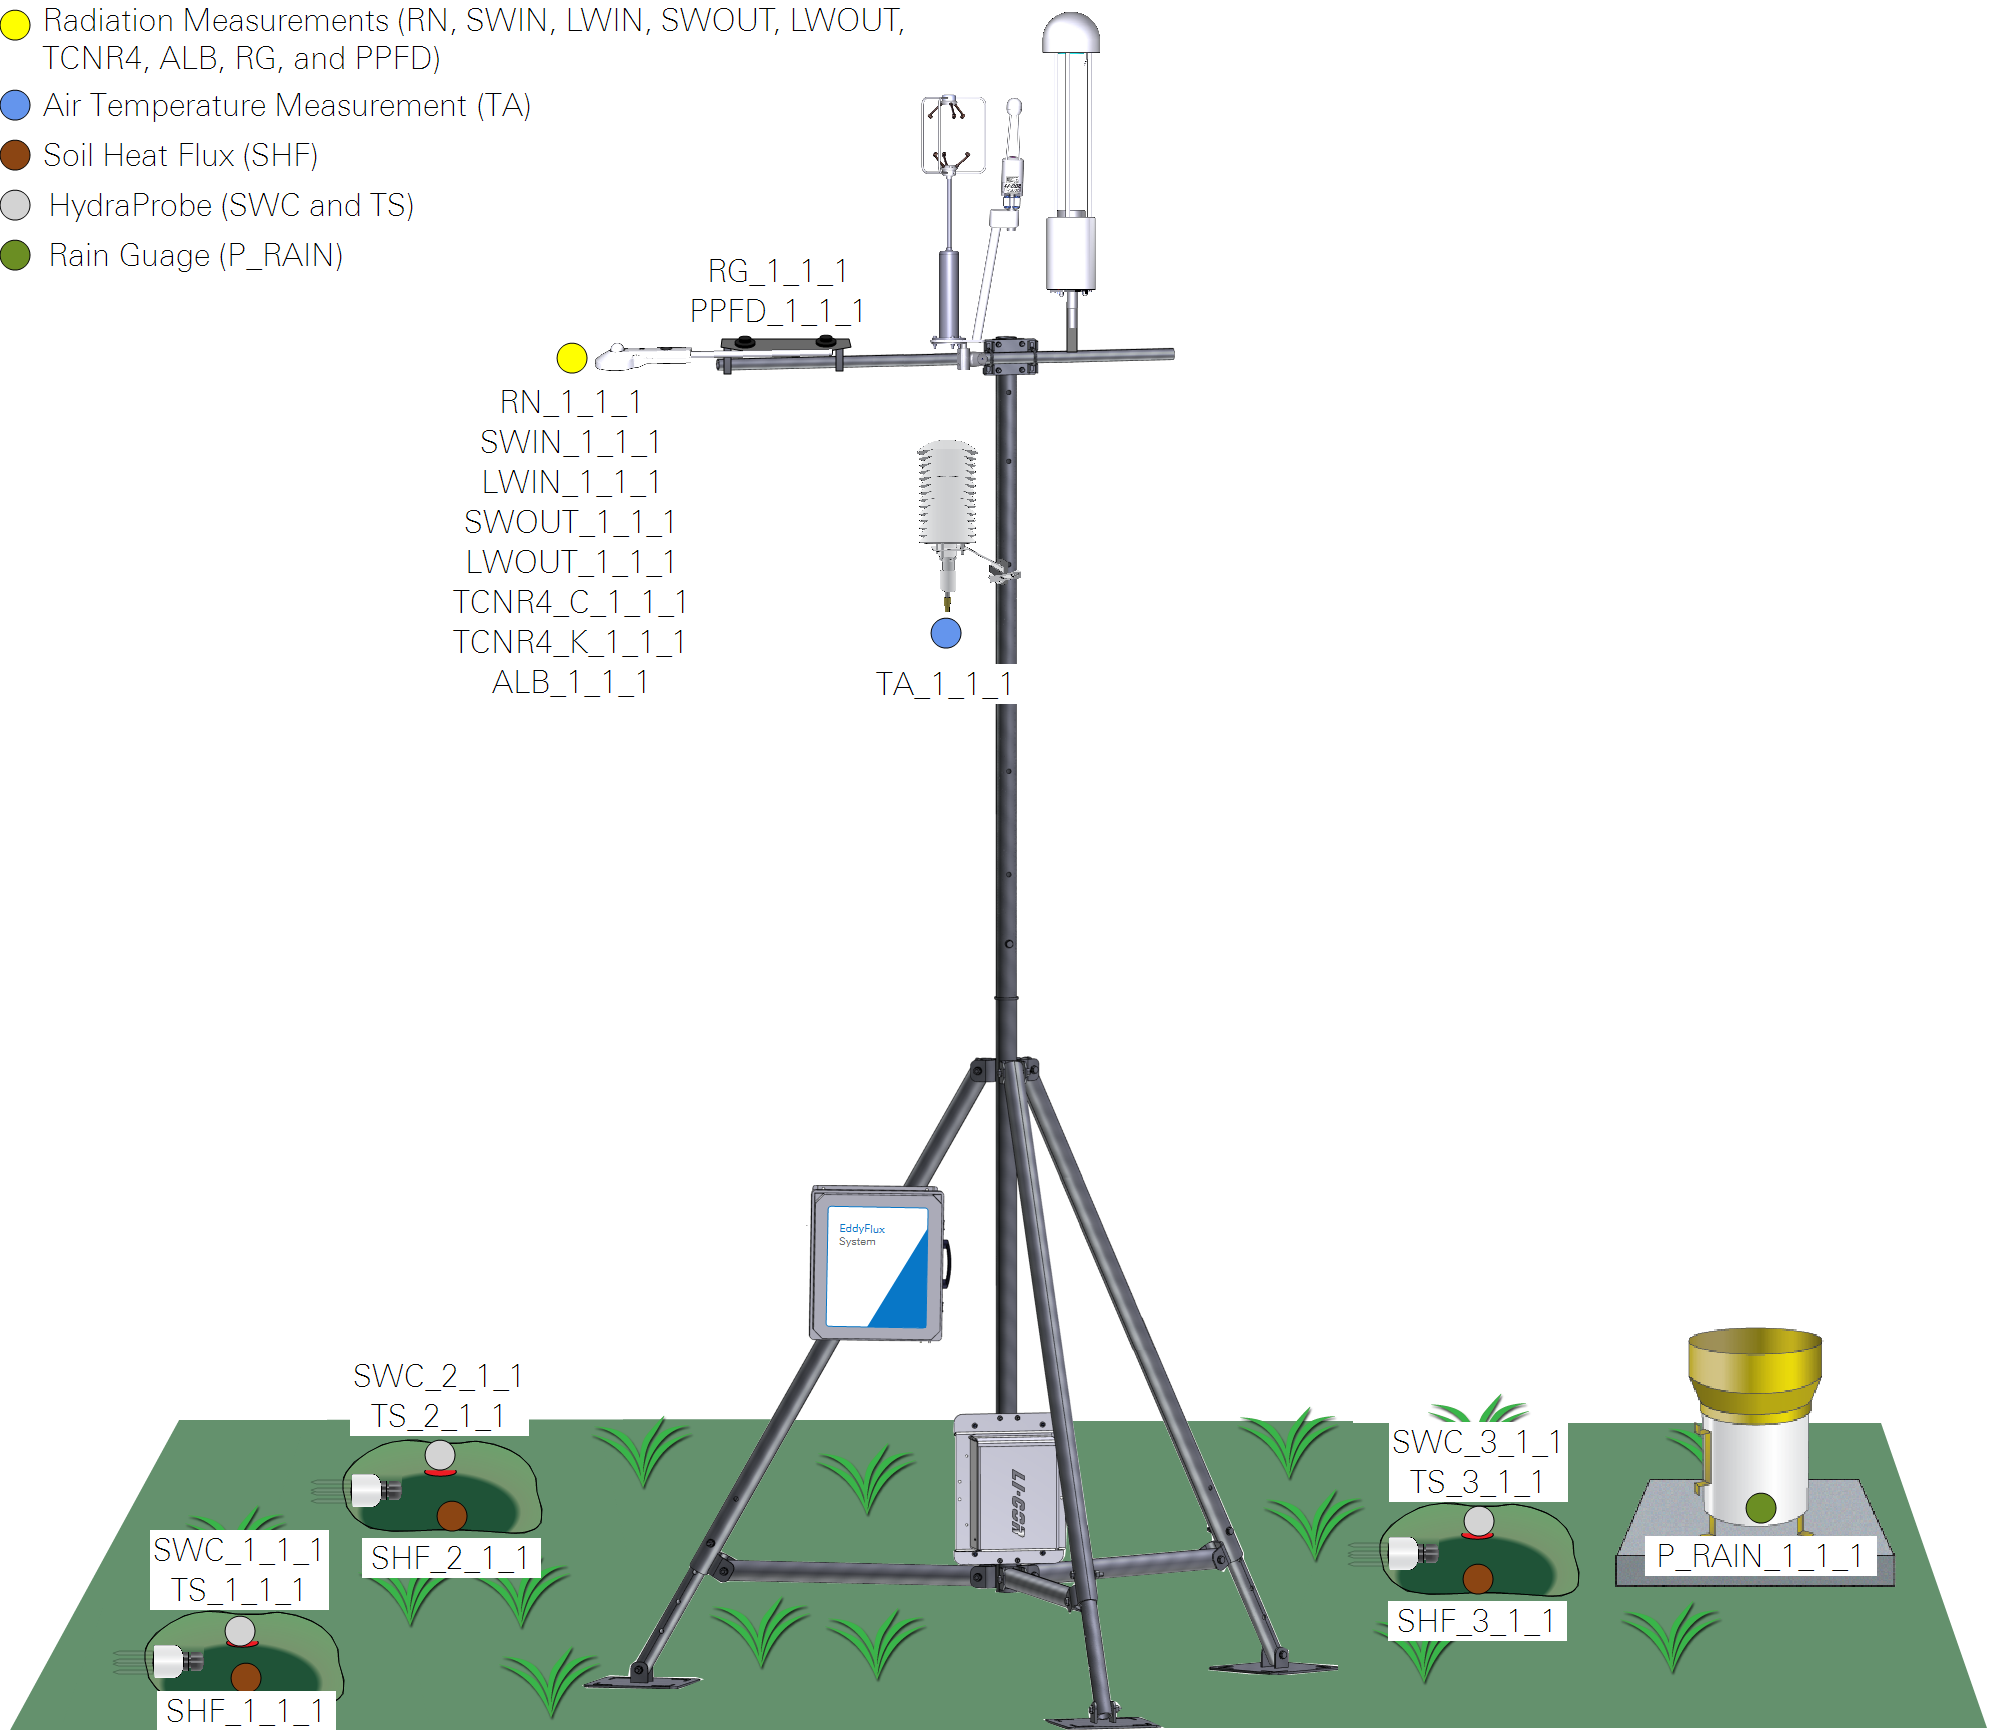
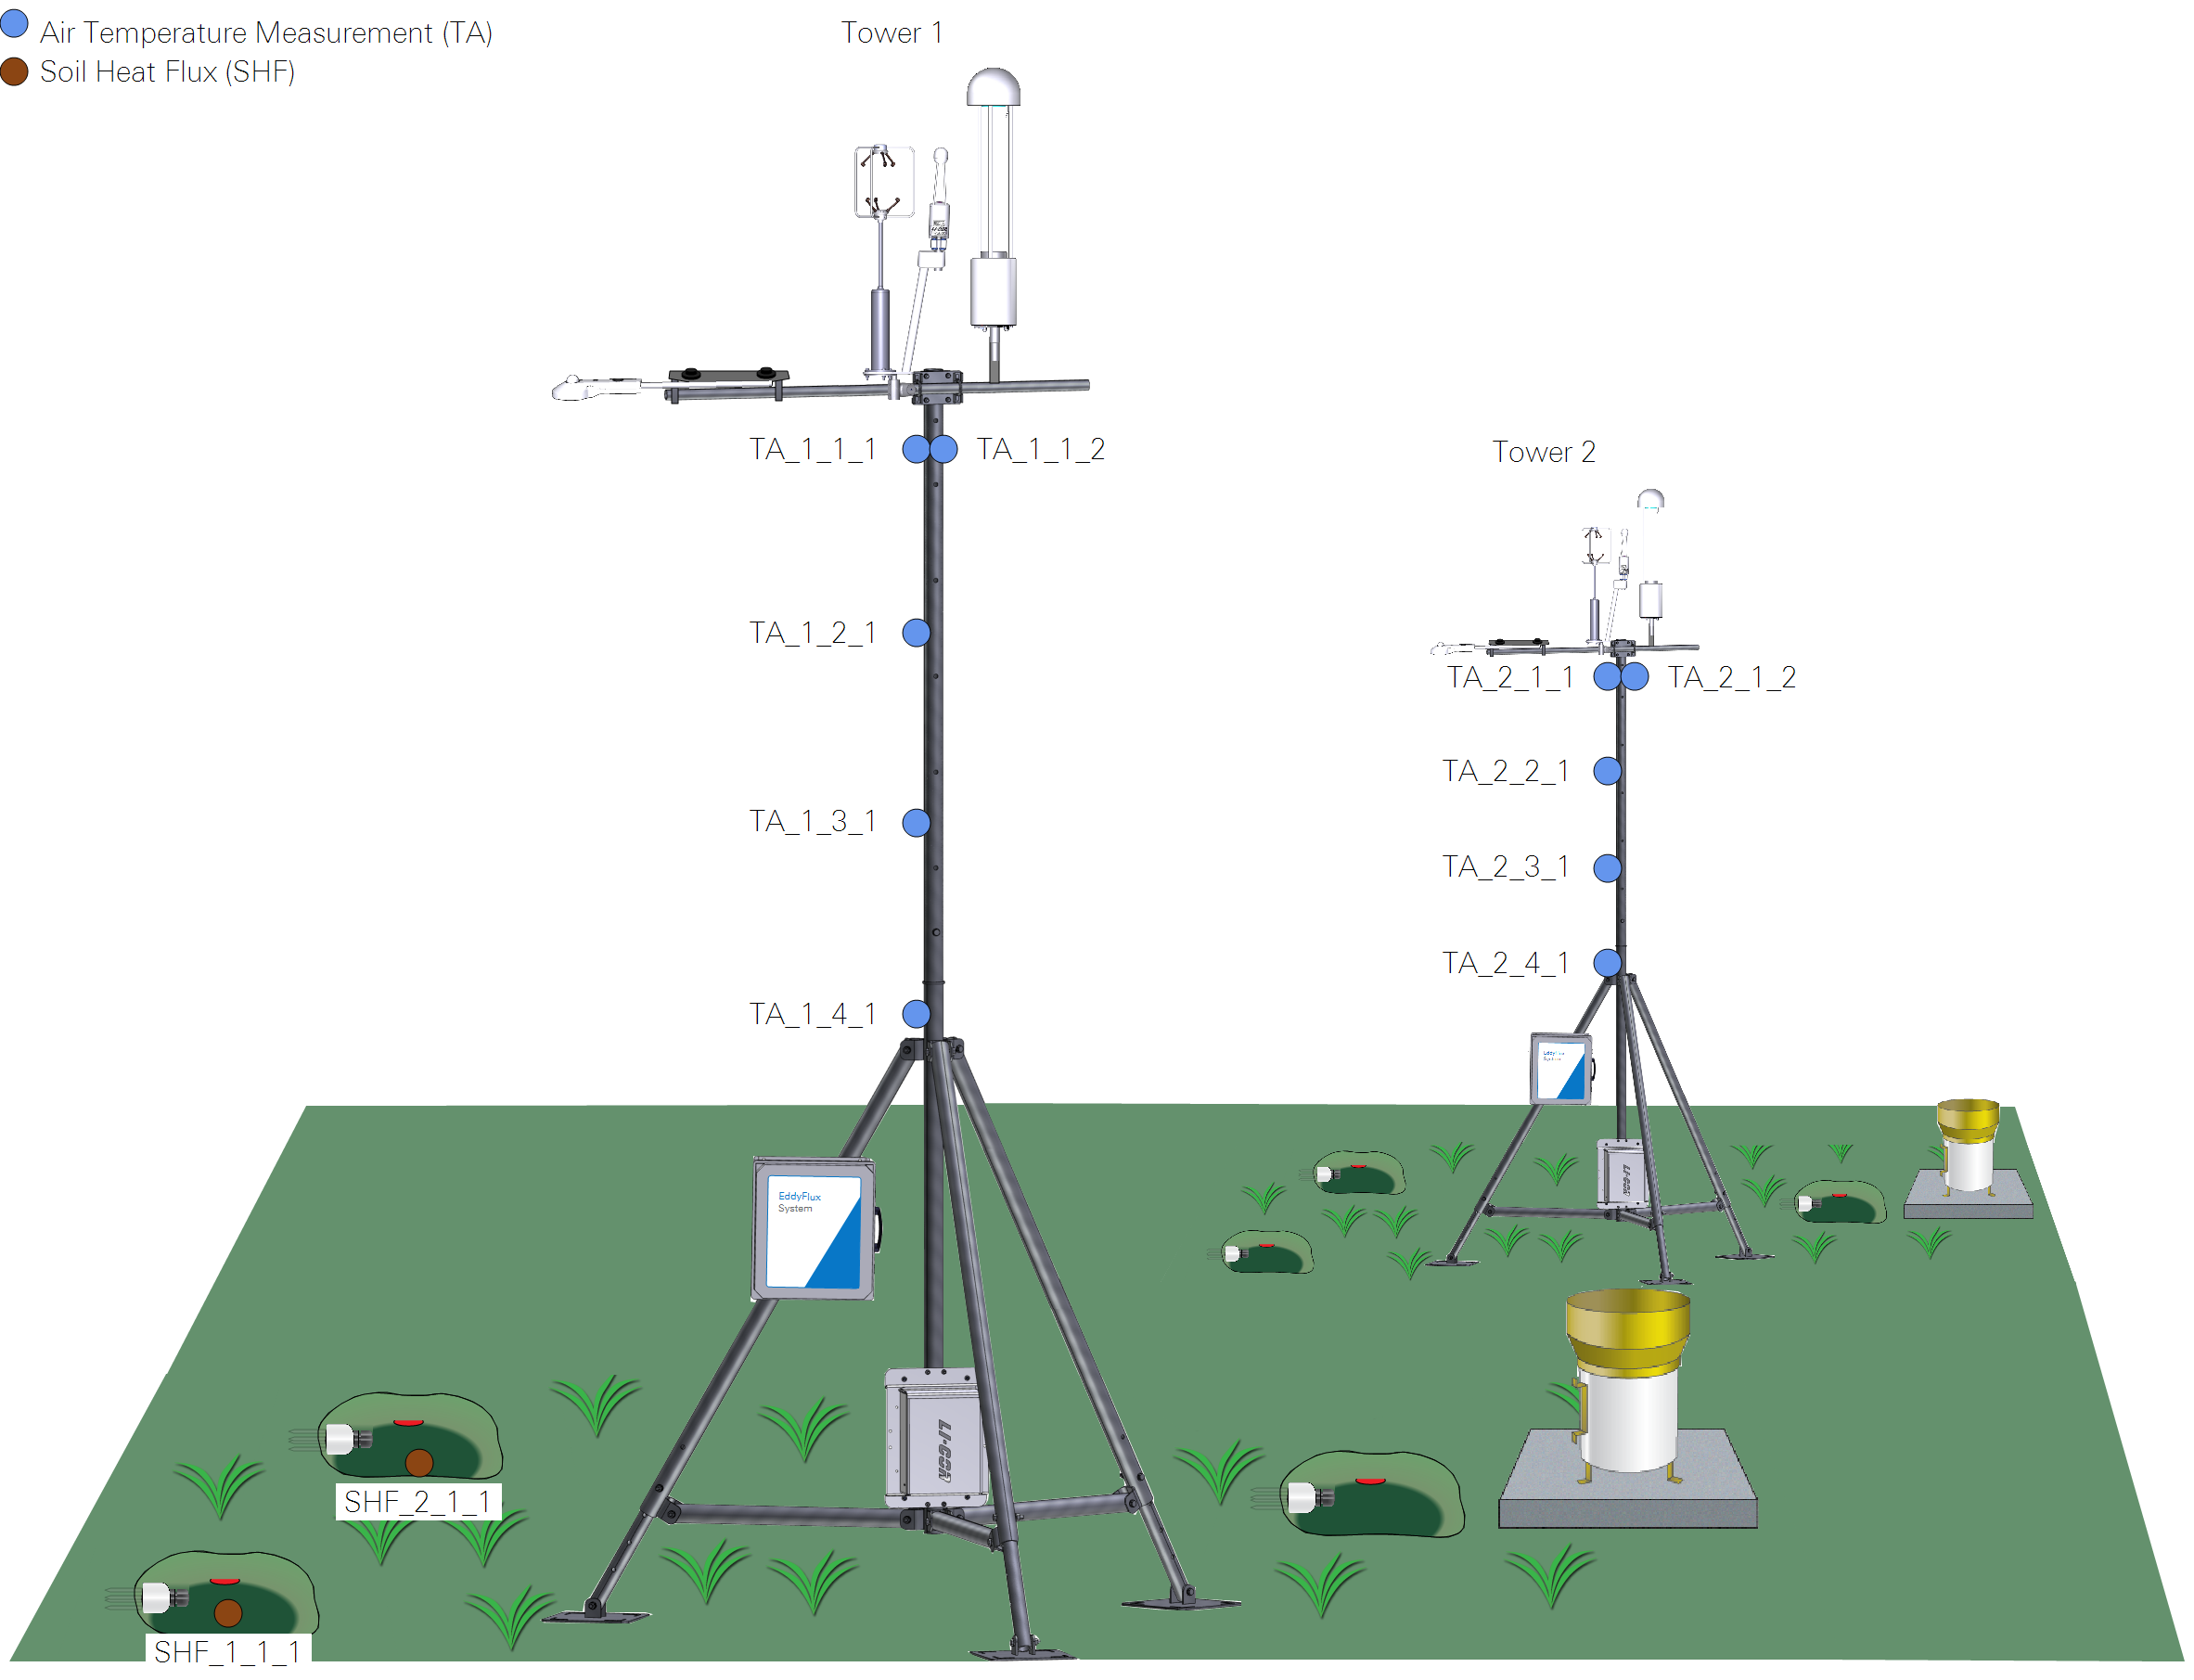
Although EddyPro can "blindly" summarize any variable, including variables that are not listed here, it is unable to use the variable in flux computations (e.g., air temperature) unless the variable is identified according to the naming convention described in this section.
Viewing live data from the instruments
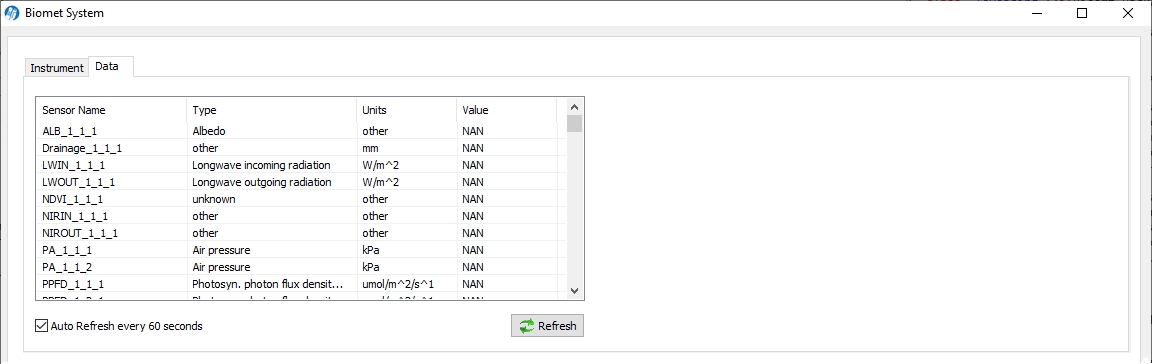
Measured values can be viewed in the gas analyzer PC application software (known as the GHG software for the LI-7500A/RS/DS and LI-7200/RS). Data are refreshed every 60 seconds. These data provide a quick check to see if sensors are providing plausible values and responding as expected.
In the gas analyzer software, click Biomet. Under the Data tab, you'll see a list of sensors, units, and data values.

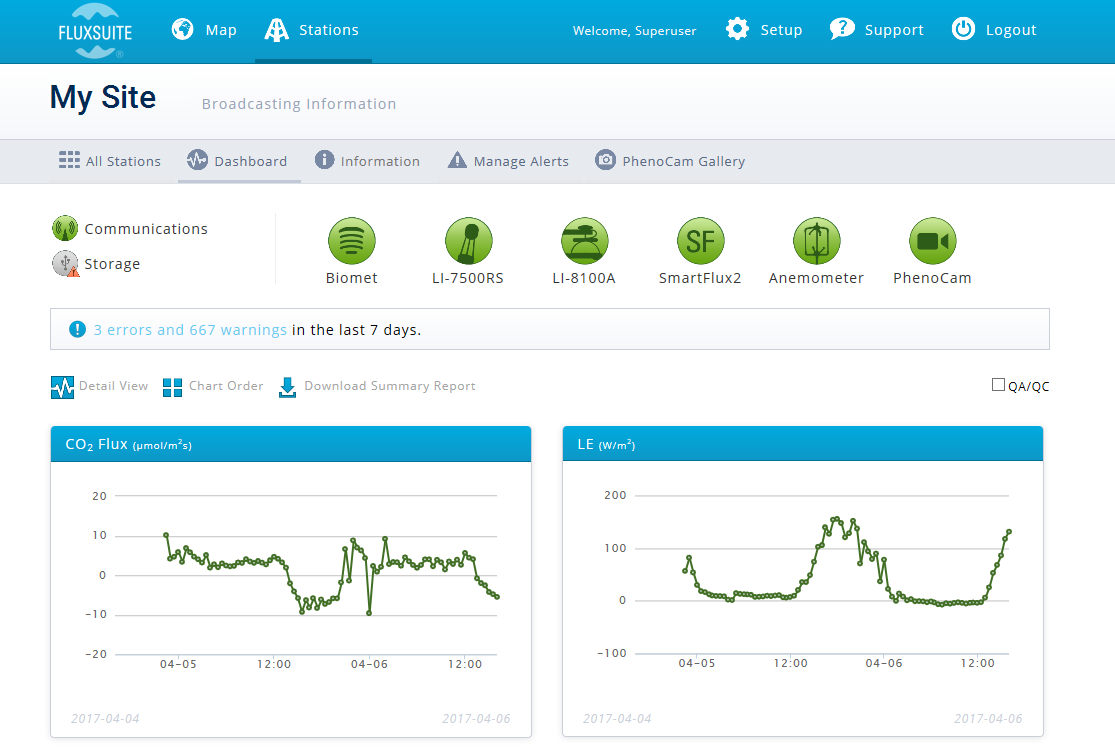
Viewing data in FluxSuite
FluxSuite Software (fluxsuite.com) is a cloud-based application that provides near real-time access to site status information, processed flux results, biomet data, and images taken with a PhenoCam. Contact LI-COR or your distributor for more information.
![]()
Copying data files from the SmartFlux System
Files can be managed using the Download utility that is built into the gas analyzer PC software or a Secure File Transfer Protocol (SFTP) application.
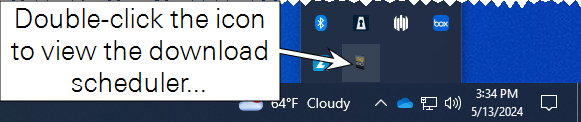
Using the Download utility
The Download utility allows you download and delete files that are stored on the USB device in the SmartFlux System. You can access the files remotely, so long as you can connect to your instrument over a network. The utility is a component of the gas analyzer software. Click the Download button to launch it.
![]()
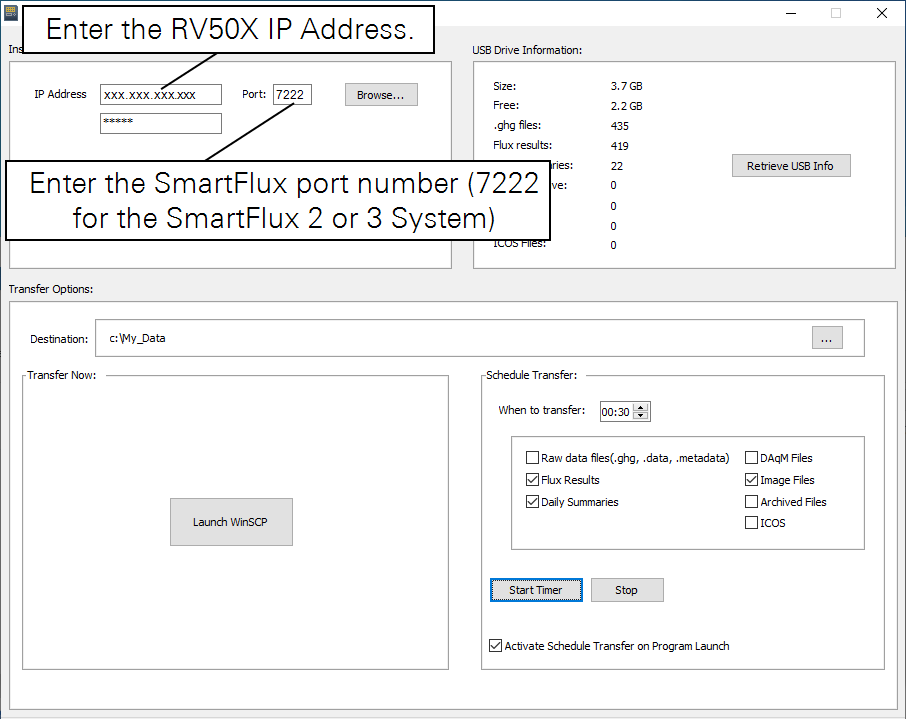
The application should automatically connect to the instrument, but if it doesn't, click Browse to view a list of instruments on the network. Select the instrument, click OK, enter the password (licor) and click Verify Connection. You may need to set the port if you are connecting with a cellular or satellite gateway. If your instrument is not listed, type the IP address into the IP Address field. If you are using a RV50X, set the Port to the same number that you have opened in the RV50X software.
USB Drive Information displays the size of the USB drive, available memory, number of each type of file.
Transfer Options are used to configure settings and other features:
- Transfer Now will allow you to use WinSCP to transfer files. WinSCP is a free file transfer application that can be installed as part of the win-GHG application. Click Launch WinSCP to open the application.
- Destination: This is where the transferred files will be saved. Ideally, this will be a directory on your computer. If you are transferring files to a server or cloud-based service such as a Dropbox, this is configured in the SmartFlux section of the application.
- Schedule Transfer: This section allow you to configure automatic file downloads to a computer.
- When to transfer: You can Transfer files daily at a scheduled time.
- You can close the application to your system tray (close it, but choose No) so it continues running in the background. Also be sure your computer does not go to sleep before the scheduled transfer. You may need to re-start the automatic download service if your computer is shut down and re-started.
- Files to transfer: Select any or all file types to transfer data files (you must select a file type before files are displayed). When you check a box, a corresponding tab is added to the box on the right. Here you can choose to download specific files or all of them.
- After configuring the transfer and selecting files, click Start Timer and allow the application to run in the background so it can download files as scheduled.
Tips for the Scheduled Download utility:
- If the downloader is already running, open it from your system "tray" rather than starting another instance of it.
- Set the download to begin at 00:15 (12:15 am) if you are using the SmartFlux System. That way all the logged files for the previous day will be processed before the download begins.
- Close the application to your system tray to keep it running in the background. Be sure the computer that runs the application is on and not in power saver mode.
Using an SFTP application
You can also use third-party file transfer (SFTP) applications to transfer data, such as WinSCP or another application. In this case, connect using the instrument IP address and the following settings:
- Port: 22 or 2200 if you have forwarded port 22 to port 2200.
- Username: licor
- Password: licor
You will see all of the files in the file system. The files of interest are in a data folder.
Viewing logged data
To view raw data, copy raw data files from the SmartFlux System in one of two ways: connect the EC system to your computer or network and download the data using the gas analyzer PC application software, or eject the USB storage device from the SmartFlux System and connect it to your computer to read the data.
In the LI-7x00 File Viewer
The LI-7x00 File Viewer application (fv7x00-v1.x.x-install.exe) is included with the gas analyzer software. If you didn't install with your gas analyzer application software, you can download it at https://licor.app.boxenterprise.net/s/c9pqypt9nhuwcu2oaajmcsudfsnp689m. To view data:

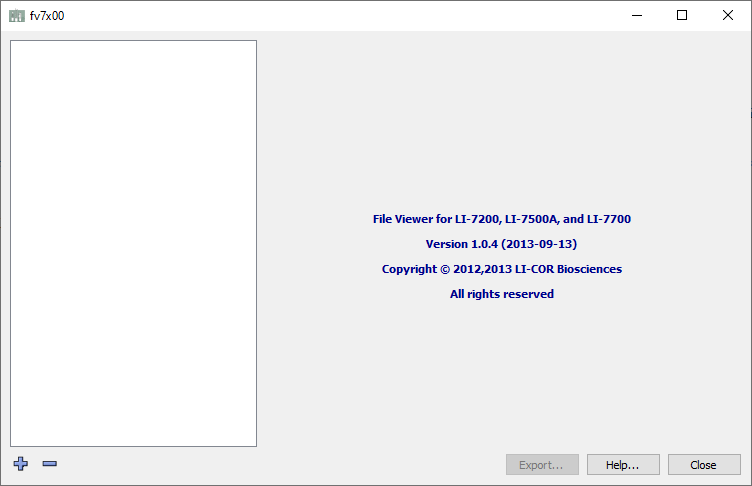
- Launch the LI-7x00 File Viewer application and open the .ghg file.
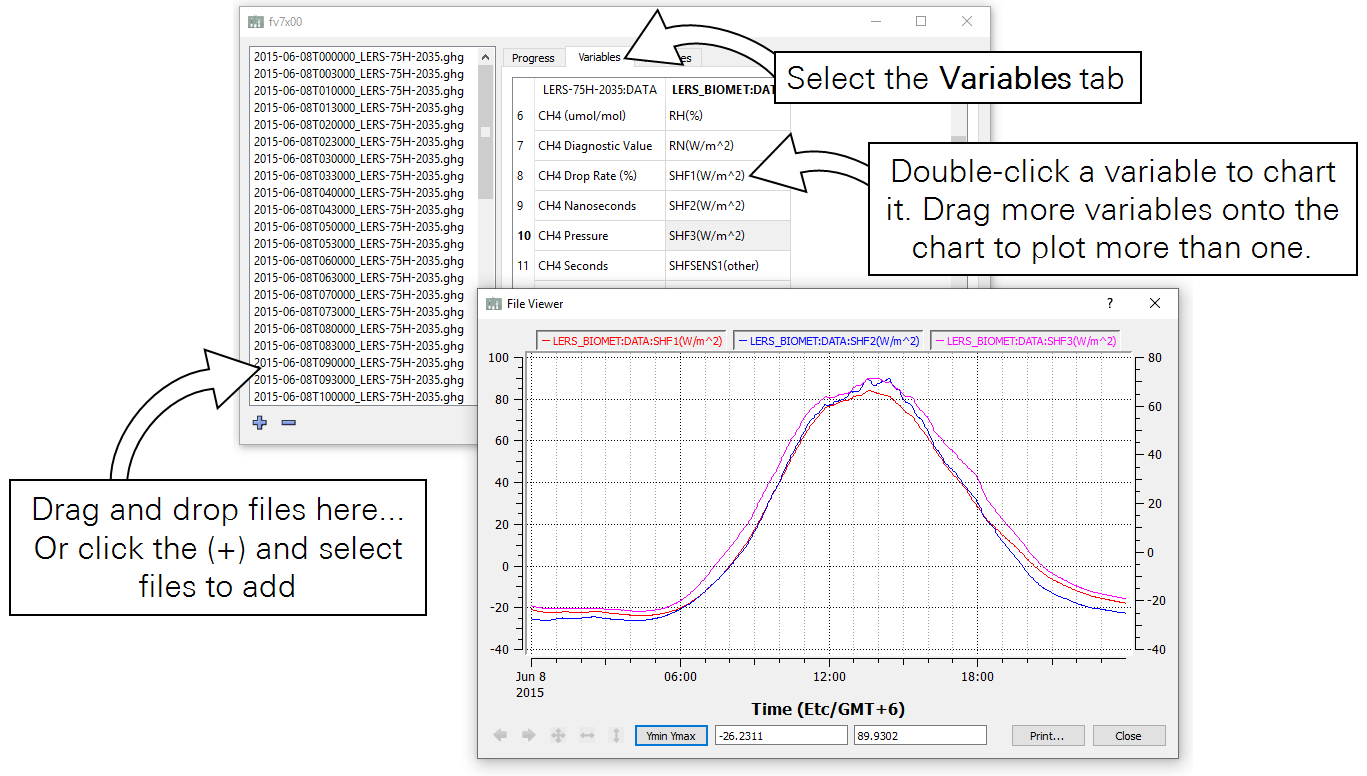
- Files are opened by dragging and dropping into the File Viewer interface or by clicking the plus button (+) and selecting the files. You can load one or many files. They'll be in the order of the time stamps. When a file is open, you'll see a list of variables under the Variables tab on the right.
- View one or more variables.
- Double-click any variable to see a chart of the time-series. Drag any other variable onto the chart to view multiple variables. Use the zoom controls to examine the data in more detail.
The file viewer also provides options to export the dataset, which you can use at your discretion.
In a text editor
If you want to see text data, you open the daily text file of biomet data (logged only on the SmartFlux System USB drive), or your can extract the biomet data files from the compressed eddy covariance data files (.ghg files saved on both the SmartFlux System USB drive and the LI-7550 USB drive, if applicable).
- Copy the file of interest.
- Do not alter the original data. Copy the files before modifying them so that you are not altering the original data. If you alter the original data, EddyPro may be unable to process it.
- Open the file directly in 7zip compression application.
- If you don't use 7zip, change the file extension from .ghg to .zip.
- For example, the file name 2018-05-05T003000_AIU-0288.ghg should be changed to 2018-05-05T003000_AIU-0288.zip.
- Extract the contents of the zipped file.
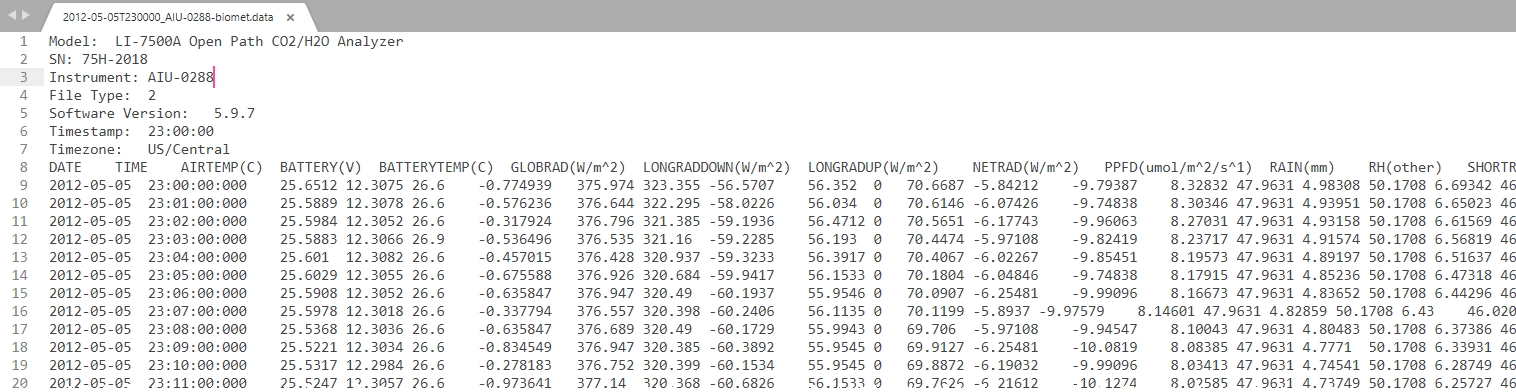
- Biomet data are stored in a file with a name like 2018-05-05T003000_AIU-0288-biomet.data. The file contains a file header, data header, and data. The file header describes the system that collected the data. The data header identifies the variable and units. The data (1-second records) are in tab-delimited columns. A second file, with a name like 2018-05-05T003000_AIU-02880-biomet.metadata, includes information (metadata) about the biomet data. You can open either of these files in a text editor or spreadsheet.
Although you can read the raw data and use it, we don't recommend working with the .ghg files outside of EddyPro Software. EddyPro will summarize and average the biomet data.
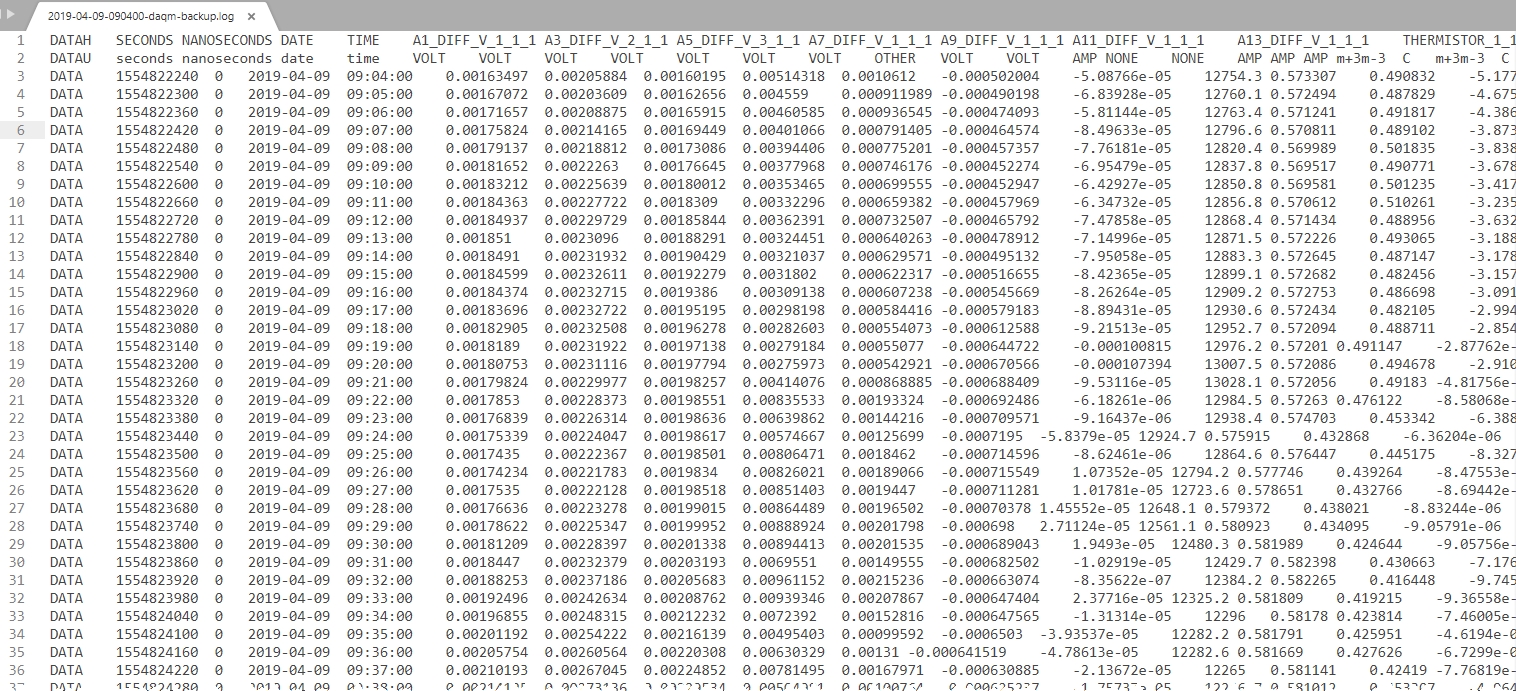
Biomet data logged while on backup battery
For systems equipped with a DRM and backup battery, when the system switches to backup battery power, biomet data will be logged in a seperate text file while the gas analyzer, SmartFlux System, sonic anemometer, and accessories are powered off. These files are temporarily stored on the DRM and copied to the SmartFlux System USB drive when power is restored. This file will have the same time stamp as a typical biomet data file, representing the year, month, day, and time, but be appended with the word backup. It will be compressed into a .zip file. The format is similar to a biomet data file, but with a few minor changes.
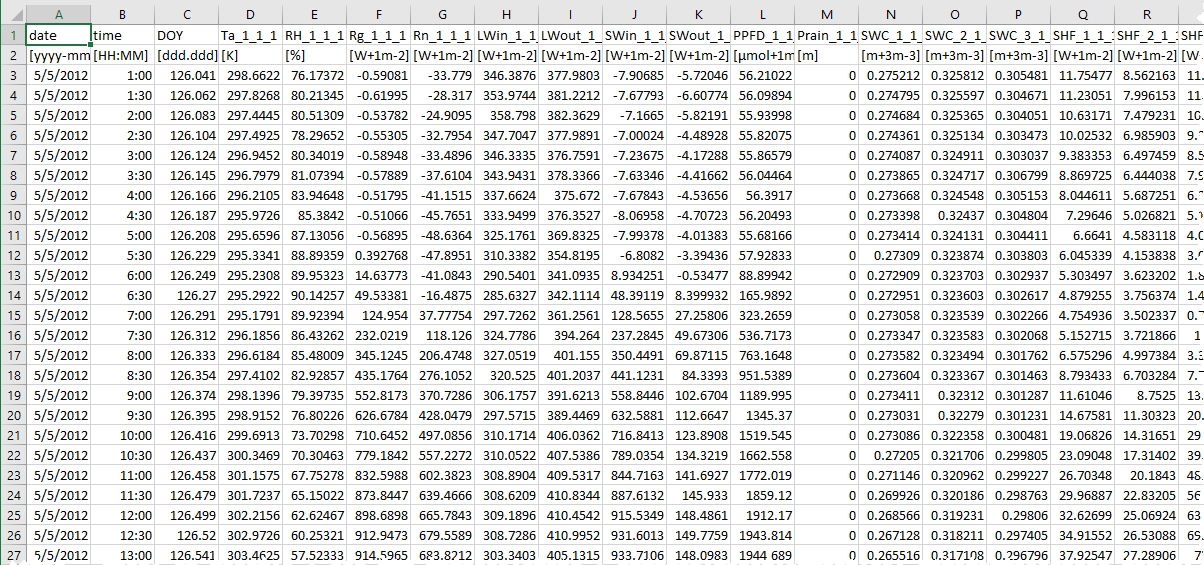
Viewing processed data from the EddyPro output
Logged biomet data are processed by EddyPro, and in a typical eddy covariance system, these data will be recorded as 30 minute averages with flux data. The EddyPro output files include a file called something like eddypro_Demo_biomet_2018-05-05T143614_adv.csv. Data are stored as comma separated values (.csv) in a text file that can be opened in a spreadsheet or text editor. The header displays the variable label and position code (see The relationship between variable label and sensor position), as well as the variable units.
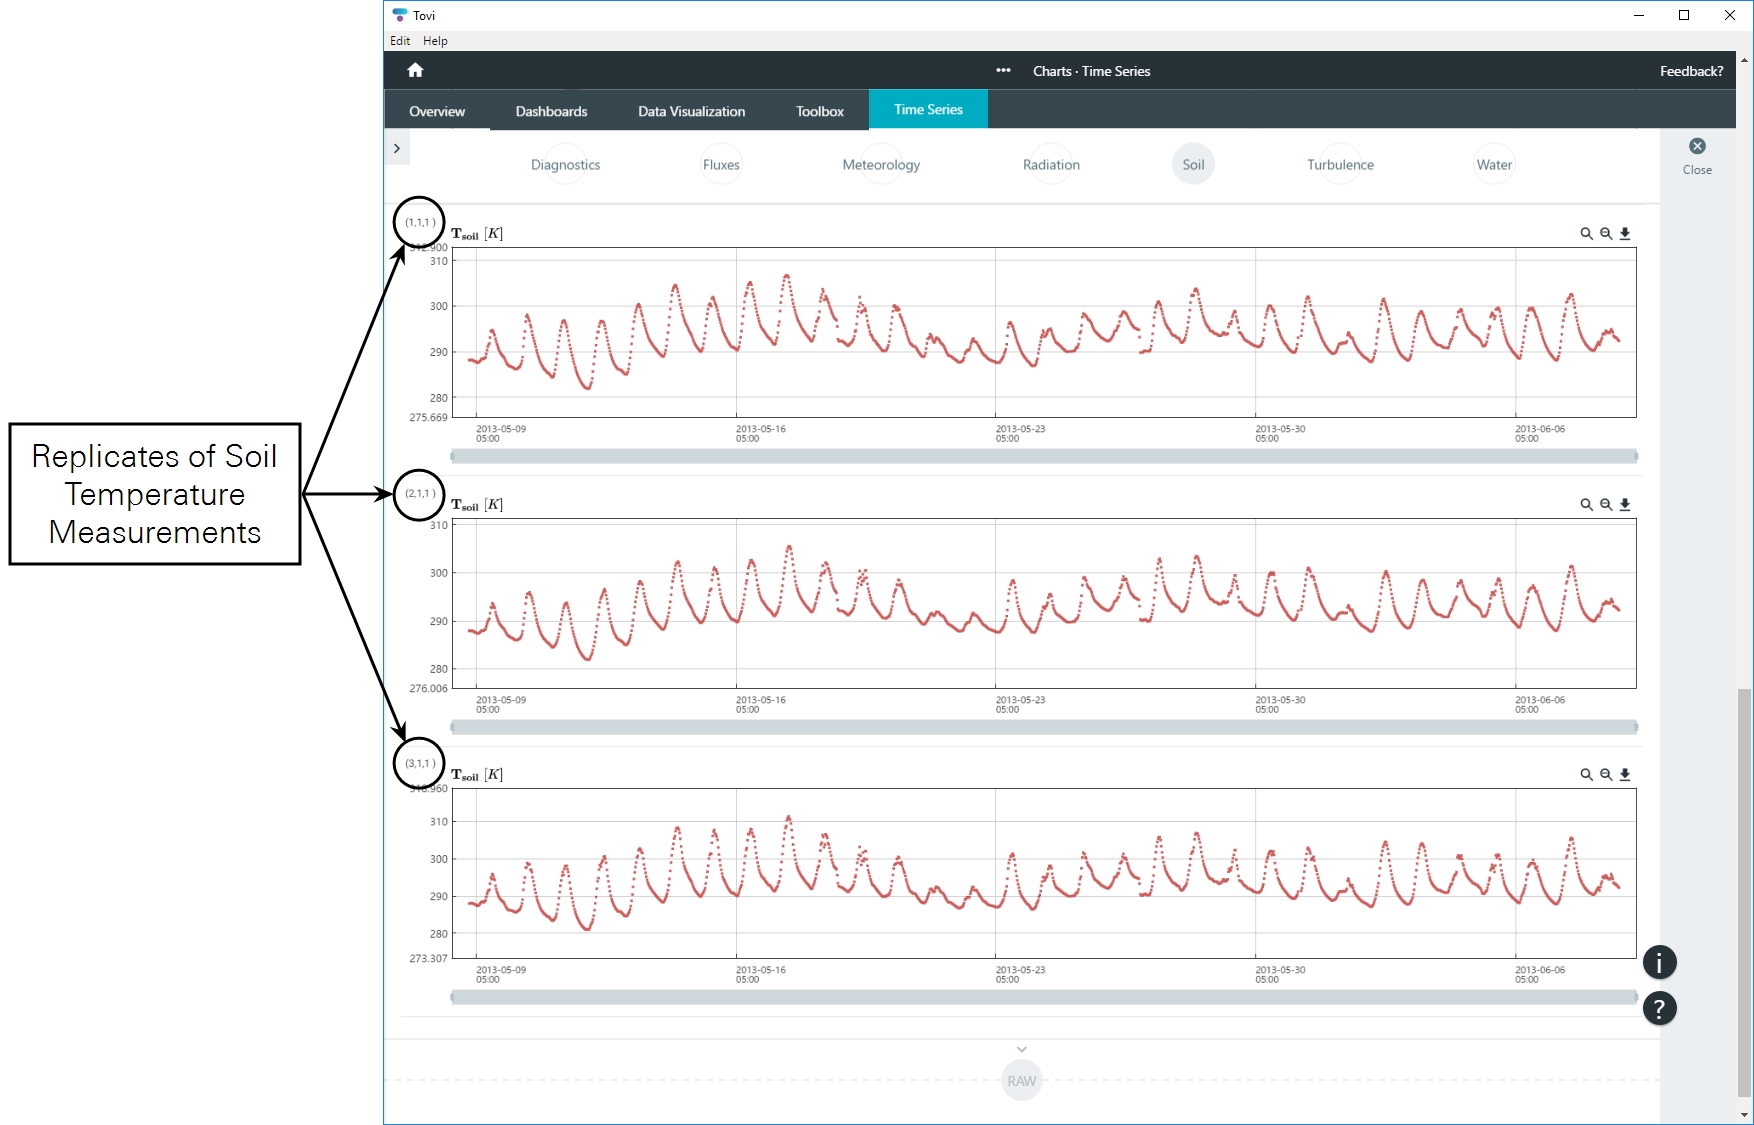
Evaluating long-term data in Tovi® Software
Tovi Software provides tools to evaluate and process the fluxes and biomet data that have been processed by EddyPro. For example, you can average redundant measurements, merge variables and gap fill with data from your site, gap fill with data from nearby weather stations, evaluate the quality of data, and use the biomet data to interpret flux results. Tovi is designed to evaluate lengthy time-series eddy covariance data sets.