Using CSAT3/B Sonic Anemometers in LI-COR Eddy Covariance Systems
Printable PDF: Using CSAT3/B Sonic Anemometers in LI-COR Eddy Covariance Systems
(EC_InstallGuide_CSAT3-B-17989)
Download this content as a pdf that can be saved to your computer or printed.
This document describes how to use the Campbell Scientific® CSAT3 and CSAT3B sonic anemometers in LI-COR eddy covariance systems. The topics covered are installing the anemometer at your site, connecting the anemometer to the SmartFlux 2 or 3 System, and configuring the software for the eddy covariance site.
Important: Be sure to read and understand the documentation provided with the sonic anemometer.
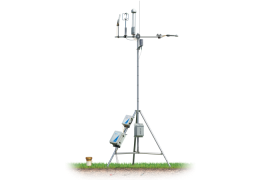
Installing the anemometer and analyzer
The CSAT3 and CSAT3 should be mounted to a horizontal cross-arm as described in the anemometer instruction manual.
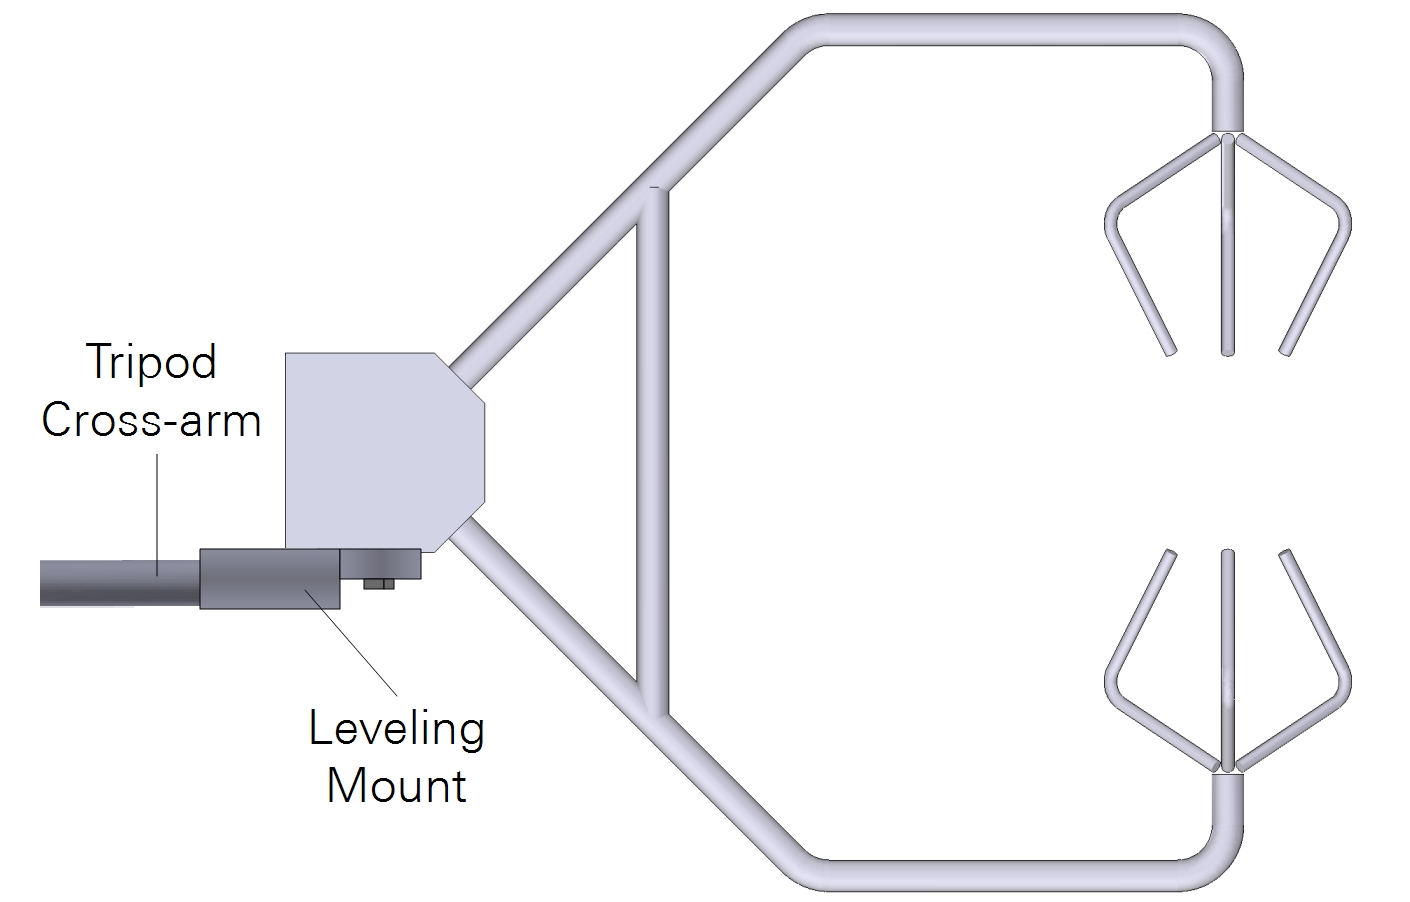
Orientation, horizontal offsets, and vertical offset
Mount the anemometer so it is facing magnetic north, then rotate the cross-arm so that the anemometer is oriented into the prevailing wind direction. Measure and record the north offset and height.
- North offset (°): The degrees of rotation from magnetic north.
- Height (m): The distance between the ground and the center of the anemometer sample volume.
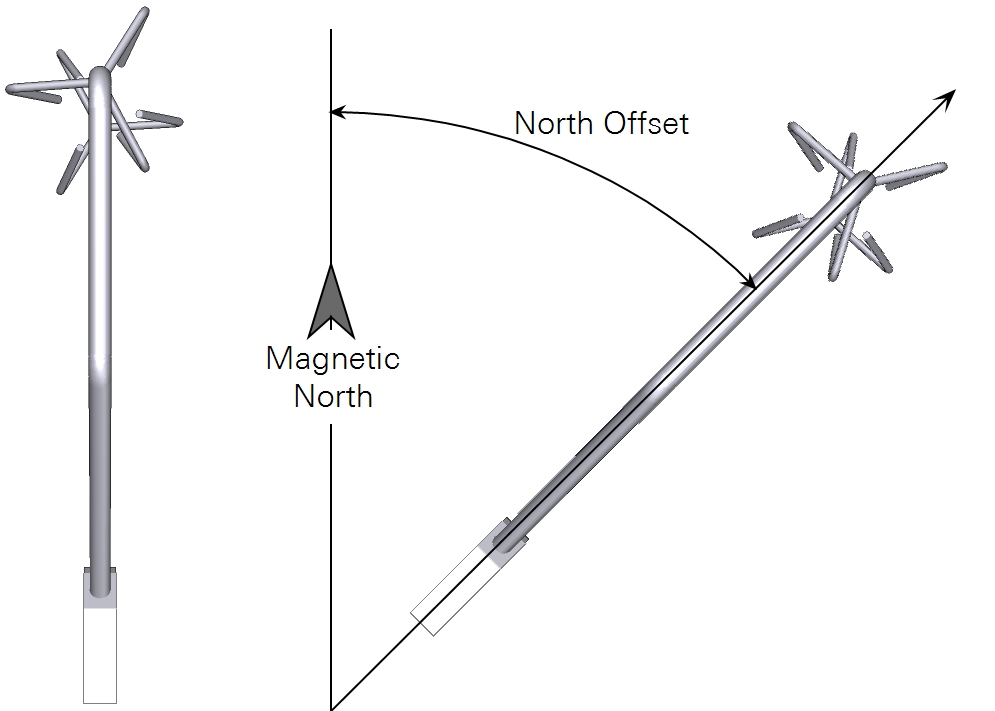
Horizontal separation distances (Figure 1‑3) are measured in a Cartesian coordinate system, which EddyPro® uses to determine the distance between the gas sample and the anemometer. The center of the anemometer is the center (0, 0) of the coordinate system. Distances from the anemometer are provided along the north-south and east-west axes. The sensor head or air inlet should be 10-20 cm from the anemometer in the horizontal plane.
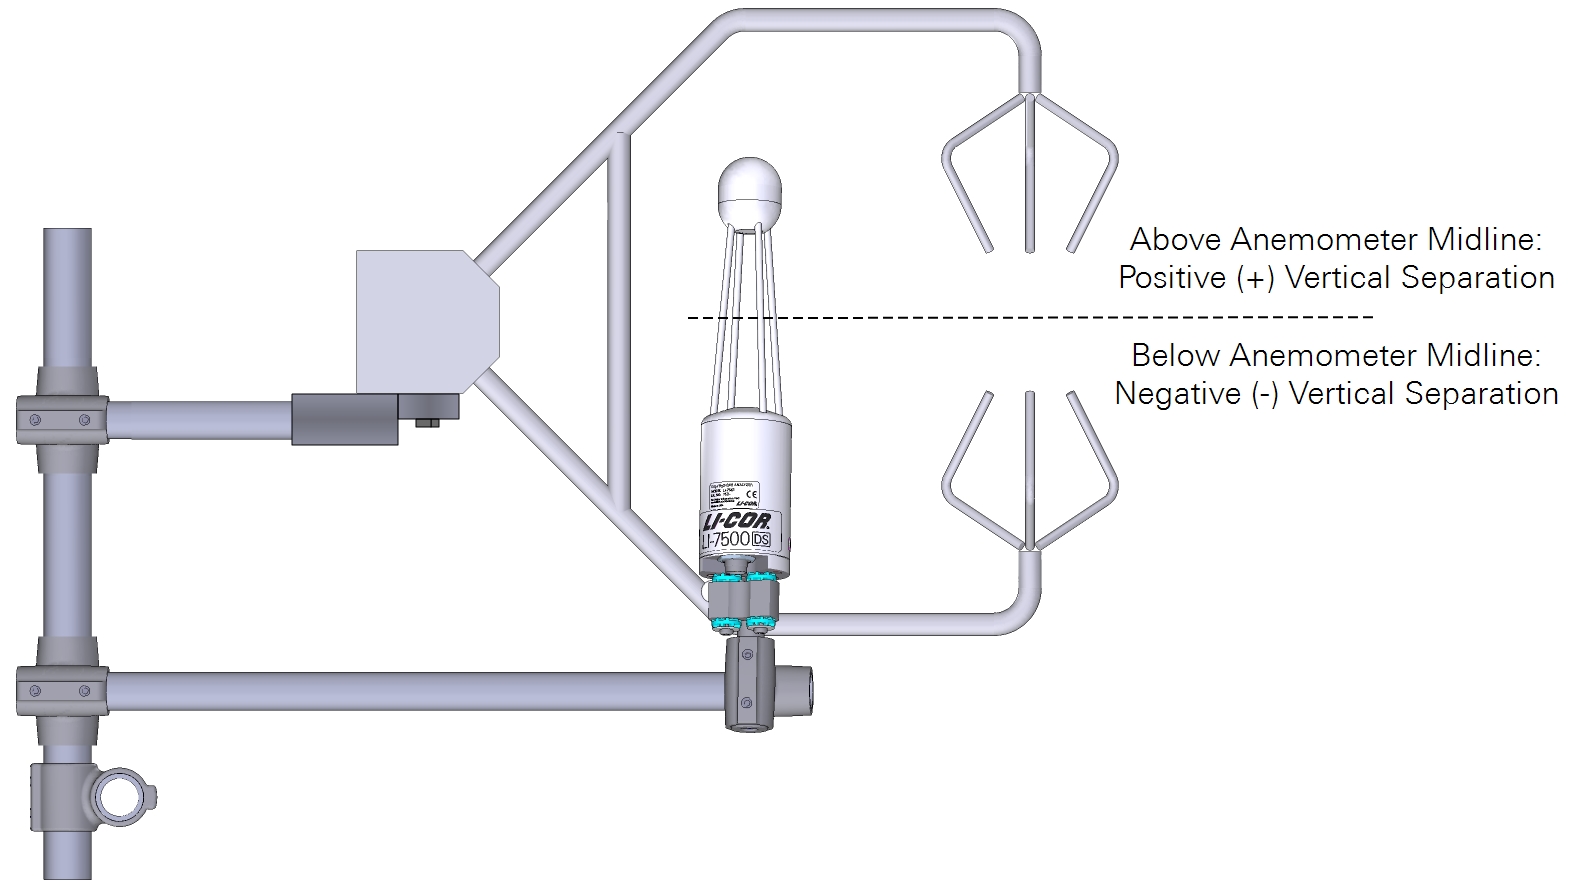
For deployments that are close to a plant canopy, the center of the analyzer and sonic anemometer should be at equal heights, as shown in Figure 1‑4. If mounted over 15 m above ground level, horizontal and vertical sensor separation can be as large as 30-50 cm. Measure and record the horizontal and vertical separation distances.
- Northward Separation (cm): North (positive values) or south (negative values) distance between the sample path or intake and the anemometer.
- Eastward Separation (cm): East (positive values) or west (negative values) distance between the sample path or intake and the reference anemometer.
- Vertical Separation (cm): Vertical distance between the sample path or inlet and the reference anemometer. Negative if the center of the analyzer or the inlet is below the center of the reference anemometer sample volume; positive if the inlet is above.
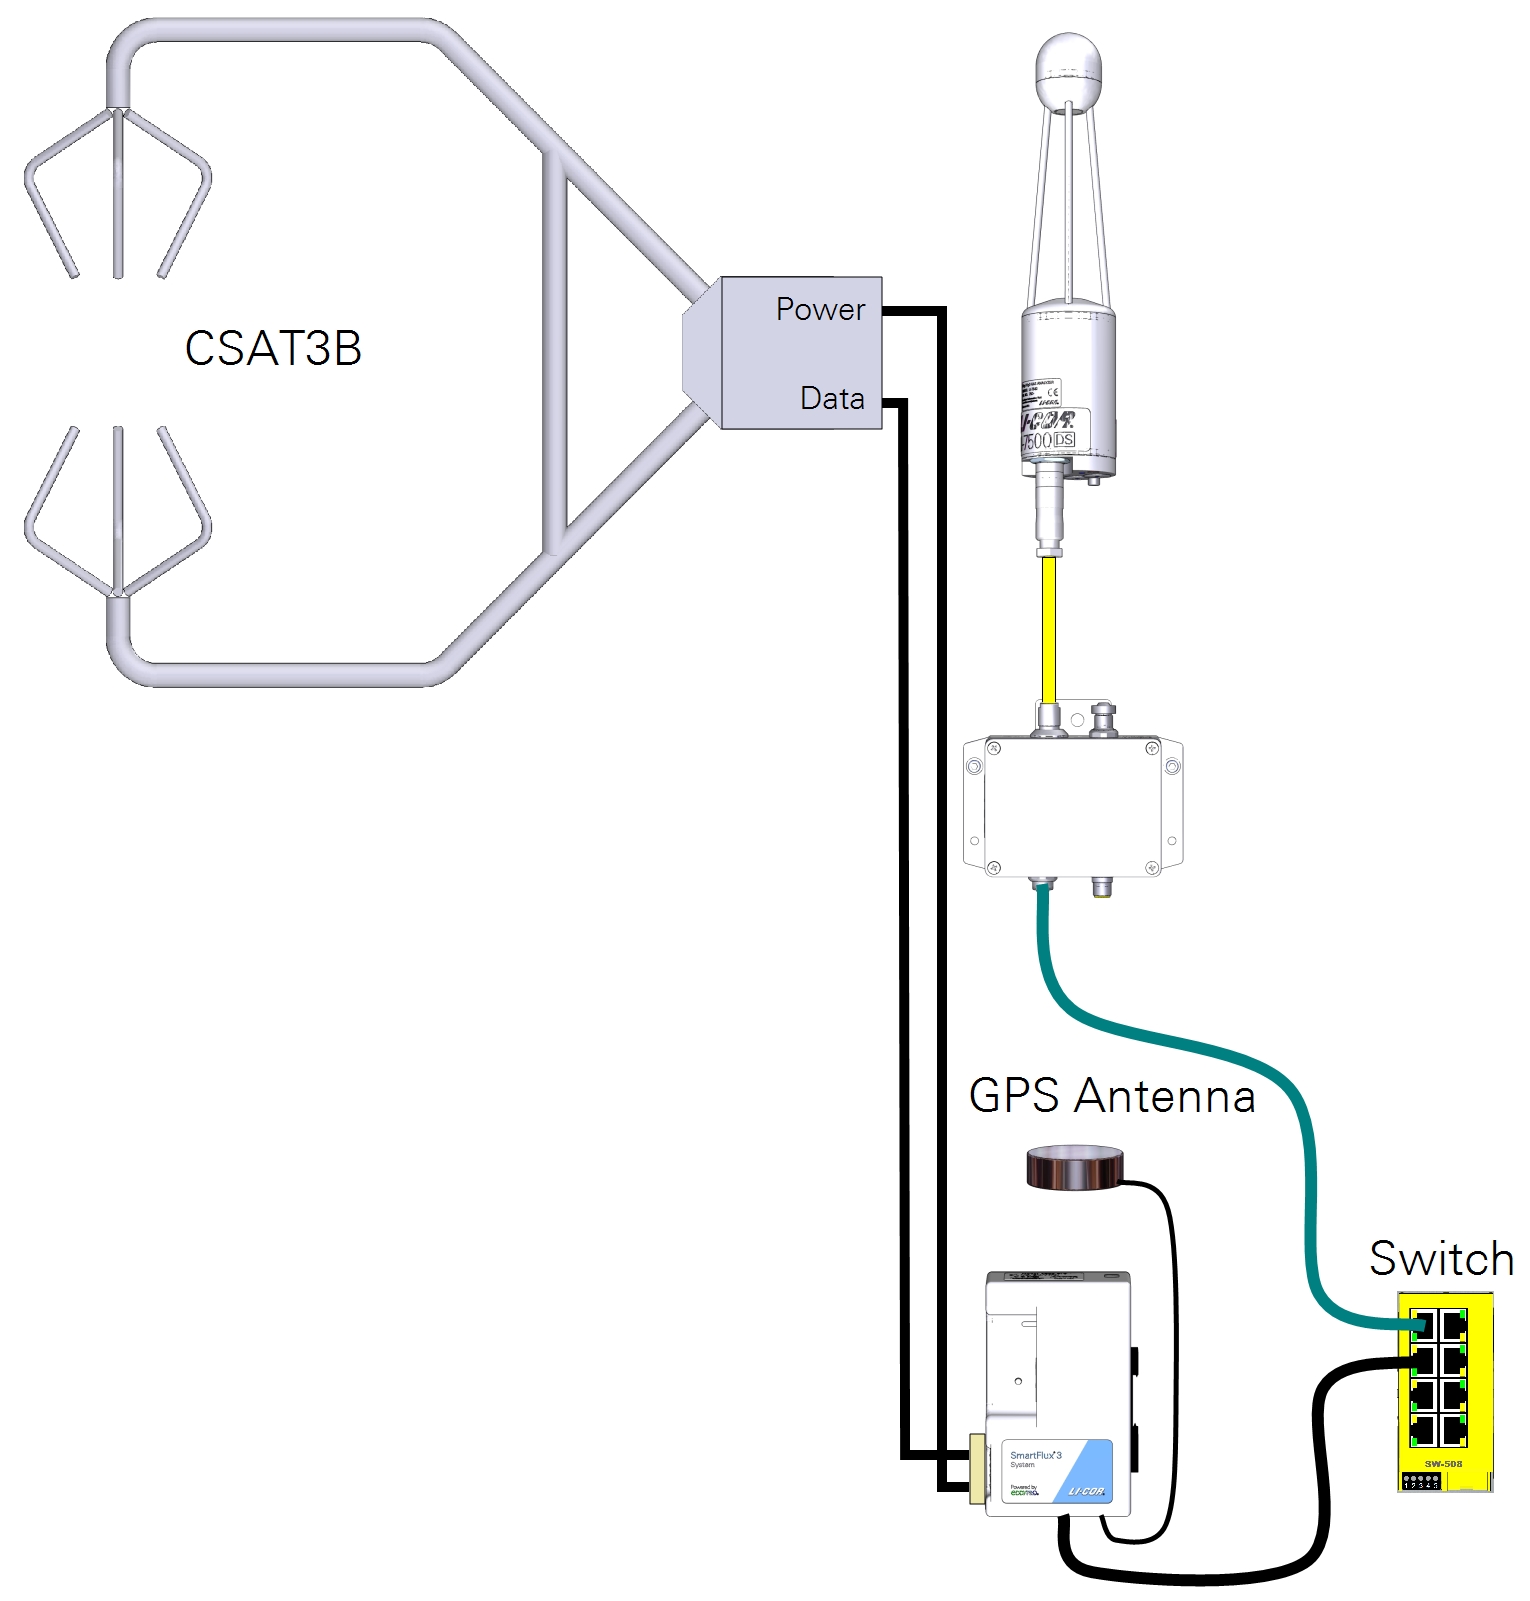
Connecting to the SmartFlux 2 or 3 System
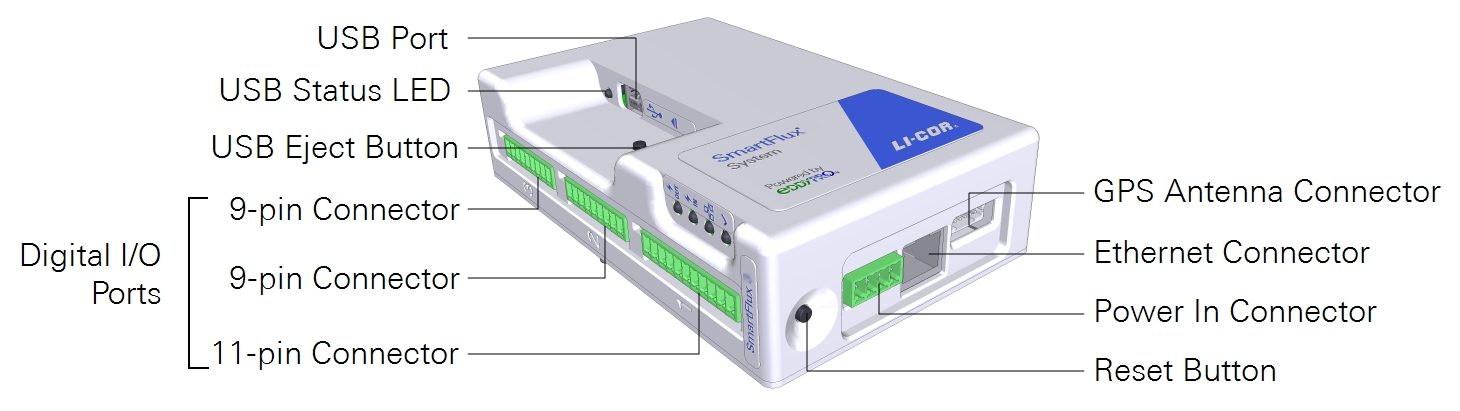
The CSAT3 connects to the 11-pin connector (port 1) on the SmartFlux System. The CSAT3B can connect to any of the three 9-pin and 11-pin connectors (port 1 shown).
Important: Disconnect the power supply to the SmartFlux System before connecting anemometer cables.
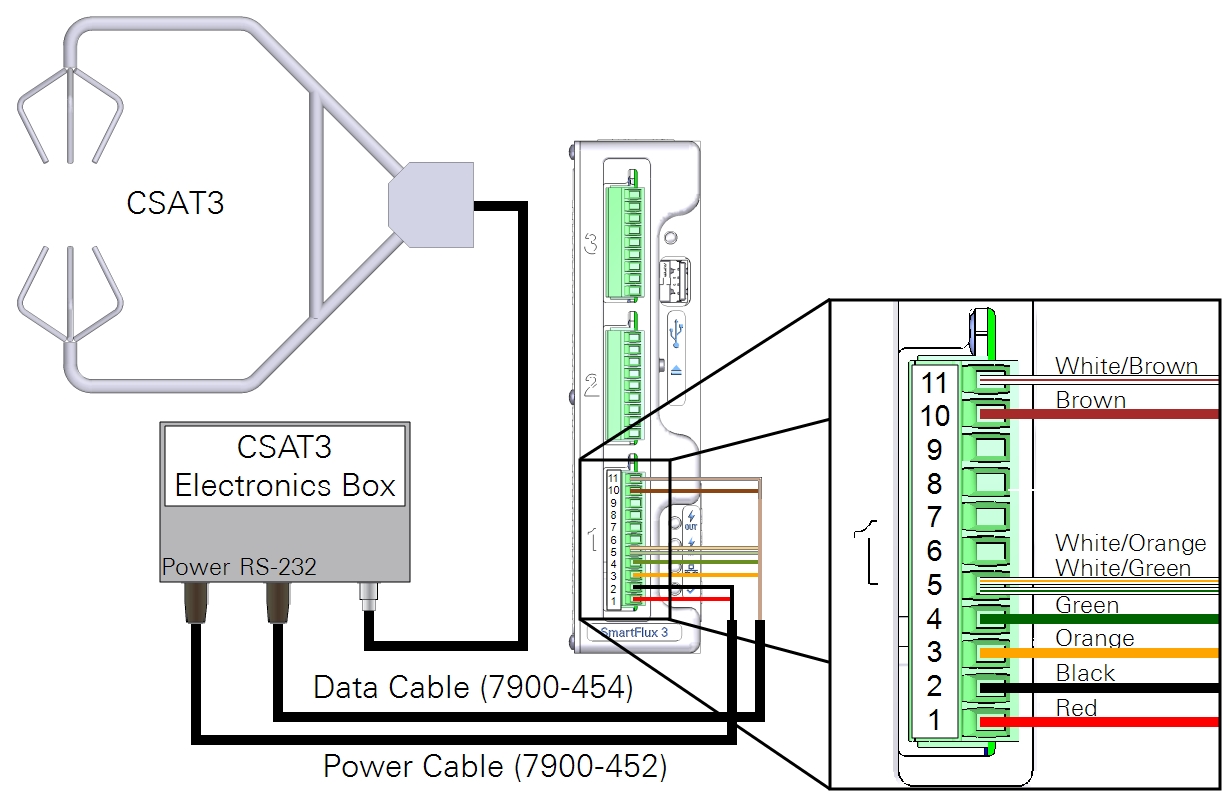
Connecting the CSAT3
The CSAT3 is configured automatically when they are connected to the SmartFlux System. Additional settings can be configured using the Device Configuration Utility from Campbell Scientific®.
| SmartFlux Terminal # | SmartFlux Label | Wire Color |
|---|---|---|
| 11 | CTS | White/Brown |
| 10 | RTS | Brown |
| 5 | Signal Return | White/Orange and White/Green |
| 4 | RS-232 RX | Green |
| 3 | RS-232 TX | Orange |
| 2 | Power Out (-) | Black |
| 1 | Power Out (+) | Red |
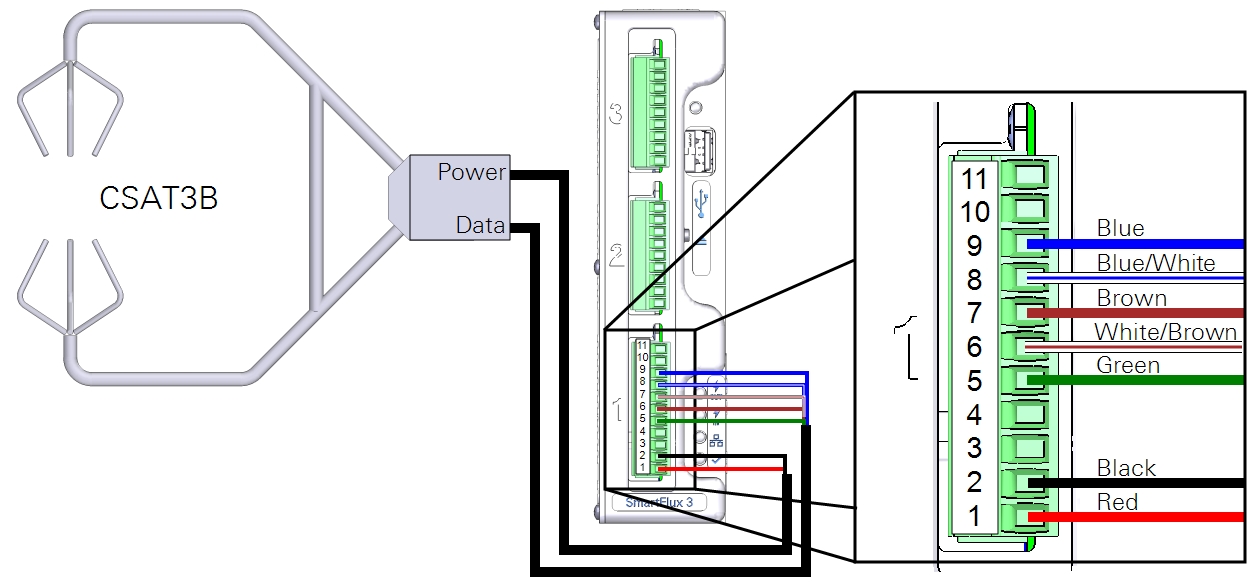
Connecting the CSAT3B
The CSAT3B anemometer must be configured before it will work with the SmartFlux System. Using the Campbell Scientific Device Configuration Utility, apply the following settings:
| Parameter Name | Correct Setting |
|---|---|
| Communication Protocol | RS-485 Enabled |
| RS-485 Baud Rate | 115200 |
| Unprompted Output Port | RS-485 Port |
| Unprompted Output Rate | 50 Hz |
| Operating Mode | Unprompted Output - No Filters |
| SmartFlux Terminal # | SmartFlux Label | Wire Color |
|---|---|---|
| 9 | RS-422/485 RX- | Blue |
| 8 | RS-422/485 RX+ | Blue/White |
| 7 | RS-422/485 TX- | Brown |
| 6 | RS-422/485 TX+ | White/Brown |
| 5 | Signal Return | Green |
| 2 | Power Out (-) | Black |
| 1 | Power Out (+) | Red |
Configuring the eddy covariance system
Several things need to be configured in software before your system will log valid eddy covariance data sets. These are described below.
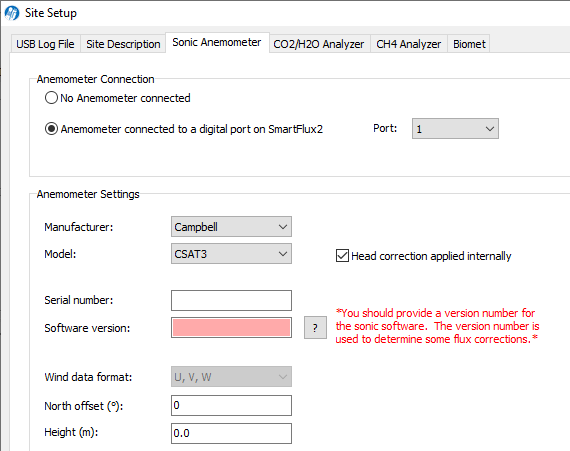
Enter sonic anemometer information
In the gas analyzer PC software, click Site Setup > Sonic Anemometer tab, and select Anemometer connected to a digital port on the SmartFlux 2 or 3 System.
- Port: The port on the SmartFlux System that the anemometer is connected to (1 in this example).
- Manufacturer: Campbell.
- Model: CSAT3 or CSAT3B.
- Check or clear Head correction applied internally.
- Serial Number: Optional, the anemometer serial number.
- Software Version: Optional, the anemometer software version.
- Wind Data Format: Preset as U, V, W.
- North Offset: Degrees clockwise of magnetic North. Measured at the site (see Figure 1‑2).
- Height: Distance of the anemometer sample volume above the ground. Measured at the site.
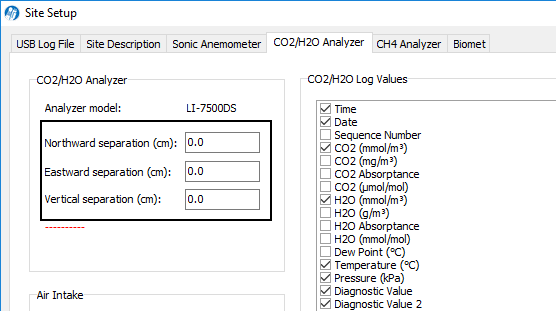
Enter gas analyzer information
The following information is required:
- Northward Separation (cm): Measured at site (Figure 1‑3).
- Eastward Separation (cm): Measured at site (Figure 1‑3).
- Vertical Separation (cm): Measured at site (Figure 1‑4).
Additional system settings
Although not related to the sonic anemometer, configure the following settings to finish configuring the eddy covariance system. Under Site Setup > USB Log File > USB Log File Options, set the following:
- Log Rate (Samples per Second): 10.0 (or higher).
- File Duration: 30 minutes.
Under Site Setup > Site Description, set the following:
- Site Name: A name of your choice.
- Station Name: A name of your choice.
- Canopy Height (m): The distance between ground level and the top of the plant canopy.
- Check Use SmartFlux GPS coordinates.
At this point, you've configured the minimum required settings to log complete eddy covariance data sets with an LI-7500A/RS/DS. There are additional settings to configure if you are using an LI-7200/RS, a biomet system, or an LI-7700, or if you want to process data using EddyPro Advanced settings. These are described in corresponding product documentation.