Note: This feature is available to General Users, Station Administrators, and User Administrators.
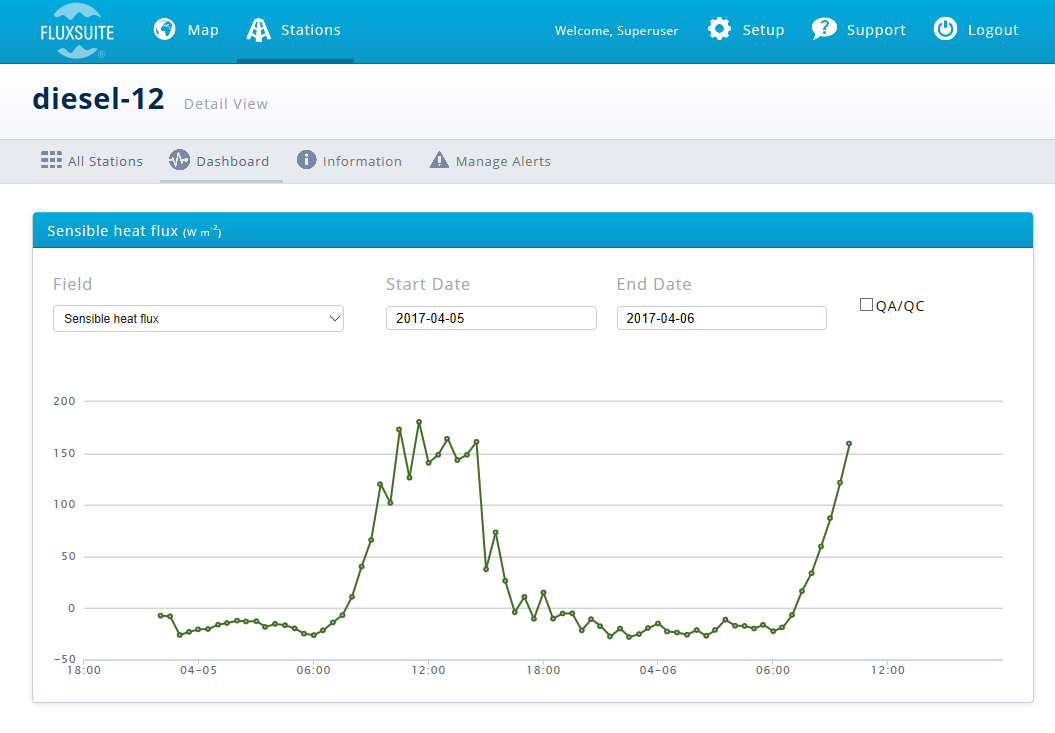
To view data for a site, select the site from the Map or Stations view. This will bring up the station dashboard.
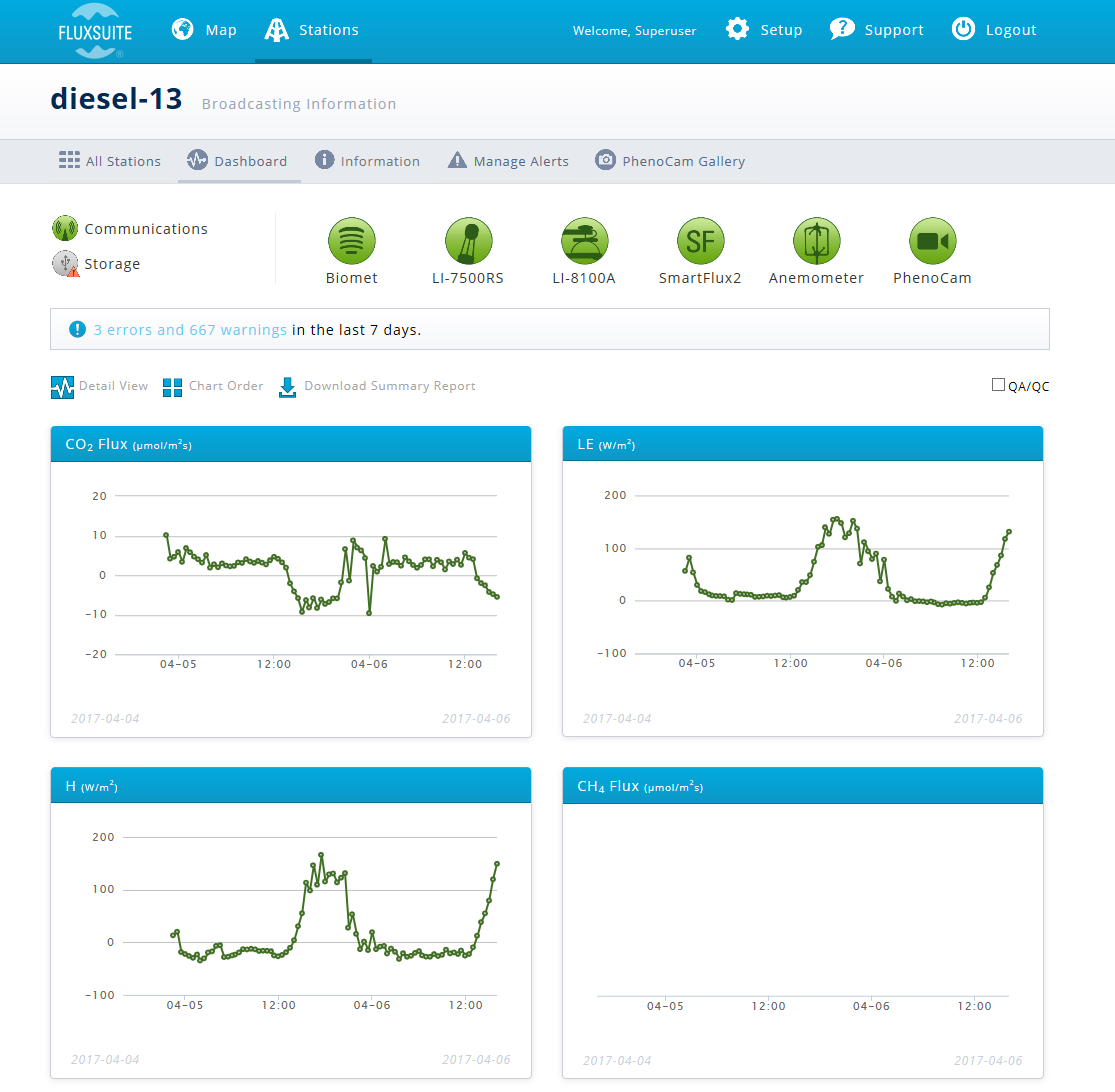
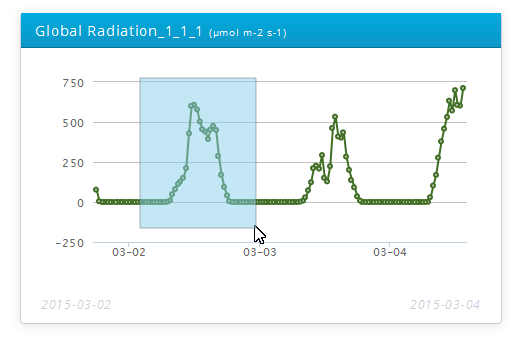
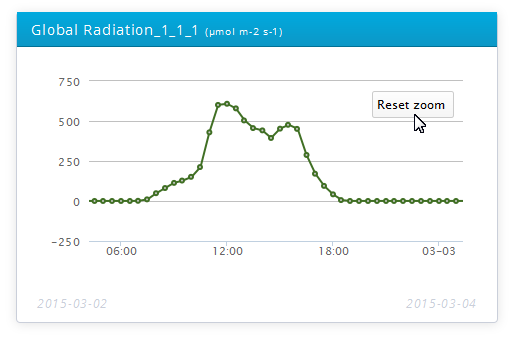
Note: Click and drag to zoom in on a graph.
Click the Detail view to the upper right of the graphs.
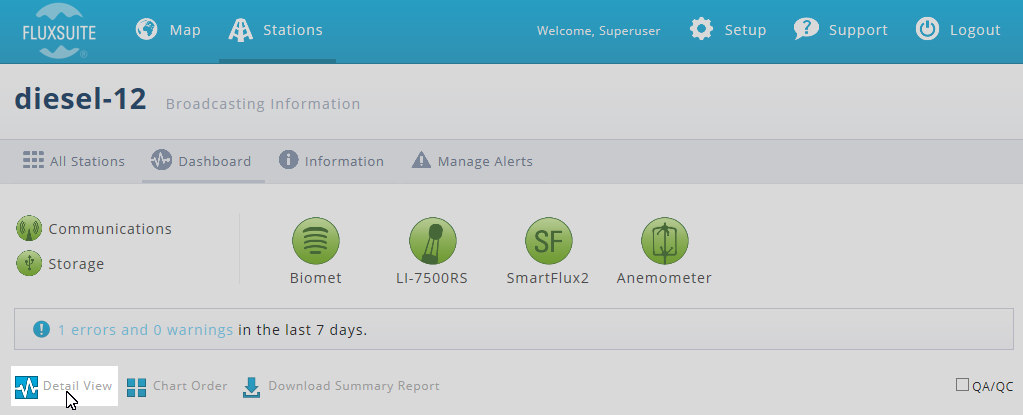
Current data will be displayed:
Field
You can select variables from the Field menu:
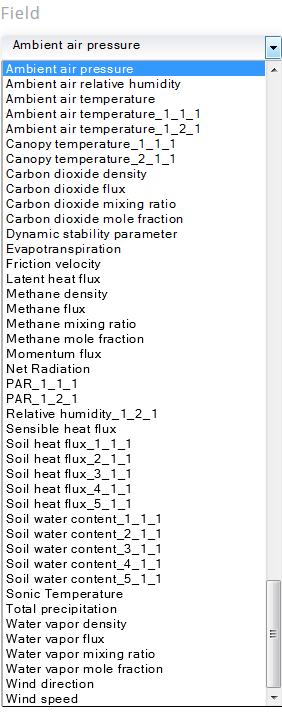
| Field |
|---|
| Ambient air pressure |
| Ambient air temperature1 |
| Canopy temperature1 |
| Carbon dioxide density |
| Carbon dioxide flux |
| Carbon dioxide mixing ratio |
| Carbon dioxide mole fraction |
| Dynamic stability parameter |
| Evapotranspiration |
| Friction velocity |
| Latent heat flux |
| Methane density |
| Methane flux |
| Methane mixing ratio |
| Methane mole fraction |
| Momentum flux |
| Net radiation |
| PAR1 |
| Relative humidity1 |
| Sensible heat flux |
| Soil heat flux1 |
| Soil water content1 |
| Sonic temperature |
| Total precipitation |
| Water vapor density |
| Water vapor flux |
| Water vapor mixing ratio |
| Water vapor mole fraction |
| Wind direction |
| Wind speed |
Start/End Dates
You can specify a date range with the Start/End Dates.
The Quality Assurance/Quality Control check box ( ) converts the graphs to display the quality flag of each record when checked. When viewing QC/QA mode, you can turn on or off the QC levels by clicking the record.
 indicates OK status.
 indicates note. You should consider checking these data for problems.
 indicates a warning. These data should reviewed and discarded if they are problematic.
1 _#_#_# nomenclature indicates that more than one sensor is providing this measurement. See Biomet Data in EddyPro documentation for more information.