Authors: LI-COR, Inc.
Correspondence: envsupport@licor.com
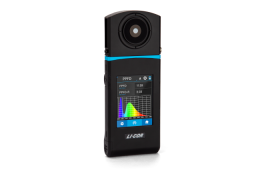
Instruments: LI-180
Keywords: DLI, daily light integral
This tutorial assumes you have read the LI-180 Spectrometer User Guide manual and FAQ and have basic familiarity with the instrument.
Note: You will need to have the LI-180 connected to an AC power supply when collecting data over extended periods of time. You can also follow this tech tip for instructions on extending the power supply in the absence of an AC power source. Leave the power of the spectrometer on and do not exit the logging mode during measurements.
The LI-180 Spectrometer is useful because it can measure light beyond the 400 - 700 nm Photosynthetically Active Radiation (PAR), also known as photosynthetic photon flux density (PPFD). The range for the LI-180 is from 380 - 780 nm. While the PAR is important for photosynthesis, studies have shown that light in the far-red region between 700 - 750 nm can be used by plants to produce carbohydrates more efficiently. One application of the LI-180 can be to ensure that plants in a greenhouse setting are getting the best lighting conditions including far red light for optimal growth and yield. Automated logging with the LI-180 can be useful is such settings.
Setting the LI-180 logging mode
- Turn on the LI-180 and do the dark calibration.
- Make sure the date and time are set correctly.
- Instructions for this can be found on the LI-180 Spectrometer User Guide. If the date and time are incorrect, it will affect whether your data is logged within your desired time range.
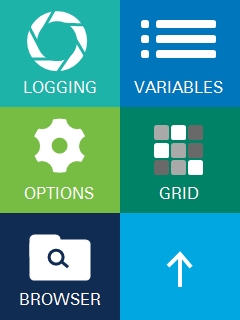
- On the first page of the main menu, press the down arrow to the lower right of the screen to go to the second page.
- On the second page, select LOGGING.
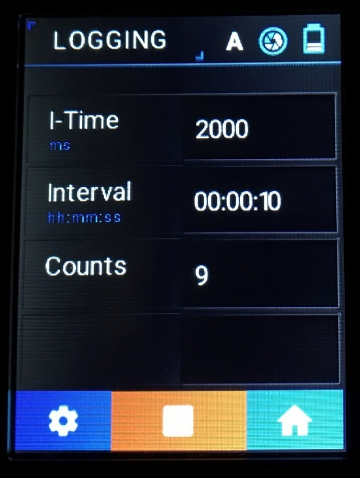
In the logging page, you will see three options at the bottom of the screen: a gear button (for Settings), a Capture button, and a Home button.
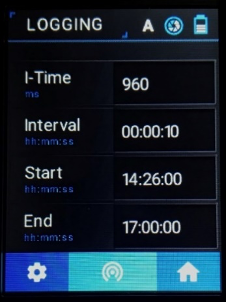
The Capture (measure) button can be used to start measurements. The Home button will return you to the main menu.
Summary of settings
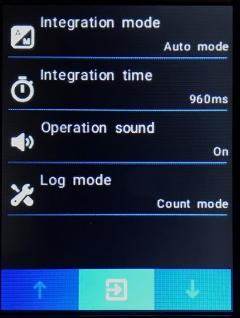
In settings, you can adjust the operation sound, the log mode to either Count mode or Time mode, and the integration mode and integration time.
When the log mode is set to time mode, you can set up a measurement interval and time range for which you want the data to be logged. For example, you can set the time range to start at 6:00:00 and end at 18:00:00 with a logging interval of 15 minutes. In this configuration, the spectrometer will log data every 15 minutes between 6:00:00 and 18:00:00, with the first data logged 15 minutes after the start time (in this example, 15 minutes after 6:00:00). The minimum measurement interval allowed is 10 seconds and the maximum interval is 24 hours.
When the log mode is in count mode, you can set up a measurement interval and the number of data points you want to log. For example, you can set your measurement interval to 15 minutes and the count to 4. In this configuration, the spectrometer will log data every 15 minutes for up to 4 data points. The minimum count possible is 1, and the maximum count possible you can set as a number is 9999.
- You can choose whether the operation sound is On or Off.
- When the operation sound is On, the spectrometer will beep every time a data point is logged.
- You will also see options for Integration mode and integration time.
- Integration mode can be Auto or Manual. Integration time can only be changed if integration mode is set to Manual mode.
- To navigate out of settings, tap the arrow icon pointing to the right in the bottom-center of the screen.
Set up a logging configuration and start logging
- If you are in time mode, set the time range for which you want the data to be logged.
- Set your measurement interval, which will determine how often the data is logged.
- If you are in count mode, set the measurement interval and the number of counts (data points) you want logged.
- At this point, you are ready to take measurements.
- You can start logging to the file by pressing the capture button at the bottom center of the screen or the measurement key on the left-hand side of the spectrometer.
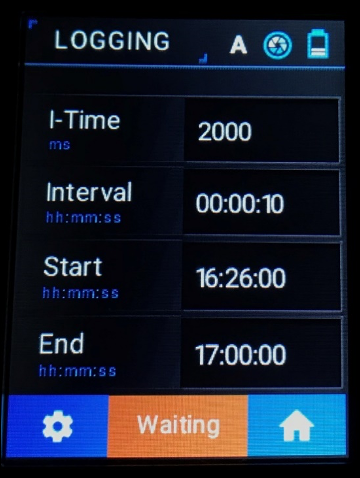
- When the spectrometer is in measurement mode, the capture button at the bottom center of the screen will turn orange with a white square in the center.
- You can click on this button at any desired point to stop the measurements.
Note: If you start the measurement earlier than the configured start time, the spectrometer will display WAITING until the start time is reached.
While the LI-180 is logging measurements, do not exit the screen from the logging configuration, as this will stop the measurements. Be sure that the LI-180 is connected to a power supply.
Note about continuous logging for a full 24 hours:
24-hour continuous logging is possible with the LI-180. For example, you can set the start time to be 16:20:00, the end time to be 16:19:59, and the logging interval to be 15 minutes. Start logging by clicking on the capture button. In this 24-hour time setting, the spectrometer will not wait until 16:20:00 to start logging data if you click the capture icon start the measurement before 16:20:00. Instead, the LI-180 will start the measurement at the moment you click the capture button, so that the first logged data will be 15 minutes from when you clicked the capture button. Additionally, the icon in the bottom center will turn orange and display WAITING even though the spectrometer is logging data. For example, for the above given time range, if you start the measurement at 16:00:00 while the start time is set at 16:20:00, the LI-180 will display WAITING but will log the first data at 16:15:00. The spectrometer will not wait until 16:20:00 to start measurements and the first data logged will not be at 16:35:00.
Access data files and download data
You can download the logged data from the LI-180 to your computer as text files.
- If the LI-180 was off, turn it on and do the dark calibration.
- To download data files, the LI-180 USB mode must be set to Mass Storage and not PC Connection.
- To do so, from the second page of the main menu, select Options > USB Mode and select the box by Mass storage. Tap Yes to save your settings.
- Connect the LI-180 to your computer using the provided USB cable.
- Once connected to the computer, the LI-180 will act like a USB flash drive.
- You can find your data in the LOG folder (which will appear as USB Drive in your computer).
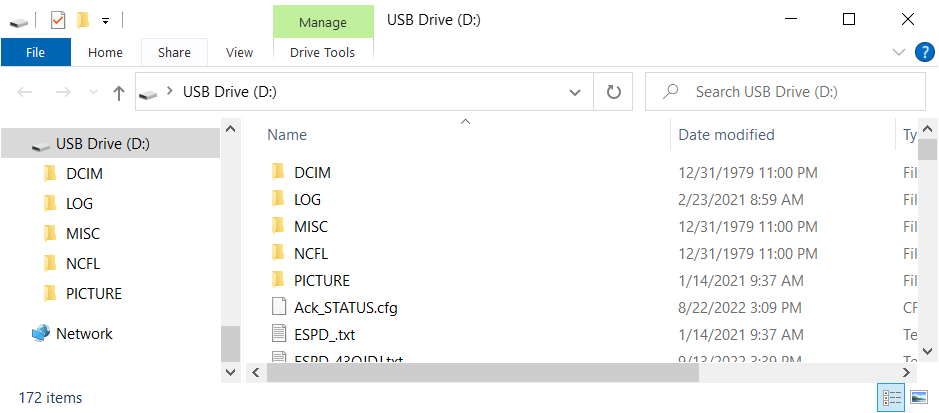
- Data that has been logged automatically will be in the LOG folder as a text file starting with LOG and the date/time it was opened.
- You can drag and drop or copy files from the LI-180 to your computer.
Computing daily light integral from the LI-180 readings
With the logged data, you can calculate the daily light integral (DLI).
DLI is a measure of the total amount of light received in a single day in a particular area. It is calculated as the time integral of a series of instantaneous photosynthetic photon flux density (PPFD) readings (Q') taken at regular intervals (Δti) (the area under the curve). If the instantaneous measurements are taken at regular intervals, Δti is the same for all terms in the summation. The instantaneous readings are given in (µmol m-2 s-1 ). After the calculation, DLI is given in units of (mol m-2 d-1 ).
Using data logged by the LI-180, you can compute the DLI of light from 380 - 780 nm at the single nanometer level, within five default ranges of wavelengths, and any custom range you define ahead of logging the measurements.
- Transfer the logged data from the LI-180 to Microsoft Excel.
- The LI-180 will log data in the following ranges:
- PPFD (400~700 nm),
- PFD (380~780 nm),
- PFD-UV (380~400 nm),
- PFD-B (400~500 nm),
- PFD-G (500~600 nm),
- PFD-R (600~700 nm),
- PFD-FR (700~780 nm),
- Custom ranges that you define,
- Single-nanometer readings from 380 - 780 nm.
- Depending on the application or research question, DLI can be calculated for the given ranges, at the single nanometer level or at user-set custom ranges.
- Use the formula for the area of a trapezoid to calculate the area under the curve.
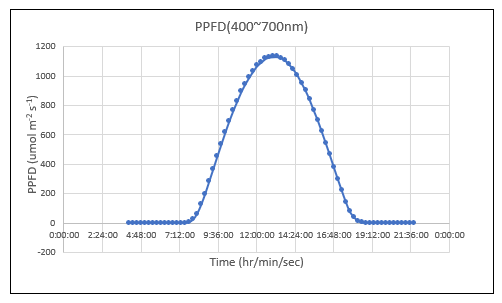
- The formula for the area of a trapezoid is ((b1 + b2) / 2) * h where is h is the time in seconds and b1 and b2 are the top and bottom bases (parallel sides) of the trapezoid. In this calculation, b1 and b2 are the first and last measurement readings within the logging interval you set in your configuration (for example, 15 minutes). Figure 1 is an example calculation for DLI using PPFD data from LI-180.
Example calculation
Use ((b1 + b2) / 2) × h to find the area of each individual ‘trapezoidal’ unit.
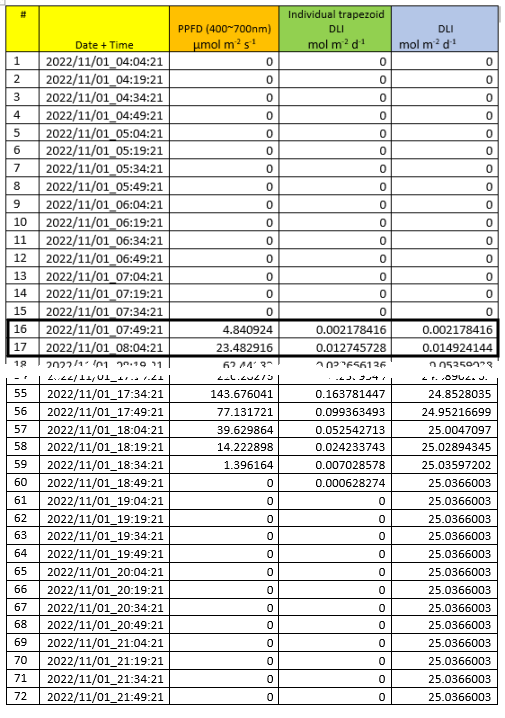
For example, for the time range from 7:49:21 to 08:04:21 in Figure 2, the area for points 16 and 17 is calculated in the following way:
- Point 16: ((((0 + 4.840924) / 2) × 900 seconds) / 106) = 0.002178416 mol m-2 d-1
- Point 17: ((((4.840924 + 23.482916)/2) × 900 seconds) / 106) = 0.012745728 mol m-2 d-1
Dividing by 106 converts the unit of µmol to moles.
The total DLI is a summation of the individual areas under each trapezoid. The column in Figure 2 labeled DLI is a continual summation of the DLI as each trapezoidal area is calculated. In addition, if the time difference between the data points is the same throughout, DLI can be calculated by multiplying the time interval in seconds with the sum of the data points. For the example data,
Δt = 900 s (15 min = 15 × 60 s = 900 s)
and
ΣiPPFD (400~700 nm) = 27818.44478 µmol m-2 s-1.
DLI: (27818.44478 µmol m-2 s-1 ) × (900 s) / (106 ) = 25.0366003 mol m-2 d-1.
You can see that this matches with the total DLI value from the table above at point 72.