Comparison of Quantum Sensors with Different Spectral Sensitivities
Printable PDF: Comparison of Quantum Sensors with Different Spectral Sensitivities
(Sensors-TechNote_Quantum-Comparison_17165.pdf)
Download this content as a pdf that can be saved to your computer or printed.
Almost all the energy on the earth’s surface comes directly or indirectly from the sun. Plants convert light energy from the sun into biologically-useful forms through photosynthesis. We call this light energy photosynthetically active radiation (PAR). Historically, measuring PAR was somewhat subjective because scientists disagreed about the appropriate wavelength range and measurement units. Also, the only instruments readily available were designed and calibrated to match the spectral sensitivity of the human eye, which is very different from the spectral sensitivity of plant photosynthesis. This means light sources with equal measured intensities but different spectral outputs would drive photosynthesis with different efficiencies, making comparisons difficult when different lighting conditions were used.
In a series of decisive experiments, McCree (1972a,b) addressed the questions of appropriate wavelength range and measurement units for PAR. He measured leaf absorptances, action spectra and spectral quantum yields for 22 species of crop plants grown under a wide range of conditions and showed that spectral quantum yields were broadly similar, but sufficiently different in detail that defining PAR in terms of a biological response would be impractical (McCree, 1972a). Instead, he proposed a purely physical definition of PAR as photon flux (µmol photons m-2 s-1) over the wavelength range of 400 nm to 700 nm. He then showed this definition gave the most consistent estimates of photosynthesis rate per unit of light flux across a wide range of light sources with very different emission spectra (McCree 1972b). Using this definition of light intensity allows comparisons of photosynthesis rates, quantum yields, and light-use efficiencies across a broad range of plants, growth conditions, and light sources, with only modest uncertainties due to variations in source emission spectra or plant responses.
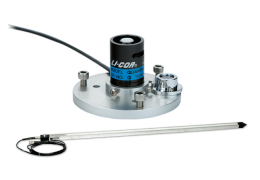
About the same time, instruments to measure PAR were also being developed. Building on the research of Federer and Tanner (1966), Biggs et al. (1971) described a new quantum sensor with response to photons from 400 nm to 700 nm approximating the ideal quantum response. This design was improved and became commercially available from LI-COR (then Lambda Instruments Corporation) in 1973. Since then, numerous commercial manufacturers have produced sensors intended to measure PAR. Due to differences in spectral sensitivity, some of these sensors can introduce significant errors when measuring light from artificial sources or in conditions other than direct sunlight.
In this application note, we describe 1) the history and theory of PAR measurement, 2) a method for assessing measurement errors in PAR sensors, and 3) how commercially available PAR sensors are likely to perform under different lighting regimes.
Theory
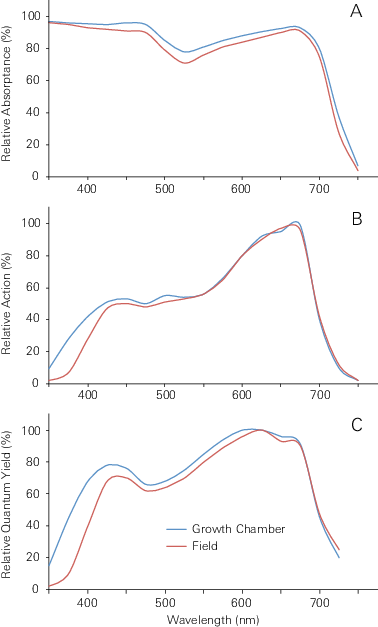
Light illuminating a plant leaf may be absorbed, reflected, or transmitted through the leaf. The fraction of light absorbed depends on the spectral content of the radiation and the absorption spectrum of the leaf. Only light absorbed by the leaf is used to drive photosynthesis. Leaf absorption spectra (Figure 1A) are typically measured using a spectroradiometer and an integrating sphere. Absorption spectra are broadly similar across species, but may vary in detail because of differences in leaf morphology, individual leaf history (e.g., stress, nutrition), and other factors (e.g., genetic differences.
When evaluating photosynthetic response to absorbed radiation across an appropriate wavelength range, photosynthetic rates can be normalized by light intensity in units of incident energy (relative action spectrum; Figure 1B), or in units of absorbed quanta (photons; relative quantum yield; Figure 1C) at each wavelength. As might be expected, the spectral wavelength range for relative action coincides with the wavelength range for the relative quantum yield; however, relative quantum yield is less variable across the spectral range of response. McCree (1972b), compared variations in the relationships between photosynthesis and different measures of light intensity and found that variation was reduced by a factor of two when photosynthesis was normalized to quantum flux (mmol photons m-2 s-1) rather than irradiance (energy flux, J s-1 m‑2 or W m-2).
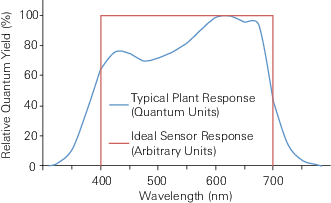
Experimental data show there can be significant variation in the spectral response of photosynthesis due to species variation, as well as growth history. Therefore, we cannot define a single sensor with a perfect spectral response for all plants and conditions (unless it is a spectroradiometer). Instead, the scientific community has accepted a well-characterized physical standard as a measure of PAR. Although the photosynthetic efficiency of an absorbed quantum of blue light is somewhat less than an absorbed quantum of red light, scientists have agreed that an ideal sensor should be equally responsive to all photons across the 400 nm to 700 nm wavelength range and have clear cutoffs to light below 400 nm and above 700 nm (Figure 2). This convention allows us to define and measure PAR as the incident quantum flux in the 400 to 700 nm range without involving any experimental plant responses (McCree 1972b). In the literature, the terms PAR, PPF (photosynthetic photon flux) and PPFD (photosynthetic photon flux density) have been used interchangeably.
Comparison of Quantum Sensors
The spectral responses of all quantum sensors deviate from the ideal response to some degree. We call errors arising from such deviations actinity errors. Actinity errors for seven commercially available quantum sensors were calculated using equation 11 and a tungsten-halogen lamp spectrum as reference. A Cary 17D spectrophotometer modified to measure the spectral response of light sensors was used to measure sensor output in response to a tungsten-halogen reference lamp in 1 nm steps from 350 to about 800 nm. An LI-1800 spectroradiometer was used to collect emission spectra for several light sources under various lighting conditions, or light source emission spectra were obtained elsewhere as noted in Figure 3.
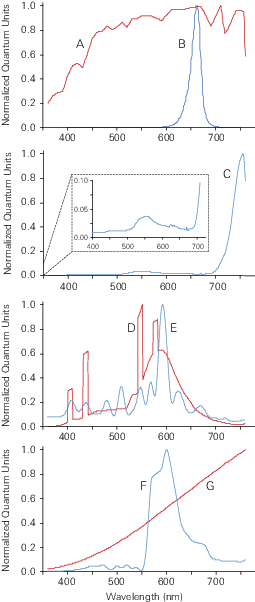
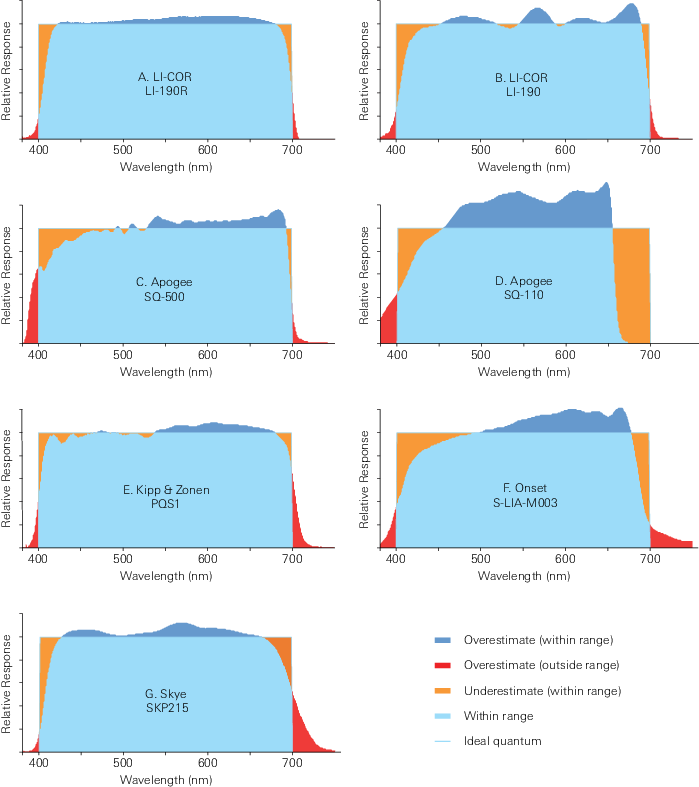
Relative spectral responses of seven quantum sensors that are intended to approximate perfect sensors are given in Figure 4, and the relative spectra for common light sources are given in Figure 3. Actinity errors for the seven sensor types over the range of light sources are shown in Table 1. Actinity calculations from three individual sensors of each type are reported as means and sample standard deviations. Spectral variations within a sensor type were generally small, so the spectral responses shown in Figure 4 are from one sensor of each type, which is considered representative of the group. One exception is the Apogee SQ-500. One of those sensors (serial number 1388) had a long wavelength cutoff about 7 nm further into the far red than the other two sensors in the group. In this case, serial number 1387 is plotted in Figure 4, which is one of the two most similar sensors that also gave the smallest actinity errors. Actinity errors reported in Table 1 show somewhat larger standard deviations for the SQ-500 than for the other sensor types due to variability among the three replicate sensors. Serial numbers for all the sensors tested are given in Table 2.
Measurements were also made of sensitivity to near-infrared (NIR) radiation beyond 800 nm by measuring response to light transmitted through a Kopp No. 2540 IR-transmitting / visible-absorbing filter, which transmits NIR radiation above 800 nm, but blocks far red and visible radiation below 800 nm. Near-infrared radiation that leaks through to a sensor’s detector beyond the 700 nm cut-off can cause errors in PAR measurements when silicon diode detectors are used.
The Apogee SQ-110 Sun Calibration Quantum Sensor (Figure 4D) uses a gallium arsenide phosphide detector with diffuser and is calibrated at the factory to provide accurate measurements of solar radiation from an open sky. But because the sensor response is not uniform from 400 nm to 700 nm, PAR estimates from light sources with different spectra may be in error to various degrees. This is illustrated in Table 1 where all the sensor responses are calculated relative to a tungsten-halogen reference spectrum. The SQ-110 has strong sensitivity from 500 nm to 650 nm, and little sensitivity above 650 nm (red light). This creates over-estimated quantum fluxes for sources richer in mid-wavelengths compared to a tungsten-halogen reference source (Figure 3E), such as fluorescent (Figure 3C), and sources (Figure 3B, F), and under-estimates for sources rich in wavelengths above 650 nm, such as some red LEDs (Figure 3D). PAR estimates for a red LED with 660 nm peak would be underestimated by about 36% (Table 1). Such deviations can be avoided by using specific calibration constants for different light sources, such as solar radiation from an open sky. But the reason for using a quantum sensor is to avoid having to make such corrections, and they may not be possible with mixed sources where the source spectra are not well defined. The Apogee sensor has virtually no sensitivity to NIR radiation beyond 800 nm (data not shown).
The Apogee SQ-500 Full Spectrum Quantum Sensor has a response closer to that of an ideal quantum sensor than the SQ-110 (Figure 4D). Sensitivity to the calibration spectrum and errors due to different source spectra are much reduced compared to the SQ-110 (Table 1). Actinity errors are generally less than about 3% for the sources tested. The relatively larger standard deviations compared to other sensor types are due to spectral variations among the three sensors in our sample, as discussed previously. There was a small sensitivity to infrared radiation above 1000 nm (data not shown).
The Kipp & Zonen PQS-1 PAR Quantum Sensor (Figure 4E) has a reasonably flat response with sharp cutoffs, providing adequate accuracy across all light sources tested. Accuracy under a soybean canopy is improved compared to earlier models because of improved 700 nm cutoff, but it is still not as sharp as either the LI-COR LI-190 or LI-190R. The Kipp & Zonen sensor shows a small sensitivity to near infrared radiation at about 800 nm (data not shown).
The Onset (Figure 4F) and Skye (Figure 4G) sensors both perform poorly against daylight filtered through a soybean canopy due to substantial sensitivity beyond 700 nm. At the same time, they under-estimate quantum flux from the red LED because their sensitivity begins to roll off well before 700 nm. Also, the Onset sensor has substantial sensitivity to near infrared radiation, which can cause additional errors. The Skye sensor is much better in this regard.
Both the LI-COR LI-190 (Figure 4B) and LI-190R (Figure 4A) provide good spectral accuracy across the range of light sources tested. There are differences in detail between them because their optical designs are substantially different. The LI-190 spectral response oscillates around ideal but average response remains good. Spectral response of the LI-190R is much smoother and both sensors have sharp cutoffs at 400 nm and 700 nm. Both sensors have good near infrared rejection, but the LI-190R is improved over the LI-190. The LI-190R provides good estimates of output from the 660 nm LED spectrum. The LI-190 shows slightly larger over-estimates of output from the 660 nm LED, presumably because it has a peak in sensitivity near 660 nm. Sensor responses will vary slightly from sensor to sensor due to spectral tolerances in their designs, but the data shown here are representative of many sensors we have measured over many years.
Summary
All of the sensors described here can be reasonably accurate when measuring broad spectrum PAR typical of open sky conditions. The Apogee SQ-110 should be used with the factory calibration constant, which is set for a daylight spectrum. But if the objective is to measure PAR from any arbitrary light source, such as light modified by a plant canopy, or from an artificial or monochromatic source, or from a combination of sources such as daylight plus supplemental light in a greenhouse, then a sensor with a relatively flat response across the 400 to 700 nm wavelength range and sharp cutoffs outside that range is required to give accurate results.
Of the sensors tested, the LI-COR LI-190R was the most consistently accurate across a range of light sources and showed only small variations from sensor to sensor, followed by the LI-190. Errors across different light sources for the Kipp & Zonen PQS-1 PAR Quantum Sensor and Apogee SQ-500 Full Spectrum Quantum Sensor were similar to each other, but were somewhat larger than those observed with the LI-190R. Errors with the Apogee SQ-110, Onset S-LIA-M003, and Sky SKP 215 were larger than those from the first two groups.
Some manufacturers provide additional calibration coefficient for measuring PAR from artificial sources. However, calibration coefficient can increase measurement errors if the spectral output source differs from that of the light source used to generate the calibration coefficient, or if the light comes from several sources, as it often does in greenhouses and growth chambers, for example.
The LI-190R has many design improvements over the LI-190, which it replaces. These changes provide greatly improved stability over time and many other advantages, which are the topic of another report.
| Light Source | Sensor Actinity Errors, % (standard deviations) | ||||||
|---|---|---|---|---|---|---|---|
| LI-COR
LI-190R |
LI-COR
LI-190 |
Apogee SQ-500 |
Apogee SQ-110 |
Kipp & Zonen PQS 1 |
Onset S‑LIA‑M003 |
Skye SKP 215 |
|
| Tungsten halogen reference lamp3 | 0.0 | 0.0 | 0.0 | 0.0 | 0.0 | 0.0 | 0.0 |
| Sunlight with open sky4 | -0.5 (0.3) | -0.3 (0.7) | -2.5 (1.2) | 11.9 (0.2) | -2.8 (0.9) | -2.1 (0.3) | -2.0 (0.5) |
| Daylight under soybean canopy5 | 0.6 (1.3) | 1.3 (0.6) | 2.4 (1.5) | 17.4 (0.5) | 4.2 (0.3) | 28.4 (0.2) | 18.2 (0.7) |
| Red LED – 660 nm peak6 | 1.9 (0.6) | 2.7 (0.6) | 2.7 (2.7) | -36.3 (0.2) | 0.1 (0.9) | 6.2 (3.5) | -4.3 (0.8) |
| Fluorescent – Cool White7 | 0.3 (0.4) | -1.0 (0.6) | -3.4 (2.1) | 27.1 (0.8) | -3.1 (1.3) | 1.1 (0.8) | -1.6 (0.7) |
| HID – HP Sodium4 | 2.8 (0.3) | 0.6 (0.5) | -0.3 (2.2) | 24.4 (0.7) | 0.8 (0.8) | 7.1 (1.0) | 0.9 (0.7) |
| HID – Metal Halide4 | 0.3 (0.4) | -1.3 (0.6) | -2.9 (2.2) | 22.8 (0.6) | -2.5 (1.3) | 0.8 (0.8) | -2.2 (0.7) |
| LI-COR LI-190R |
LI-COR LI-190 |
Apogee SQ-500 |
Apogee SQ-110 |
Kipp & Zonen PQS-1 |
Onset S‑LIA‑M003 |
Skye SKP215 |
|
|---|---|---|---|---|---|---|---|
| Serial numbers | Q100236 Q100342 Q100350 |
Q53266 Q53247 Q53248 |
1387 1388 1389 |
13408 13421 13429 |
131130 131139 131148 |
10391668 10391669 10391671 |
43294 43297 43298 |
Appendix
Federer and Tanner (1966) and Ross and Sulev (2000) give methods to perform comparisons of light sensors with different spectral sensitivities. We wish to find a means to determine how closely results from real quantum sensors measuring PAR of real light sources compare to results from an ideal quantum sensor measuring the same sources. For simplicity, we limit the discussion to quantum sensors measuring PAR in quantum units, but the discussion can be generalized to include other sensors as well (Ross and Sulev, 2000).
Following Federer and Tanner (1966), we define relative sensor response as r(l) = R(l)/Rm, where R(l) is the sensor output (mV or µamp) per photon as a function of wavelength l (nm), and Rm is a normalizing factor equal to the maximum output over the wavelength range of interest. Rm has units of µamp (or mV) (µmol m-2 s-1)-1 and will turn out to serve as a calibration coefficient. We also define relative photon flux of the light source per unit wavelength as i(l) = I(l)/Im, where I(l) is photon flux per unit wavelength (µmol m-2 s-1 nm-1), and Im is a normalizing factor equal to photon flux at the wavelength where I(l) is maximum. With these relations,

and

Total light intensity is

and sensor output P

For a perfect PAR sensor, r(l) = 1 for all wavelengths between 400 and 700 nm, and zero everywhere else, so

where the subscript p specifies a hypothetical perfect quantum sensor. The quantity  gives photon flux summed over 400 to 700 nm, which is PAR, the quantity we seek.
If we have a calibration light source with known maximum intensity Imc and relative spectral distribution ( ), then we can calibrate a perfect sensor by computing the coefficient Rmp in equation 5.

Using equation 3,  , and
, and  , so
, so

where the subscript c references a calibrating light source over 400 to 700 nm. Now we can use the coefficient Rmp, which serves as a calibration coefficient, and sensor output Pp to measure PAR for any light source with arbitrary intensity and spectrum.

Real quantum sensors like the LI-190 and LI-190R are calibrated and used in exactly this way. The problem is that real sensors are not perfect. The output of a real sensor is determined by both the light source spectrum and the spectral response of the sensor according to equation 4, not just the light source, as in equation 5 for a perfect sensor. This means there will be errors when measuring light sources having spectra that are different from the calibration light source. The magnitude of those errors is a measure of how well a real quantum sensor approximates a perfect quantum sensor; we call them actinity errors.
Ideally, when a quantum sensor measures light with different spectra, the sensor output depends only on the properties of the light sources and not on those of the sensor. We can see if this is true for a perfect sensor by computing the ratio Pp/Ppc. Combining equations 7, 8, and 3,

This ratio depends only on the properties of the light sources, so if our knowledge of the calibrating light source is correct, the measured value of an unknown light source will also be correct. But this is not true for a real sensor because its output depends on spectral response of the sensor as well. This can be seen by computing the ratio P/Pc for a real sensor using equation 4 for the measured and calibration light sources.

The ratio of equation 10 to equation 9 gives the extent to which a real sensor deviates from an ideal sensor when the sensor is used to measure a light source with a spectrum different from that of the calibration source.

Equation 11 gives the mathematical definition of actinity errors for PAR sensors calibrated in photon units. Federer and Tanner (1966) pointed out that it does not depend on the absolute output of the sensor, or absolute intensity of the sources, but only on their relative spectral properties. This allows us to compare the accuracy of real sensors to perfect sensors for a variety of light sources knowing only the relative spectral response of the sensors and relative spectra of the light sources.
References
| 1 | Biggs, W., A. R. Edison, J. D. Eastin, K. W. Brown, J. W. Maranville, M. D. Clegg. 1971. Photosynthesis light sensor and meter. Ecology 52, 125-131. |
| 2 | Federer, C. A. and C. B. Tanner. 1966. Sensors for measuring light available for photosynthesis. Ecology 47, 654-657. |
| 3 | McCree, K.J. 1972a. The action spectrum, absorptance and quantum yield of photosynthesis in crop plants. Agricultural and Forest Meteorology 9, 191-216. |
| 4 | McCree, K.J. 1972b. Test of current definitions of photosynthetically active radiation against leaf photosynthesis data. Agricultural and Forest Meteorology 10, 443-453. |
| 5 | Nobel, P. S. 1991. Photochemistry of photosynthesis. In: Physiochemical and Environmental Plant Physiology pp 245-296. Academic Press Inc, New York. |
| 6 | Ross, J. and M. Sulev. 2000. Sources of errors in measurements of PAR. Agricultural and Forest Meteorology 100, 103-125. |