
In open, flow-through leaf gas exchange systems, calculations of carbon assimilation and transpiration are based on the changes in CO2 and H2O in an air stream as it flows through a leaf chamber (Figure 1‑1).
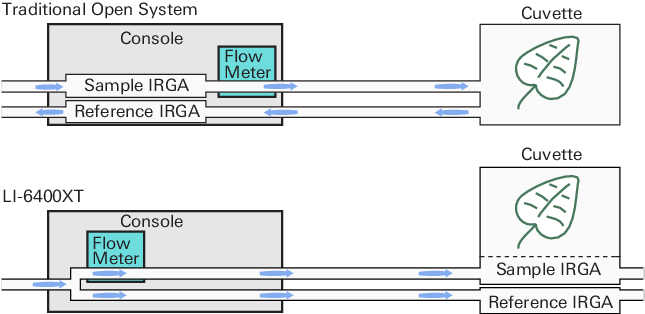
Assimilation and transpiration are computed from air flow rate, leaf area, and the difference in gas concentrations (ΔCO2 and ΔH2O repectively), which are measured by an infrared gas analyzer (IRGA). This can be expressed mathematically as:
1‑1

1‑2

It is assumed that the measured difference between incoming gas concentrations and gas concentrations measured after the leaf are due exclusively to the leaf. In practice, however, this is not always the case. For example, differences can result from gradient-driven diffusion of gas molecules through chamber membranes and gaskets. In some systems, and under some circumstances, water vapor sorption can lead to differences. In addition, unstable incoming gas concentrations can present problems.
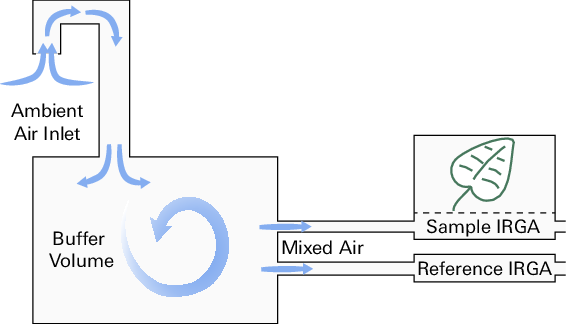
Historically, scientists used buffer volumes to minimize rapid changes in the gas concentrations of the incoming air (Figure 1‑2). To some extent, this ensured that measured difference in gas concentrations accurately represented the effects of leaf assimilation and transpiration. However, the size of the buffer volume relative to the total system volume, flow rate, and variation in incoming gas concentration will determine the overall effectiveness of this technique. Even large buffer volumes will not always resolve the problem, and errors are proportionately greater when measuring small differentials.
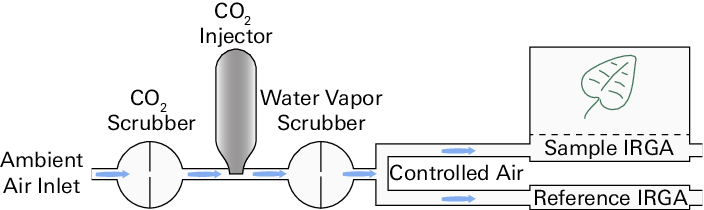
Modern portable photosynthesis systems have the built-in capability to maintain fixed CO2 and H2O concentrations without a buffer volume. These systems use a source of CO2, typically from a 12-gram or 8-gram CO2 cylinder, to provide a controlled CO2 concentration to both the sample and reference analyzers, shown in Figure 1‑3.
In this technical note, we present data collected by a system that uses several different sizes of buffer volumes and controlled CO2 concentrations. We also compare assimilation measurements of a tobacco plant made with an instrument using a buffer volume and one equipped with a CO2 controller.
Materials
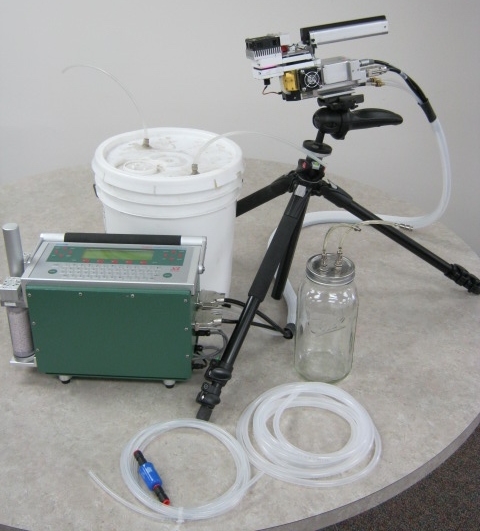
We used an LI-6400XT with a 6400-02B Standard Light Source and several commonly-available materials (Figure 1‑4), including:
- 20-liter plastic bucket buffer volume
- 2-liter glass jar buffer volume
- 20 meters bev-a-line tubing and various connectors
- One tobacco (Nicotiana sp.) plant
- 12-gram CO2 cartridges
Methods
To prepare the instrument we worked through the checklist in chapter 4 of the LI-6400XT instruction manual. For the first measurements, we followed the standard measurement protocol, but with the chamber empty.
The instrument was set to:
- Autologging: Continuously every 1 second
- Match at the beginning of every 10 minutes
- Flow Rate: 300 µmol s-1
- Leaf Area: Set to 6 cm2, even when measurements were made with an empty chamber.
The experiment was set up in a large open room. People passed freely into and out of the room over the course of measurements. After measuring the initial CO2 concentration in the room (433 ppm), we took measurements for 45 minutes in each of four conditions:
- Uncontrolled, air was sampled from outside. The air inlet tube was about 6 meters (20 feet) from an adjacent road with moderate automobile traffic.
- 2-liter buffer volume connected before the air inlet, sampling indoor air.
- 20-liter buffer volume connected before the air inlet, sampling indoor air.
- CO2 control on reference at 433 ppm CO2. We used the CO2 mixer to control the CO2 concentration.
For the first five minutes of measurements for each dataset we controlled CO2 with the instrument CO2 mixer to achieve stable initial conditions. We matched the analyzers every 10 minutes over the course of measurements.
To demonstrate the difference between a 20-liter buffer volume and controlled CO2 on actual assimilation, we conducted a second set of measurements of assimilation on a leaf of a healthy tobacco plant.
Results
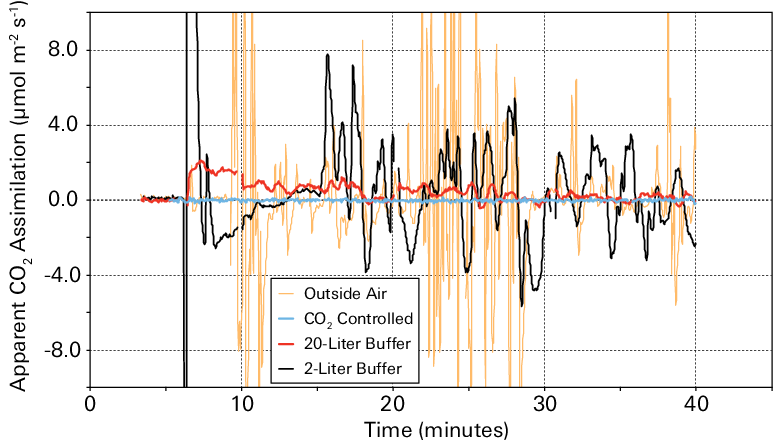
The data (Figure 1‑5) show that outside air resulted in great variability in computed assimilation. The 2-liter buffer volume reduced variability considerably, and the 20-liter buffer volume reduced variability even more. Measurements made with the CO2 mixer most accurately represented apparent CO2 assimilation of zero.
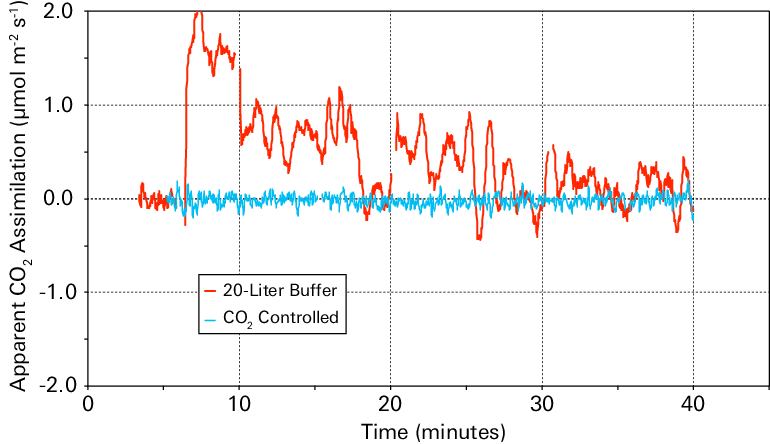
A 20-liter buffer volume provided less accurate and precise measurements of apparent assimilation than a controlled CO2 concentration (Figure 1‑6).
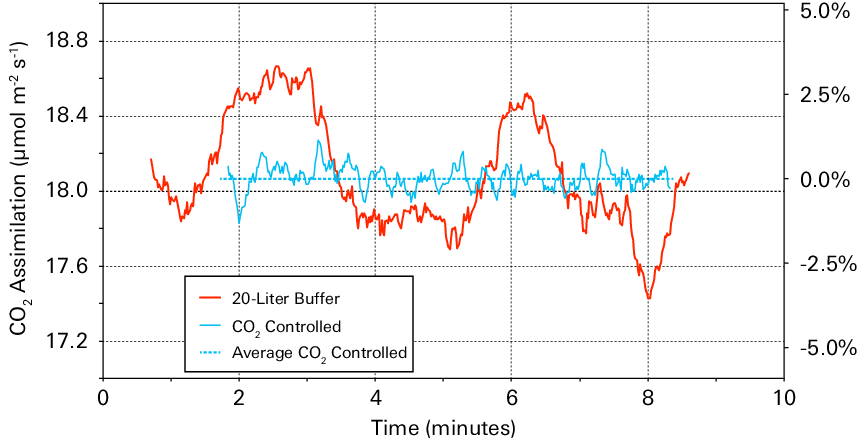
Continuous measurements on a tobacco (Nicotiana sp.) leaf using the CO2 mixer to control CO2, and using a 20-liter buffer volume and no CO2 mixer show that the 20-liter buffer volume did not provide the stability provided by the CO2 mixer. Measurements using the buffer volume stayed within 5% of those made with the CO2 mixer (Figure 1‑7).
Discussion
The apparent CO2 assimilation rate in an empty chamber is plotted against time in Figure 1‑5. The results should be zero for all measurements. When the CO2 concentration of the incoming air was controlled using the CO2 mixer, the apparent assimilation was very close to zero for the full period (blue line). When the air supply CO2 concentration was not controlled by the instrument but was buffered by a buffer volume, the impact of variation in incoming CO2 concentration on the apparent assimilation rate was substantial.
Figure 1‑6 shows apparent assimilation data only from the controlled CO2 concentration and the 20-liter buffer volume. Even measurements using a 20-liter buffer volume were less stable than the controlled CO2 concentration.
When measuring assimilation of a tobacco leaf, the 20-liter buffer volume provided measurements that were within 5% of those taken with controlled CO2 (Figure 1‑7). Nevertheless, the buffer volume was unable to achieve the same stability.
The absolute error resulting from variation in the incoming CO2 concentration is the same regardless of the actual assimilation rate; and these errors are a smaller fraction of the total as the true assimilation rate increases. Therefore, these types of errors are more problematic when measuring low assimilation rates, such as with stressed plants, light response, and ACi curves.
For these datasets, we matched the analyzers carefully with CO2 controlled by the mixer before collecting the data. The certainty of a match will be lower without the CO2 mixer.
Conclusions
Although a 20-liter buffer volume does stabilize gas concentrations in the air more than smaller buffer volumes, it does not provide the stable CO2 concentrations that are achieved with the CO2 mixer. This variation may not be significant if you are measuring high photosynthesis rates, but when measuring low rates, the error can be substantial relative to small ΔCO2 and ΔH2O values you are measuring.