6400-02(B) LED Source
There are some things to consider in discussing 6400-02 LED Source calibrations:
- It is a light source
- The desired brightness of the LEDs is communicated to the source by means of a command voltage. The relation between this signal and light output requires a calibration that is a function of temperature and LEDs age. This calibration is easily done by the user, and is described below.
- It contains a light detector
- The relationship between the internal silicon photodiode’s output and the real quantum output of the LEDs is measured at the factory, but will drift as the detector ages. This calibration is done at the factory, and should be checked every two years.
Aside: We do not recommend using an LI-190 quantum sensor to calibrate an LED light source detectors for two reasons: First, unit-to-unit variations in a quantum sensor’s response within the 400-700 nm range (i.e., those "wiggles" in its response function) can potentially cause significant measurement discrepencies when measuring a narrow-peaked source, such as LEDs. Secondly, the closer the LED is to the 700 nm cut-off in the quantum sensor sensitivity , the more potential you have for differences due again to unit-tounit variations. Also, temperature induced variations in spectral output and sensitivity can contribute to apparent shifts in response when measuring LEDs with a quantum sensor. Factory calibrations of LI-COR LED light sources involve a spectroradiometer, which does not suffer from the above-mentioned shortcomings. - It ages
- As the source ages, its maximum output drops. This affects the user calibration, but not the factory calibration. The factory calibration has to do with the how the detector ages, not the LEDs.
Light Source Calibration
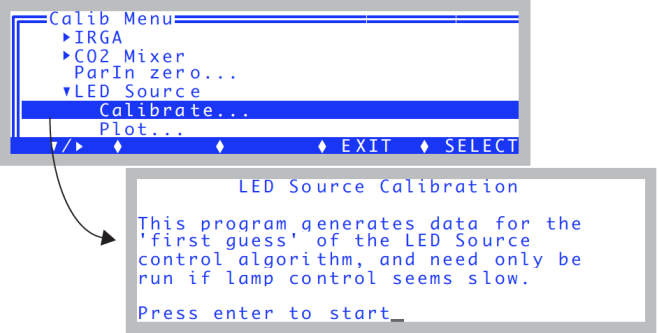
Calibration data relating the LED Source’s command signal with light output can be generated by running the light source calibration program in the Calib Menu (Figure 18‑23).
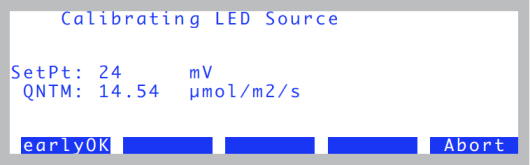
The program goes through a series of command voltages (10, 20, 50, 100, 1000, 2000, 3000, 4000, and 5000 mV), at each waiting for 10 seconds then recording the QNTM value (PAR in μmol m-2 s-1) (Figure 18‑24).
When done, the program will show the data and provide you with an opportunity to plot the relation between set point and output (Figure 18‑25).
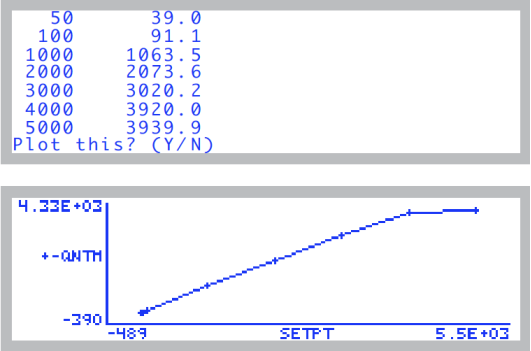
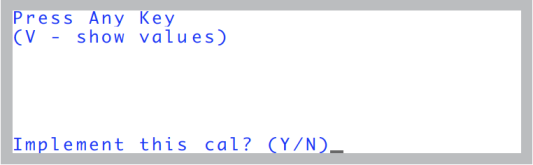
To actually implement this calibration data, you must respond by pressing Y when asked (Figure 18‑26).
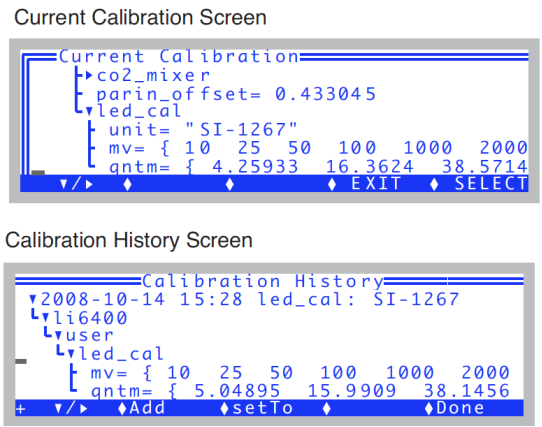
The calibration data is visible in the user calibration tree under the <li6400> <user> <led_cal> node, so is thus visible in the "View Current..." program under "View Settings" in the Calib Menu, and also in the Calibration History screen (Figure 18‑27). (Note: the <led_cal> node is only visible in the current calibration while you are configured for the 6400-02B light source.)