
Printable PDF: Interfacing Custom Chambers to the LI-6400/XT Sensor Head
Instructions for creating custom chambers for the LI-6400/XT.
Introduction
The LI-6400/XT can use custom-made chambers for a wide variety of applications. Adapting the LI-6400 for whole plant canopy gas exchange measurements is discussed in LI-6400 Application Note 2. Another approach using a smaller chamber is described here, along with some general considerations. We complete the example by measuring photosynthesis of Prostrate Spurge (a weed with tiny leaves growing close to the ground) and the respiration rate of detached fruit. This application illustrates how other shapes and sizes of chambers can also be attached to the sample IRGA cover plate of the LI-6400 sensor head and demonstrates the adaptability of the LI-6400 for a variety of gas exchange configurations.
As a precautionary note, departing from a standard 2 × 3 cm LED chamber involves losing control of illumination and also compromising some humidity and temperature control. Sometimes modifying the measurement protocol can avoid the need for a special chamber altogether. This note is for cases where a custom chamber is clearly necessary.
Considerations for Building Your Own Chamber
Two design characteristics of sample chambers are shape and volume. These characteristics not only affect the size and shape of the subject material that can be measured, but also have a bearing on air flow rates and consequently the magnitude of the reference and sample chamber concentration differences. In addition, as chamber volume increases, lack of control of chamber temperature and humidity may become an issue. It may also become necessary to install a fan inside the chamber to achieve adequate mixing. Chamber Volume, Time Constant and Mixing For chamber volumes smaller than about two liters, the mixing fan within the sample chamber IRGA provides adequate mixing of the chamber volume. For larger chambers, an additional fan should be installed within the chamber. For a thoroughly mixed, open, flow-through system, the chamber concentration C(t) at time t, is given by:
1‑1

Where C0 is the initial chamber concentration, Ce is the incoming concentration, f is the airflow rate and V is the chamber volume. By definition, the time constant τ of the chamber is the time it takes for the chamber concentration to get to within 1/e or about 63% of the final concentration. Equation 1 shows that τ is given by:
1‑2

For example, for a well-mixed chamber of volume 2000 cm3 and an airflow rate of 700 μmol/s (15.7 cm3/s), the time constant is 125 seconds. By contrast, the standard 2 cm × 3 cm LED light source chamber has a volume of about 80 cm3 and at a flow of 700 μmol/s, its time constant is about 4 seconds.
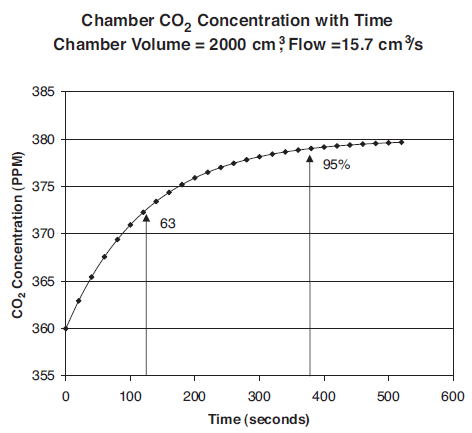
Starting with an initial chamber concentration of 360 ppm, an incoming flow of 700 μmol/s (15.7 cm3/s) and concentration Ce of 380 ppm, the chamber concentration reaches 95% of the final concentration after about 380 seconds.
Leaf Area, Flow Rate and CO2 Differentials
One of the main reasons for custom-designing a chamber is to increase the amount of plant material that can be enclosed within the chamber, in order to increase the precision of measuring low rates of exchange (e.g. when measuring plant respiration or low rates of photosynthesis). To find the minimum sample area required to obtain a given measurement precision, do the following analysis:
Assume:
- The CO2 noise is ± 0.1 ppm. (The LI-6400 has a typical peak-to-peak noise of 0.2 ppm at 350 ppm with 4- second signal averaging).
- We desire a 2% measurement precision.
- Minimum flow is 200 μmol/s.
To get a 2% measurement precision of the CO2 concentration differential (difference between reference and sample chamber concentration), the differential should be at least 5 ppm (this is obtained by dividing analyzer noise by the required precision, 0.1/0.02, or 5 ppm). Next we consider how to generate a 5 ppm CO2 differential. This will obviously depend on the amount of plant material enclosed within the measurement chamber, its CO2 exchange rate, and the air flow rate through the system.
Ignoring the dilution effects of water vapor (see Von Cammaerer and Farqhuar, 1981, or LI-6400 Manual, 1999), the gas exchange rate in an open flow through system is given by:
1‑3

Assuming a fairly low yet practical airflow rate of 200 μmol/s, the minimum sample area required to generate a 5 ppm CO2 differential is given by:
1‑4

If we wanted to measure a CO2 exchange rate of 0.5 μmol/m2/s with a precision of 2%, the required chamber should enclose a minimum leaf area of about 20 cm2. Other ways we could improve the measurement precision of low activity material would be to increase the signal averaging time, or further reduce the flow rate. For example, increasing the signal averaging time from 4 seconds to 16 seconds would cut the noise in half. Decreasing the flow rate below 100 μmol/s may not be practical however, as this could increase diffusive leaks (see LI-6400 Manual, page 4-43) and increase the chamber time constant. If a 5% measurement precision was acceptable, the 2 cm × 6 cm narrow leaf chamber would be sufficient for measuring an exchange rate of 0.5 μmol/m2/s.
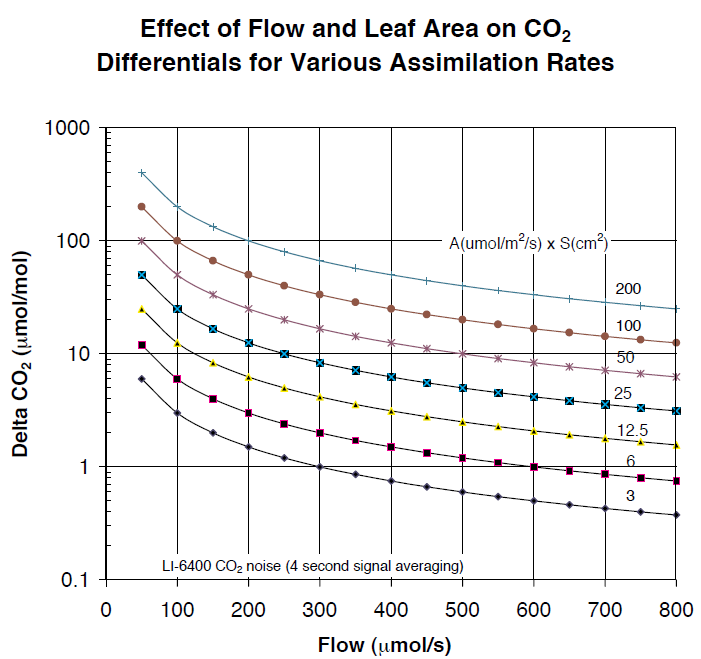
Figure 1‑2 shows the relationship between flow (μmol/s) and CO2 differentials for various combinations of CO2 assimilation rates (A, in μmol/m2/s) and leaf area (S, in cm2). To find the expected CO2 differential, multiply the assimilation rate expected by the leaf area to be enclosed within the chamber, and follow the appropriate graph line to the air flow rate desired. For example, a 5 cm2 leaf area with a net assimilation rate of 5 μmol/m2/s will generate a CO2 drawdown of 10 ppm when the air flow rate is 250 μmol/s.
Leaf Area, Flow Rate and Chamber Humidity Control
Enclosing actively photosynthesizing and transpiring plant material within the measuring chamber will not only lower the chamber CO2 concentration, but will also raise humidity levels. The primary limitation here is the supply of dry air. If transpiration exceeds the flow rate of dry air, then chamber humidity will rise and condensation will occur. Lower flow will raise humidity, while a lower transpiration rate requires a lower flow rate of dry air.
Combining equations 1-4 and 1-7 from the LI-6400 Manual, stomatal conductance, g (mol/m2/s) can be expressed as:
1‑5
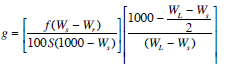
Where f is the airflow rate (μmol/s), S is the leaf area (cm2), Ws is the sample chamber water vapor mole fraction (mmol/mol), Wr is the incoming or reference chamber water vapor mole fraction (mmol/mol), and WL is the water vapor mole fraction (mmol/mol) within the leaf air spaces (this value is calculated using the leaf temperature measurement).
1‑6
solving for Ws we get:
1‑7

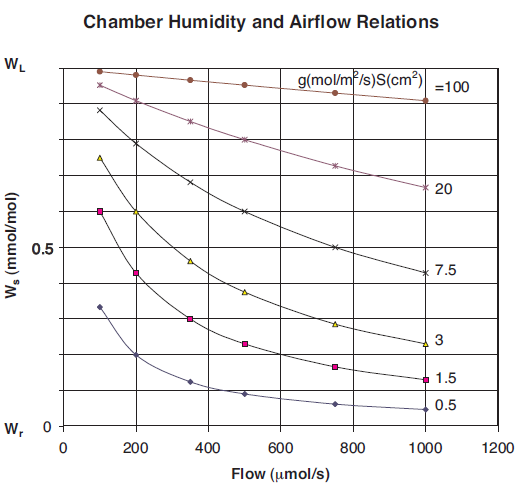
If leaf and air temperatures are the same, then the highest value of Ws possible before condensation would occur would be WL. The lowest value possible (at very high flow rates) would be Wr. Figure 3 shows the relationship between airflow and chamber humidity for various multiples of stomatal conductivity and leaf area. Ws is shown as a fraction of the value between Wr and WL.
Example: Flow = 700 μmol/s, dry incoming air (Wr= 0), Tleaf = 30 °C (WL ≈ 43 mmol/mol), leaf area = 50 cm2, g = 0.15 mol/m2/s. Ws would be about halfway between Wr and WL or about 22 mmol/mol. If Wr were 20, then Ws would be about 32 mmol/mol.
Chamber Temperature Control
The standard 2 × 3 cm LED light source has a volume of about 80 cm3. Under normal field conditions, the temperature control range of the LI-6400 is about ±6 °C from the ambient temperature. With a larger chamber, the temperature control range possible with the standard thermoelectric coolers will be reduced.
Interfacing Custom Chambers to the LI-6400 IRGA
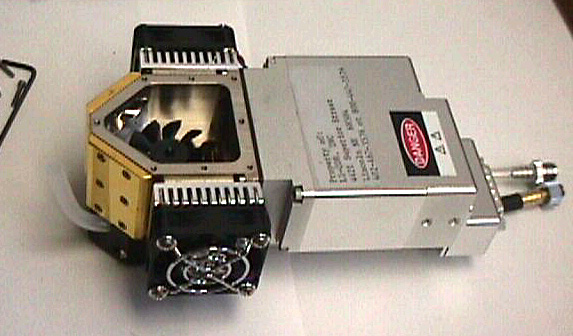
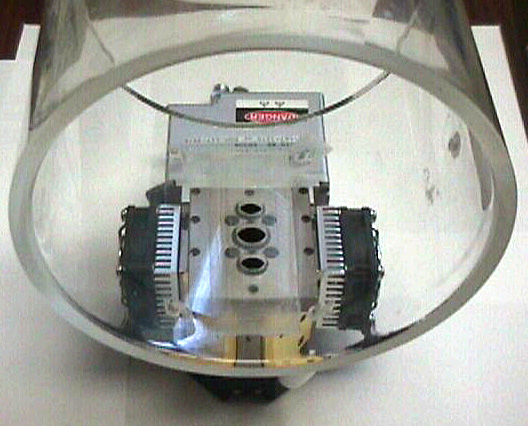
Figure 1‑4 shows the LI-6400 sensor head from which the latching handle, the leaf chamber and the sample IRGA cell cover plate have been removed. The mixing fan can be seen within the sample IRGA cell.
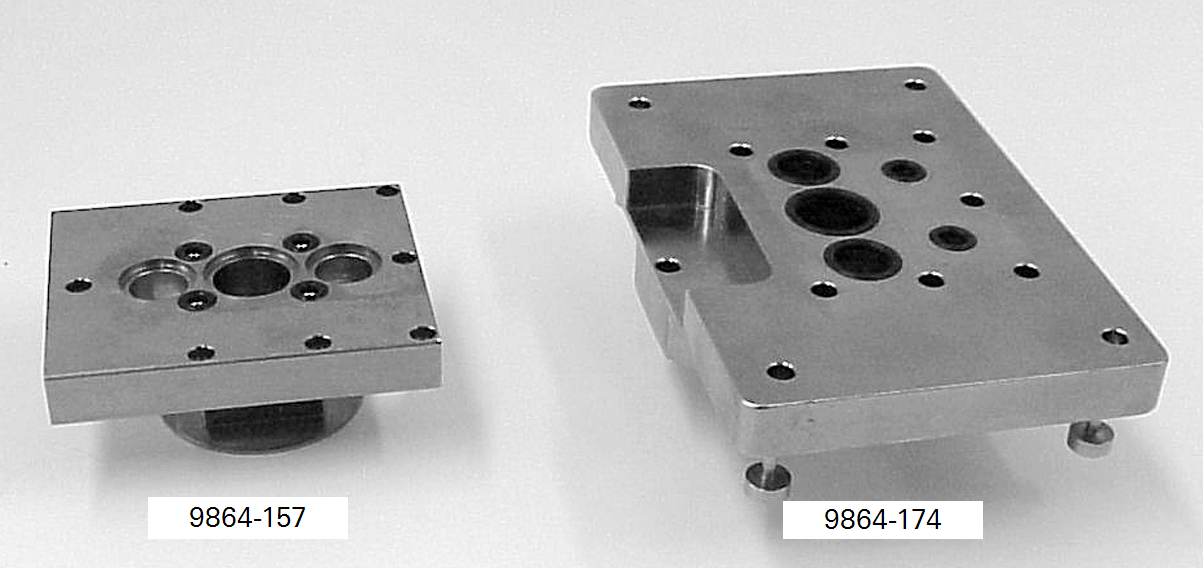
Attaching a custom chamber involves replacing the sample IRGA cell cover plate with either the mounting plate used for the 6400-09 Soil Chamber (part #9864-174) or the mounting plate used on the 6400-05 Conifer Chamber (part #9864-157). Figure 5 shows these mounting plates. The Soil Chamber mounting plate is on the right hand side. While either mounting plate will provide a suitable base for attaching a custom chamber, the 9864-174 mounting plate provides a larger base area than the 9864- 157 plate, and is suitable for larger chambers. A dimensional drawing for the 9864-174 mounting plate can be found here.
The air inlet manifolds, attached to the reverse side of these plates, can be seen in Figure 1‑5. These manifolds are a little different from each other, and from the inlet manifold used with the other standard chambers. The correct air inlet manifold must be used with each type of mounting plate (part # 9864-158 for the Conifer Chamber mounting plate and part #9864-032 for the Soil Chamber mounting plate). During operation, the mixing fan pushes air out of the two outer holes of the mounting plate.
The air returns to the sample IRGA cell via the larger middle hole of the mounting cover plate.
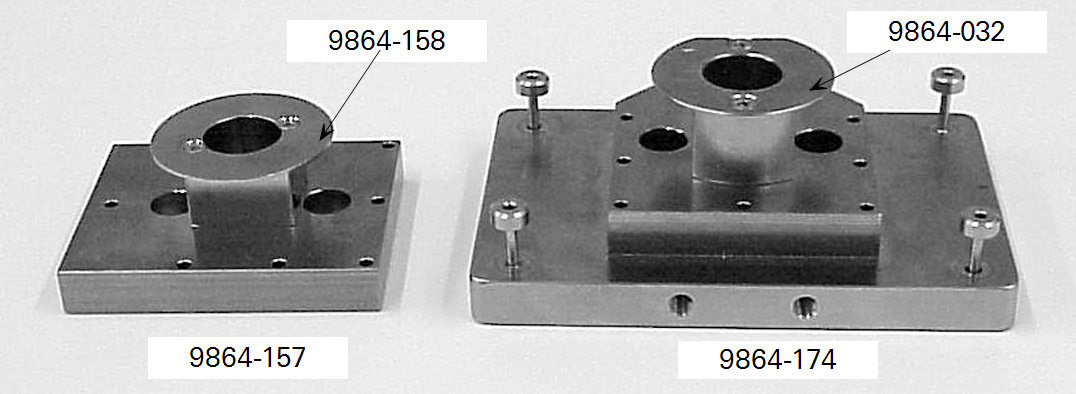
Figure 1‑6 shows the 9864-174 Soil Chamber mounting plate and the 9864-157 Conifer Chamber mounting plate attached to the sample IRGA cell. The orientation of the three holes (with respect to the sensor head body) on the conifer chamber mounting plate is at right angle to the orientation of the holes on the soil chamber mounting plate. The difference in orientation does not affect circulation or mixing of the chamber air. The air is still propelled out of the two outer holes, and returns to the sample IRGA cell via the larger central hole.
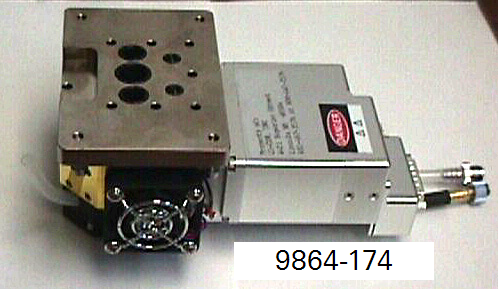
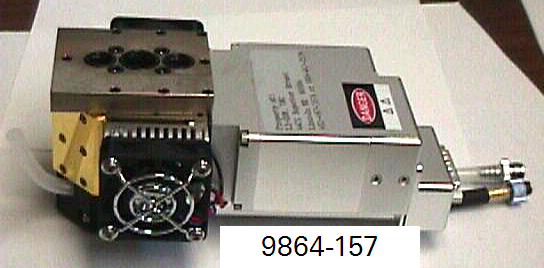
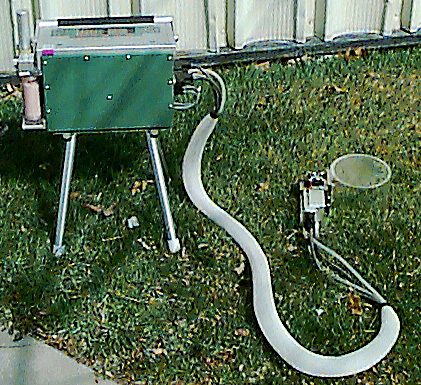
Figure 1‑7 shows a relatively large (approximately 2 liters in volume) custom chamber made from a piece of Plexiglas tubing. The tube diameter is about 14 cm. The chamber was made by cutting an approximately 13.5 cm length of the tube and covering one end of the tube with Propafilm (LI-COR part #250-01885) using double-stick tape. The other end of the tube was left open. Note the three holes in the chamber wall the machined flat surface for matching up against the three holes of the mounting plate. Also present was another small hole (not visible) to which a chamber exit tube leading to the Match Valve could be attached.
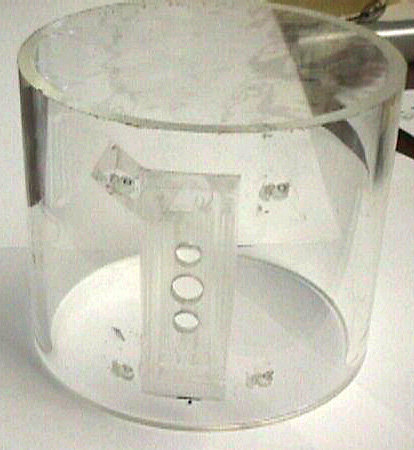
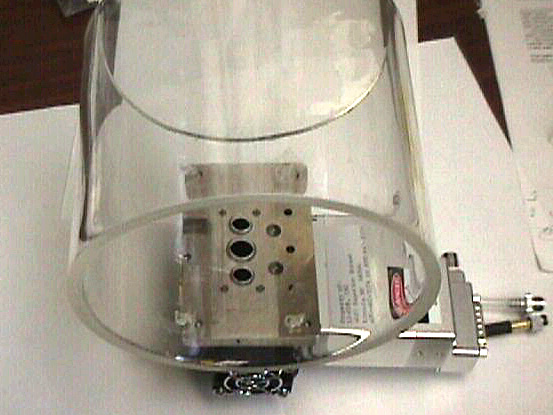
Figure 1‑8 shows the Plexiglas tube chamber attached to the LI-6400 sensor head using the Soil Chamber and the Conifer Chamber mounting plates.
Although in this design a piece of Plexiglas tube was used to make an open-ended cylindrical chamber, the user is free to employ any shape that is appropriate for a particular application.
Chamber Material and Sorption/Desorption of Water Vapor
An important consideration in chamber design is the chamber material and its water sorption/desorption properties. Water vapor tends to sorb and desorb slowly on most types of surfaces, and may require long periods of time (approximately one hour was needed for the chamber shown in Figure 1‑7) to establish equilibrium. If adequate time is not allowed for the water vapor readings to stabilize, then transient sorption/desorption effects can cause the apparent leaf transpiration rates to appear smaller or larger than they actually are. Therefore, stomatal conductance readings (and values such as intercellular CO2 concentration) will be in error. To minimize these effects the chamber walls can be coated with Teflon tape (LI-COR part #212-02314). In the above chamber example, stomatal conductance values were not of interest and the chamber walls were not coated to minimize water sorption effects.
Matching and Software Considerations
When taking open, flow-through measurements, chamber volume is not used in calculations (see Equation 3), so the standard configuration in Open is fine. The only change needed is the protocol used to match the analyzers. For a large chamber such as the one described above, the chamber time constant even at a high flow rate of 700 μmol/s is several minutes (Fig. 1). This means the sample chamber concentration may take a long time to stabilize, which could cause problems during matching. The simplest way to deal with this is to turn off the mixing fan (Menu level 3, f3) so that the sample chamber air does not come back into the sample IRGA cell. In this mode, the air flowing through the reference IRGA will also flush out the sample IRGA, allowing a matching of the IRGAs (under menu level 1, f5) without having to wait for the sample chamber to reach equilibrium concentration. However, it is important to turn the mixing fan on again after matching is complete. Another way to do this is to setup an Autoprogram to turn off the mixing fan and enter the Match Mode. This can be done by either building a new Autoprogram (under Utility Menu) or editing an existing Autoprogram. When editing an existing Autoprogram, insert LPL Set Fan Speed statements before and after an LPL Match statement as shown below:
0 LPSetFanOSF
LPMatch
2 LPSetFanOSF
When building a new Autoprogram, the steps should include:
Set Control (choose fan speed, and turn fan off without prompting)
Match
Set Control (choose fan speed, and turn fan on without prompting)
Autoprograms are described in Chapter 9 of the LI-6400 Manual. With respect to matching, the Plexiglas chamber described above had a chamber exit tube leading to the Match Valve. The main purpose of this exit tube was to provide a route for the sample air stream to escape when the chamber was sealed. This occurred during fruit respiration measurements when the chamber was placed on a flat surface. When using the chamber over soil, the exit tube was not necessary, because soil is porous and the chamber did not seal well against the ground. With a completely sealed chamber design, a chamber exit tube should always be installed, even though it may not be used for matching IRGAs.
Measurement Examples
Effect of Temperature on Fruit Respiration
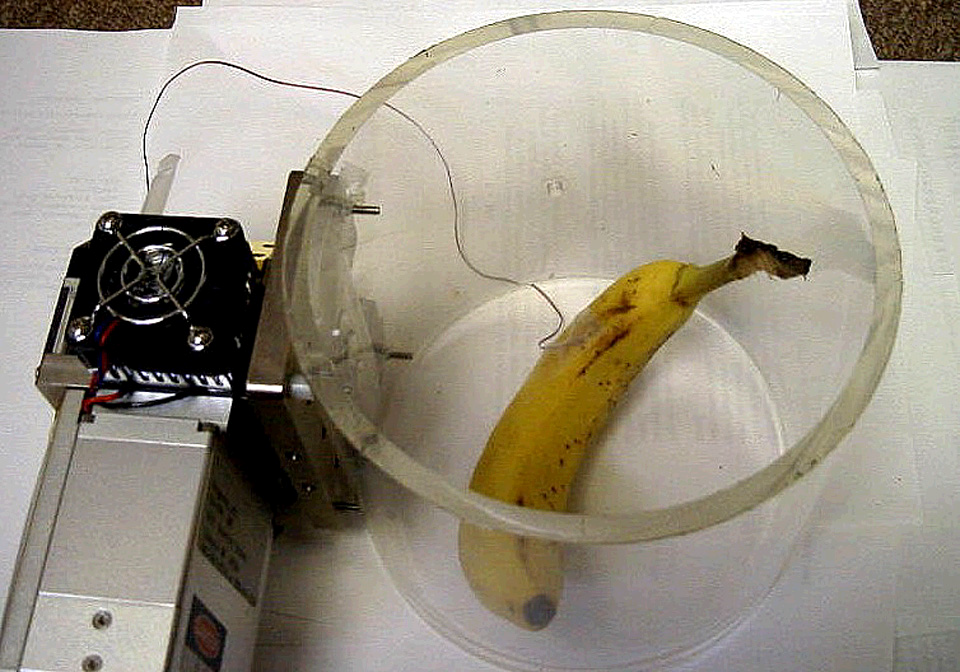
Figure 1‑9 shows the Plexiglas custom chamber being used for measuring the respiration rate of a banana. Although it is not immediately apparent from Figure 9, the top end of the Plexiglas tube is covered with Propafilm. The lower end of the Plexiglas tube remained open-ended. Note that the standard leaf thermocouple has been replaced with a longer “E-type” thermocouple wire which has been taped on the fruit for measuring its skin temperature. The banana had a surface area of about 220 cm2. The CO2 mixer was used to set the reference CO2 concentration to 400 μmol/mol. Temperature was raised by activating the thermoelectric coolers in New Measurements (menu level 2, f4).
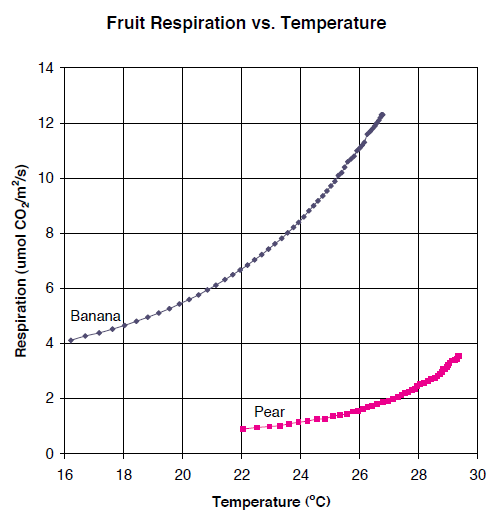
With a flow rate of around 700 μmol/s, the respiring banana generated a delta CO2 concentration of over 300 μmol/mol. The measurement was also repeated on a pear with a surface area of about 175 cm2. Figure 10 shows the respiration rate of a banana and pear as affected by the fruit skin temperature. The advantage of using a large chamber to measure low rates of exchange was evident in that even with respiration rates of less than 2 μmol/m2/s and flow rates of 700 μmol/s, the large area of the pear generated CO2 deltas of over 50 μmol/mol. This provided stable, high-precision measurements of the respiration rate.
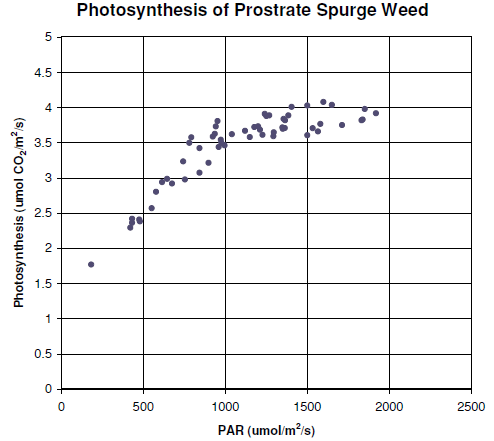
Measurement of Photosynthetic Rate of Prostrate Spurge (Euphorbia prostrata)
Figure 1‑11 shows the Plexiglas chamber being used to measure the photosynthetic rate of Prostrate Spurge, a creeping weed. An airflow of 700 μmol/s and an incoming CO2 concentration of around 400 μmol/mol were employed. The chamber area was 154 cm2 and photosynthesis was calculated on a unit ground area basis for this exercise. The measurements were taken on a cloudy day, so that light levels varied as clouds moved across the path of the sunlight.
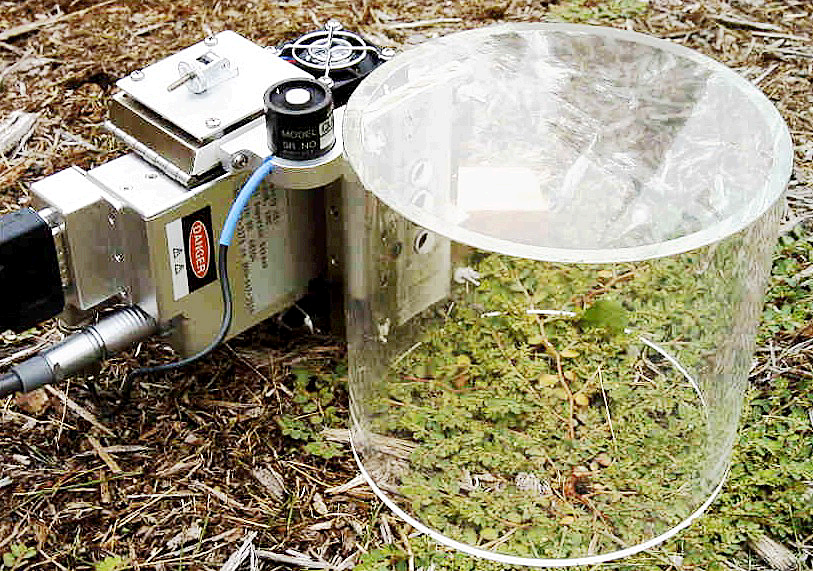
Figure 12 shows the photosynthetic rate of the Prostrate Spurge as affected by sunlight. Placing a cardboard box over the chamber resulted in zero light level, and provided an estimate of the soil and plant respiration components (about 2 μmol/m2/s), which were subtracted prior to plotting Figure 1‑12.
This chamber was also used to measure the photosynthetic rate of an actively growing grass sward (see Figure 1‑13). The grass had photosynthetic rates of around 15 μmol/m2/s (on a unit ground area basis). However, even with an airflow rate of 700 μmol/s fully diverted through the desiccant, the system was unable to control chamber humidity. Figure 13 shows the condensation on the chamber walls during the grass sward measurement. A smaller volume chamber would have been more appropriate for measuring photosynthesis of actively growing grass.
Conclusions
The LI-6400 can be easily adapted for a variety of measurements. Chambers ranging in size from the 1 cm diameter Arabidopsis leaf chamber to the one-liter Soil Chamber are available from LI-COR. Also of interest may be LI-6400 Application Note 2 which describes how to set up a canopy chamber. For chambers in between these sizes, it is relatively simple to use the mounting plates for the 6400-09 Soil Chamber or the 6400-05 Conifer Chamber for attaching almost any unique chamber design.
References
| 1 | Caemmerer, S Von, and Farquhar, G.D. 1981. Some relationships between the biochemistry of photosynthesis and gas exchange of leaves. Planta, 153:376-387. |
| 2 | LI-6400 Manual, 1999. LI-COR, Inc. |