
Printable PDF: RGB Light Source and Photosynthetic Assimilation
Instructions for the RGB light source.
Summary
- The 6400-18 Red, Green, Blue (RGB) Light Source can deliver 2000 μmol m-2 s-1 white light1.
- Three LED colors can be controlled independently to deliver any combination desired.
- Absorption spectrum of a plant drives the effectiveness of each color’s photosynthetic response.
- LED light should be normalized to the absorption spectrum of the plant.
Action spectrum of plants and RGB output
Not all incident radiation is absorbed by actively photosynthesizing leaves. Depending on wavelength, light incident on a leaf may be reflected, transmitted through the leaf or absorbed by the light harvesting complex to drive the light reactions. The proportion of light absorbed at any particular wavelength varies between and within species, and frequently between individual leaves in a plant canopy, dependent on canopy position and the history of the leaf.
Absorbed light drives the light reactions and variations in the amount of absorbed light alter the overall carbon assimilation rate. For many higher plants, much of the photosynthetically active radiation (light with wavelengths between 400 – 700 nm) is absorbed with peaks near the absorption peaks of chlorophyll a and b (a: 430 and 660 nm; b: 455 and 645 nm). As a result, light with wavelengths in the red and blue region of the spectrum typically drive photosynthesis more efficiently than other wavelengths. On a quanta basis, red and blue often drive the same amount of photosynthesis since the extra energy in blue light is quenched non-photochemical processes (e.g. heat; Blankenship, 2002). However, because other wavelengths of light are absorbed and are equally capable of driving photosynthesis, it is important to not only describe an absorption spectrum, but also the photosynthetic action spectrum for the absorbed light.
Action spectra describe the amount of CO2-fixed or O2-released at a particular wavelength across the absorption spectrum for a leaf. As is the case for absorption spectra, action spectra vary greatly between species (McCree, 1972). For many C3 species, there is greater assimilation when plants are illuminated with red light and to a lesser extent blue light than when illuminated with green light.
The 6400-18 Red, Green, Blue (RGB) Light Source is a composite LED source comprised of multiple diodes embedded within a tile. The LED wavelength peaks of this commercially available tile are 460, 522 and 635 ± 5 nm, corresponding to light in the blue, green and red regions of the light spectrum respectively. Apparent white light is achieved by providing equal quanta of each LED color. This is not a broad-spectrum white such as solar radiation, but rather it is the composite of all three LED colors. The LED tile used in the RGB Light Source achieves white light levels of 2000 μmol m-2 s-1 with a spatial uniformity of ± 10% over 90% of the output area.
Plant response with RGB output
Each LED color in the RGB Light Source can be controlled independently. Due to this independence of control, one natural experiment is to examine the photosynthetic response to each LED color. Light responses at each color were measured on 6 to 8 week old Arabidopsis thaliana plants using the 6400-17 Whole Plant Arabidopsis Chamber. A combination of clay capping of the planting medium and slight overpressure were used to suppress CO2 flux from the planting medium (see Application Note #4: Using the Whole Plant Arabidopsis Chamber Effectively). Photosynthetic responses were measured at 600 μmol mol-1 CO2 and 50 – 70% relative humidity at approximately 25 °C. The plants were light acclimated under 600 μmol m-2 s-1 white light† until photosynthesis and transpiration were at steady state. Light responses were measured from high to low in a single color chosen at random. Plants were again acclimated to 600 μmol m-2 s-1 white light and the response was then repeated with a different color.
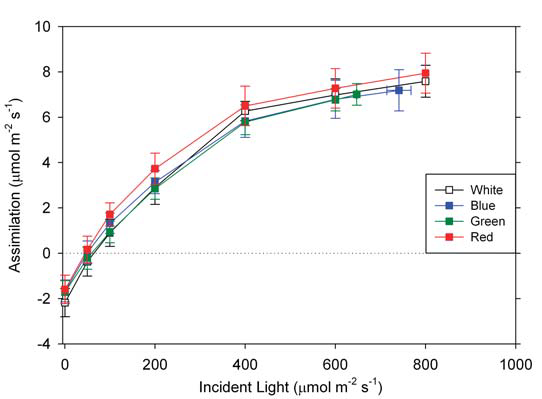
The photosynthetic responses to light for the different colored LEDs were similar (Figure 1‑1). Based on the action spectrum discussed above, red light was expected to have the greatest assimilation rate at each light intensity and green would produce lower assimilation rates. However, there was no difference between the photosynthetic responses to each of the colors, which was surprising based on previous studies (McCree, 1972).
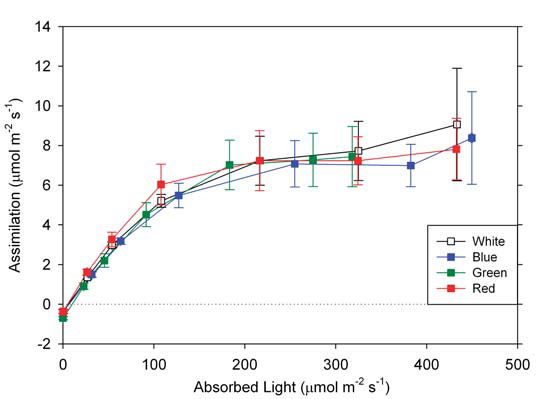
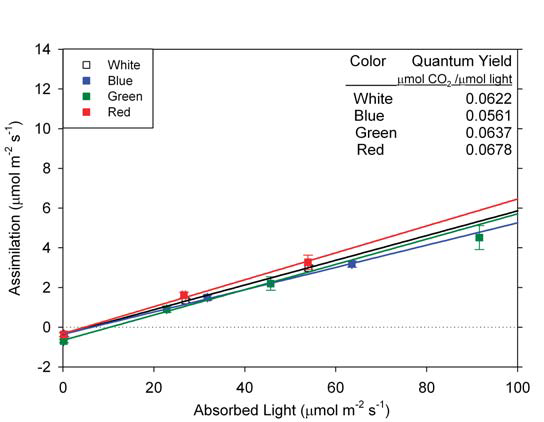
To eliminate any enhanced assimilation effect of greater light absorption by the overlapping leaves of the rosette, photosynthetic responses to different colors of light were measured on individual leaves. The RGB Light Source was placed over a standard clear-topped 2 × 3 cm chamber and the photosynthetic assimilation was measured on single leaves from 6 to 8 week old plants. Chamber environmental conditions were as noted above. There were no significant differences in the photosynthetic response under different colored light (Figure 1‑2). The absorbed light was calculated from absorption spectra for Arabidopsis. The quantum yield was calculated for each color and there was no difference in the rates between colors (Figure 1‑2).
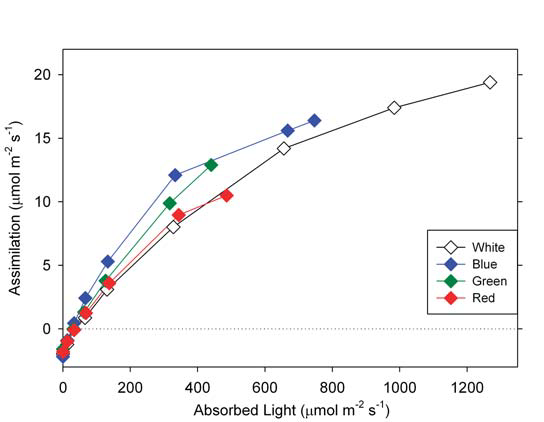
The leaf-level photosynthetic light response of field-grown soybean leaves was also investigated. Individual soybean (cv.U98-311442) leaves were measured following the same protocol with a 2 × 3 standard chamber except that [CO2] was controlled at 380 μmol mol-1 and light intensities were higher. The different light colors drove photosynthesis at similar assimilation rates (Figure 1‑3).
The similarity in photosynthetic responses at different colors of light for the two species suggested that the absorption should be similar. The absorption spectra of Arabidopsis and soybean were measured from 400 to 700 nm in 1 nm increments using a spectroradiometer (LI-1800 Portable Spectroradiometer, LI-COR, Inc.) and integrating sphere (1800-12S External Integrating Sphere, LI-COR Inc.). Arabidopsis absorption was greatest in the blue and red wavelengths and was 30% lower in the green wavelengths (Figure 1‑4). Soybean had much stronger absorption across all wavelengths and did not have such a large decrease in the green wavelengths.
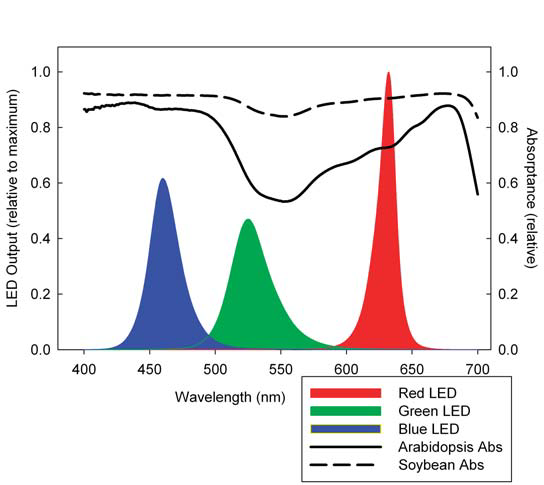
However, the LED output in combination with the absorption spectra show that light absorption was similar for each LED color type. With similar light absorption, the lack of a difference in the photosynthetic responses to color is clear. For both Arabidopsis and soybean, the red LED output (peak 635 nm) is not centered on the absorption peak (approximately 680 nm). Additionally, there is substantial absorption of the green LED as it overlaps into the blue and red. The calculated weighted absorption (αw) is the product of the leaf absorption (α) and the LED quantum output (Q) from wavelengths (λ) 400 to 700 nm and is normalized to Q.
1‑1

The αw for soybean differed by only 6% and the difference between green and red αw was only 9% for Arabidopsis (Table 1‑1). Although there is a larger difference between the green and blue LEDs (23%), significant overlap in output spectra and the lower efficiency of blue light conversion to reducing power decreased the effective difference in αw between these colors. The lack of significant differences in absorbed light for the different LED colors resulted in similar photosynthetic rates.
Conclusion
The three colored LEDs’ output spectra are absorbed by plant species differently. Because of plants’ ability to capture much of the PAR spectrum and the bandwidth of the LED output, most of the light striking the leaf is absorbed and used in photosynthesis. When examining the photosynthetic response to light, it is important to normalize the light to the plant’s absorption. When used in concert, the three LED colors give an apparent white light well suited for many photosynthesis studies. The 6400-18 RGB Light Source delivers white light† that is near solar irradiance levels without the heat generation associated with broad spectrum sources.
Acknowledgments
Thanks to R. Ott at the University of Nebraska-Lincoln for providing the soybean seed stock.
Bibliography
| 1 | McCree, K.J. (1972) The Action Spectrum, Absorptance and Quantum Yield of photosynthesis in Crop Plants. Agricultural Meteorology 9: 191-216 |
| 2 | Blankenship, R.E. (2002) Molecular Mechanisms of Photosynthesis. Blackwell Science Ltd., Oxford, United Kingdom. |