
Instructions for this proceedure.
Introduction
The fraction of light absorbed by a leaf (αleaf) is required for determining quantities such as the Quantum Yield of photosynthesis (ϕCO2) and the Electron Transport Rate (ETR) in Photosystem II (see equations 27-10 and 27-11 on page 27-5 of the LI-6400XT manual). Table 27-21 on page 27-78 of the LI-6400XT manual shows values for αleaf for the red and blue LEDs used in the 6400-40 Leaf Chamber Fluorometer for several species of plant leaves (Maize, Bean, Jasmine and Orange). Both the blue and red parts of the spectrum are strongly absorbed by green leaves, with typical values for αleaf being about 0.90 for the blue LEDs and 0.84 for the red LEDs. If more accurate values for αleaf are desired, these can be determined using an integrating sphere. However, an integrating sphere may not be readily available to everyone and taking the appropriate measurements can be laborious and time consuming. Here we describe a method for estimating αleaf from a simple measurement of leaf transmittance taken using the 6400-40 Leaf Chamber Fluorometer and the External Quantum sensor of the LI-6400XT. The method relies on using an established correlation between leaf transmittance in the 6400-40 Leaf Chamber Fluorometer and the blue and red LED absorptances determined using an integrating sphere and a spectroradiometer.
Experimental Setup
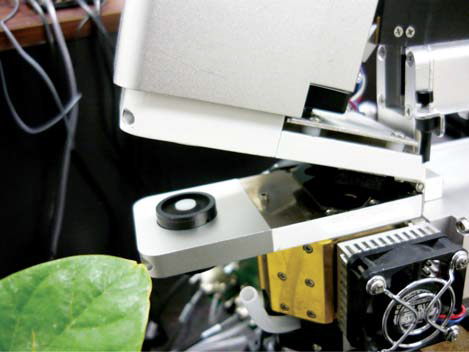
To establish the relationship between a simple leaf transmittance measurement taken in the 6400-40 Leaf Chamber Fluorometer and leaf blue and red LED absorptance as determined in an integrating sphere, the Fluorometer chamber base was removed and replaced with the Quantum Sensor Chamber Mount (part # 9864-111). The Quantum Sensor Chamber Mount is supplied with new LI-6400XT Systems for the purpose of performing an approximate check on the calibration of the 6400-02B LED light source. The photograph below shows the External Quantum Sensor and the Quantum Sensor Chamber Mount attached in place of the 6400-40 Fluorometer chamber bottom.
Leaf transmittance is measured by operating the 6400-40 red LEDs at a constant mV control signal (e.g. 1000 mV) and noting the ParOut value before and after clamping the leaf between the 6400-40 and the External Quantum Sensor. A range of leaf species of different thickness, age and color (Soybean, Corn, Rice, Avocado, Bushbean and Tobacco) were selected for establishing the relationship between leaf transmittance and absorptance. Note that if the Quantum Sensor Chamber Mount is not available, leaf transmittance measurement can also be taken by holding the External Quantum sensor in front of the open aperture of the 6400-40 and noting the ParOut reading with and without the leaf in between.
Figure 1‑2 shows a plot of the spectral reflectance, transmittance and absorptance of a pale young Soybean leaf between 300 and 1100 nm. The measurements were taken using an LI-1800 Spectroradiometer and an 1800-12S External Integrating Sphere (LI-COR, Inc.). The reflectance, transmittance, and absorptance measurements were taken with the upper surface of the leaf facing the integrating sphere light source. Also shown in Figure 1‑2 are the relative spectral outputs of the red and blue LEDs used in the 6400-40 Fluorometer. Total leaf absorptance was determined by integrating over the wavelength range of the blue and red LEDs and normalizing for their spectral output (see Table 1‑1).
Table 1‑1 shows leaf transmittances measured in the 6400-40 Leaf Chamber Fluorometer using the red LEDs (as described in the text) and absorptances in the blue and the red LED output regions determined using the LI-1800 Spectroradiometer and the 1800-12S integrating sphere.
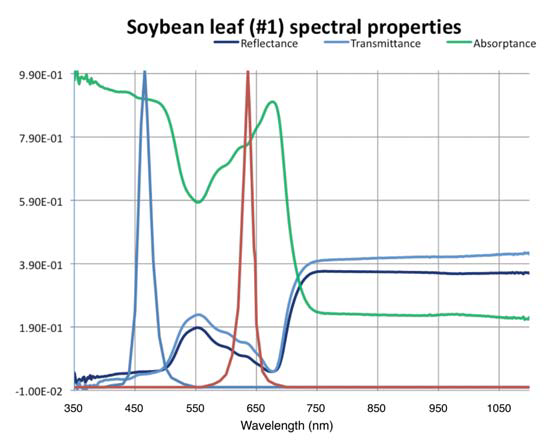
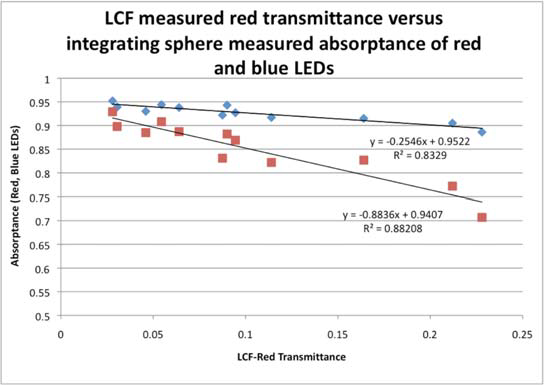
Figure 1‑3 shows the relationships between leaf transmittance measured using the 6400-40 red LEDs and the integrated leaf absorptances over the spectral output range of the 6400-40 Leaf Chamber Fluorometer blue and red LEDs for the twelve representative leaves in Table 1‑1. The two regression lines can be used to estimate total leaf blue and red absorptance αleaf at any ratio of red and blue light intensities.
Example Calculation
Using the setup shown in the photograph, leaf transmittance for the red LED band was 0.12, then leaf absorptance in the red, αleaf (red), and leaf absorptance in the blue αleaf (blue) would be:
1‑1αleaf (red) = 0.9407 - 0.8836*0.12 = 0.83
1‑2αleaf (blue) = 0.9522 - 0.2546*0.12 = 0.92