
Printable PDF: Modification of LI-6400/XT to Control Low CO2 Concentrations
Instructions controlling low CO2 concentrations.
The LI-6400/LI-6400XT can be modified to control CO2 concentrations down to 0 μmol CO2 mol-1 air. However, with the low-CO2 modification, the LI-6400/ LI-6400XT cannot simultaneously control the CO2 concentration and automatically adjust the flow rate to maintain the H2O concentration. As always, LI-COR staff is available to assist with any technical questions about the instrument.
Introduction
As plant scientists work to improve crop productivity to meet global demands for food and fuel, greater focus is being placed on improving or transferring the CO2-concentrating mechanism in C4 plants. The CO2-concentrating mechanism in C4 plants increases efficiency at low CO2 concentration by increasing the CO2 concentration in the bundle sheath cells, which competitively blocks the oxygenation reactions. The greater efficiency of the C4 pathway is evident in the lower intercellular CO2 (Ci) that corresponds to a net positive carbon assimilation rate or CO2-compensation point (Γ). Typically in C4 plants, Γ is ≤ 10 μmol CO2 mol air-1, whereas Γ in C3 plants ranges between 40 and 50 μmol mol-1 (Lambers et al., 2006, von Caemmerer, 2000).
Empirical gas-exchange measurements of the assimilation rate at very low Ci can be accomplished either by decreasing the CO2 concentration outside the leaf (Ca) to low levels or by inducing low stomatal conductance, thereby decreasing CO2 diffusion into the leaf. The first method is preferable since it will achieve low Ci while leaf chamber conditions can be optimized for high stomatal conductance to decrease the variance in measured gas exchange. In differential gas-exchange systems such as the LI-6400/LI-6400XT, the difference between the air entering and exiting the chamber is used to calculate the net change in the gas concentration, which is then used to calculate the net flux (see LI-COR, 2008). Leaf stomatal aperture is regulated to control the water loss from the leaf and consequently restricts CO2 diffusion into the leaf. The stomatal conductance to water (gs) is used to calculate Ci (see LI-COR, 2008). As gs approaches 0, the uncertainty in the calculated Ci increases; conversely, higher gs decreases the uncertainty in the calculated Ci. Therefore, high gs and low Ca are important to be able to make gas exchange measurements at low Ci values.
While there is some variation between systems, a typical LI-6400/LI-6400XT equipped with the 6400-01 CO2 mixer assembly can control the CO2 concentration down to between 30 and 50 μmol mol-1. With the CO2 mixer turned off, a CO2 concentration of 0 μmol mol-1 can be achieved. If the CO2 concentration between 0 and 50 μmol mol-1 are needed, the LI-6400/LI-6400XT console flow path can be modified by the user to accomplish this and easily returned to normal factory flow path later if desired (Figure 1‑1; A). The altered flow path places the CO2 mixer on the positive pressure side of the pump (Figure 1‑1; B), forcing the injector pressure to work against the system pressure, effectively decreasing the flow of pure CO2 from the mixer and thereby allowing lower the CO2 concentration control points.
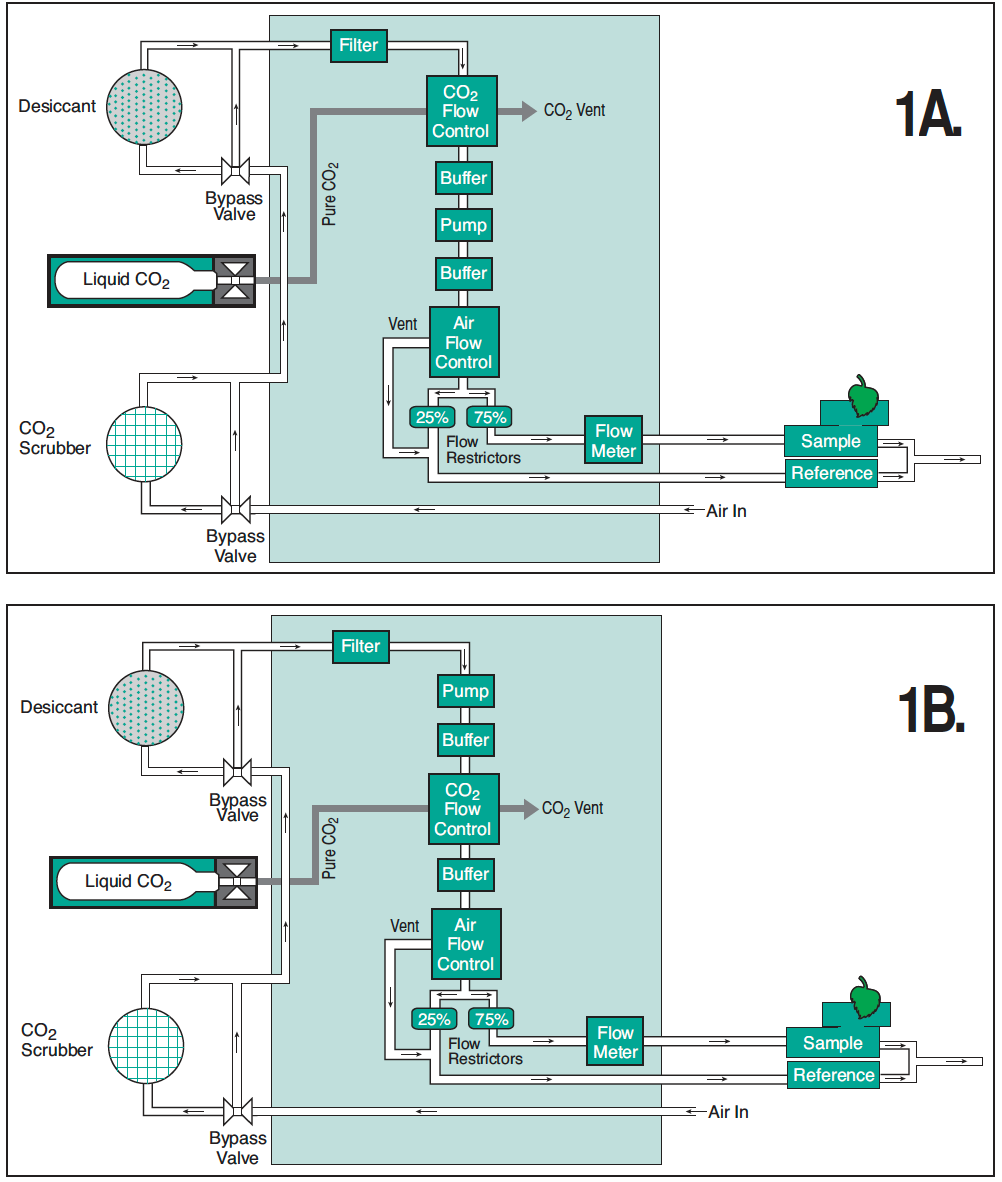
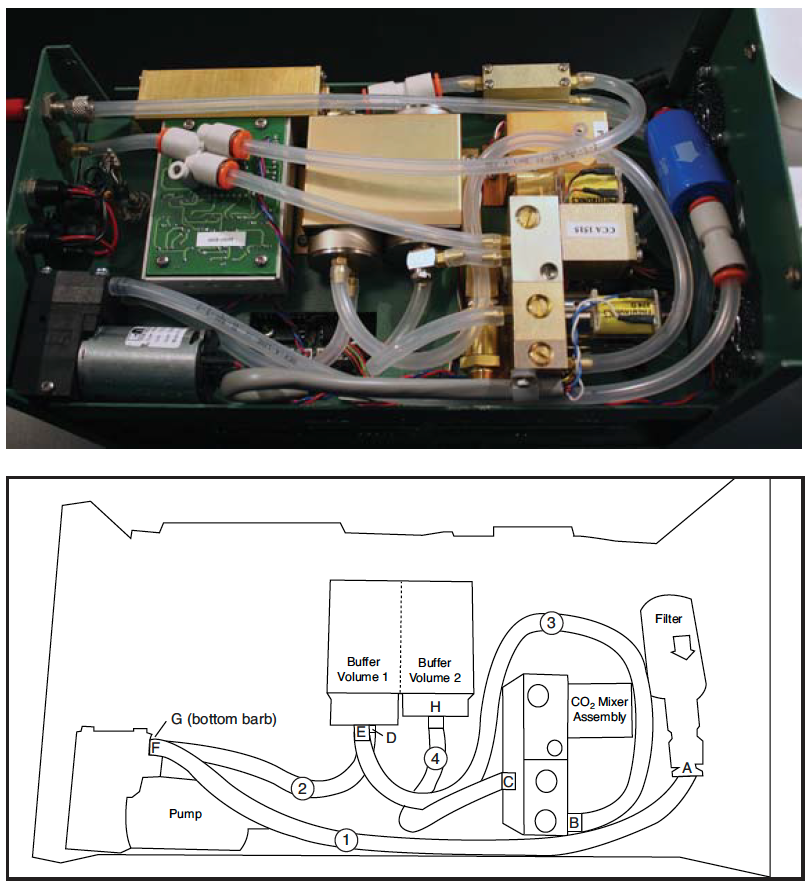
Flow modification to LI-6400/LI-6400XT Modification of a LI-6400/LI-6400XT equipped with a CO2 mixer to control at low CO2 concentrations is easily done with minimal tools and equipment. The modifications should take two hours or less to complete, and can easily be reversed to return an instrument back to the original configuration. The modification involves removing the existing Bev-a-line® tubing from the air filter, CO2 mixer, first buffer volume and pump; the rest of the flow pathway remains unaltered. LI-COR staff will be able to assist with any questions regarding the modifications.
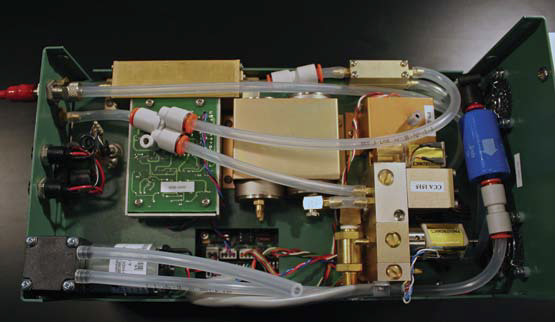
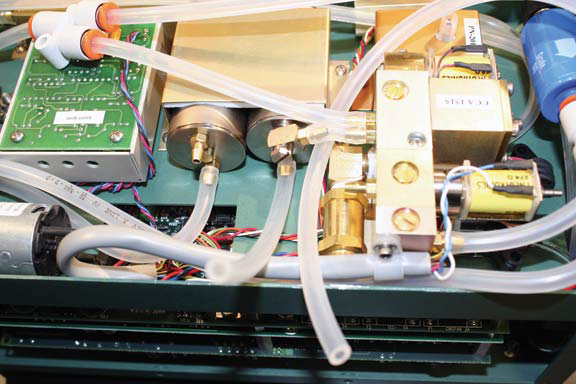
- With the unit powered off and disconnected from mains and/or battery power, remove the console shell and turn the console upside down. Instrument is shown in standard factory configuration and the color of components may vary.
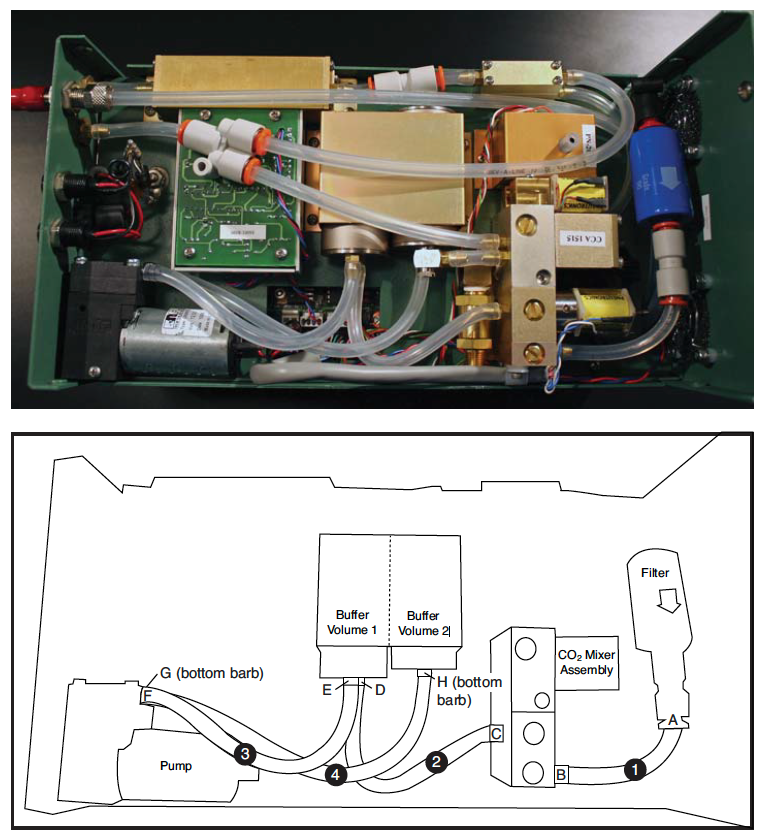
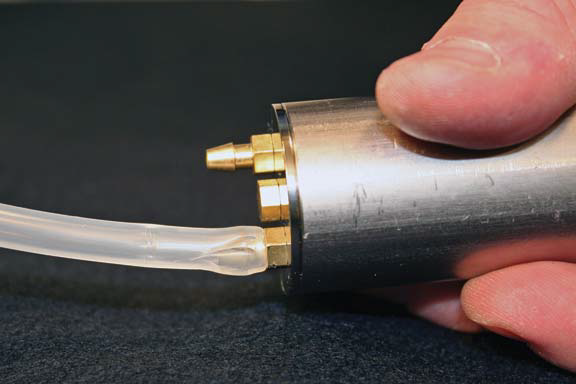
- Remove tubing (1) from the quick connect fitting (A) on the outlet end of the filter.
- Remove (1) , (2) , (3) , (4) tubing from the inlet (B) and outlet (C) of the CO2 mixer, the inlet (D) and outlet (E) of buffer volume 1, and inlet (H) of buffer volume 2.
-
- The hose barbs are plastic (on the pump) or brass (on the rest of the components) and can be easily damaged by any hand tool or cutting device. If a hose barb is damaged during tube removal, it must be replaced. Even very small scores in the fitting surface are channels that will allow bulk air leaks, which will impact the stability of the CO2 and H2O control. Additionally, bulk leaks will cause a significant offset in the IRGA zeros, impacting all subsequent measurements of CO2 and/or H2O.
- The tubing can be removed by grasping it on top of the barb with a pair of side-cut pliers and stretching the tube.
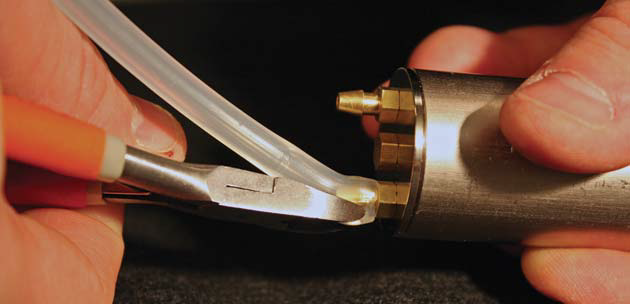
- The tubing can also be cut at an oblique angle to the tube, which will make the tube wall thinner and therefore more easily removed without damaging the barb.
- If damaged, the hose barbs can be removed easily with a 1/4-inch or adjustable wrench by turning the barb counter-clockwise. New hose barbs can be installed by turning clockwise to tighten. Be sure that there is a black rubber fitting on the hose barb and that the fitting is free of cracks and debris.
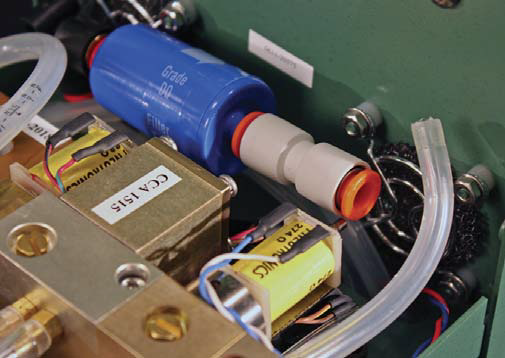
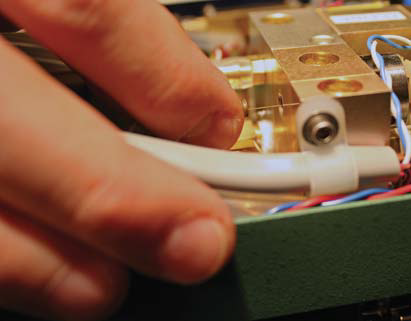
- If you are removing the hose barb on the outlet of the CO2 mixer assembly, be very careful of the very small GLASS tube (below) that runs inside this hose barb. This glass tube can be sheared off if the hose barb is taken off or installed at an angle. Broken glass tubes will require a return for factory repair.
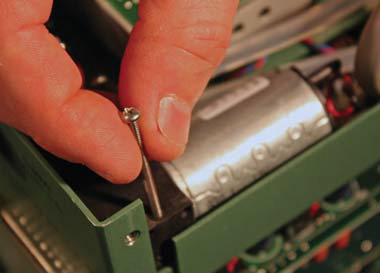
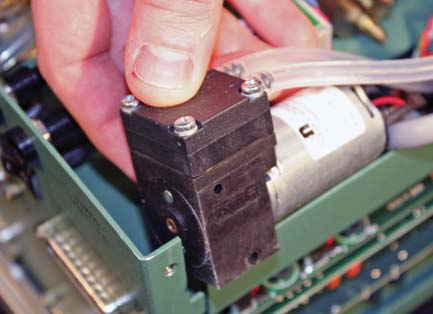
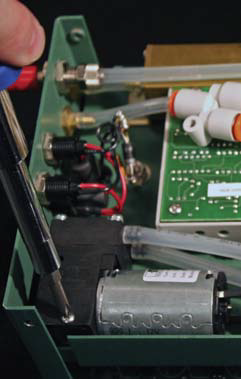
- Remove the screw to make accessing the tubing easier by repositioning the pump. Remove tubing from the inlet (F) and outlet (G) of the pump, being careful of the plastic hose barbs.
- From a new supply of Bev-a-line tubing (LI-COR P/N 8150-250), cut four lengths of tubing: (1) = 30 cm; (2) = 13 cm; (3) = 34.5 cm; and (4) = 11.5 cm. It is important to use Bev-a-Line or similarly diffusion-resistant tubing to limit diffusion leaks.
- When cutting the tube, ensure the cut is at right angles and the tubing is not crushed or deformed.
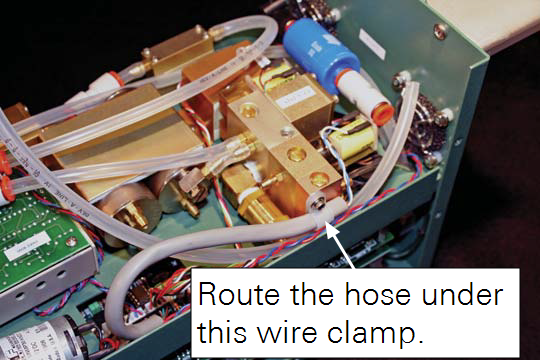
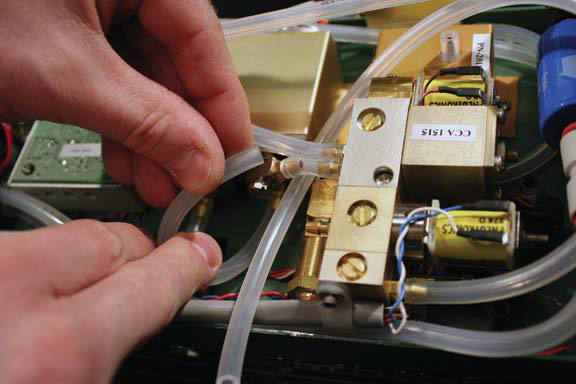
- Route (1) under the wire clamp on the side of the CO2 mixer and connect to the quick connect coupler (A).
- Lightly lubricate with silicone grease (p/n 210-1958-1) or teflon grease (p/n 210-05774) the outside of the tubing to ensure the o-ring inside the quick connector seats and seals around the tubing.
- Connect other end of (1) to the inlet side (F) of the pump. The pump body has arrows that indicate the direction of the flow.
- Connect (2) to the outlet (G) of the pump and then reinstall the pump with the screw.
- Connect the other end of (2) to the inlet hose barb (D) on buffer volume (1).
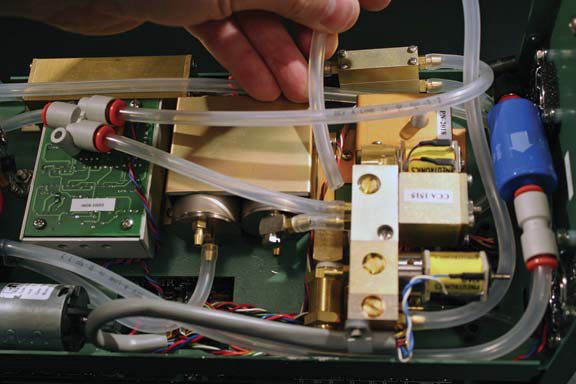
- Connect (3) to inlet (B) of the CO2 mixer. Gently form tubing (3 into a loop to route the tubing under the hose from outlet of buffer volume (2).
- The tubing should only be bent into curves such that the internal volume is not decreased. If the tubing is bent too severely, the tubing wall will crease, causing a diffusion leak through the damaged area.
- Install (4) on the inlet (H) of buffer volume (2).
- Gently form a loop in tubing (4) (clockwise corkscrew) and connect to the CO2 mixer outlet (C).
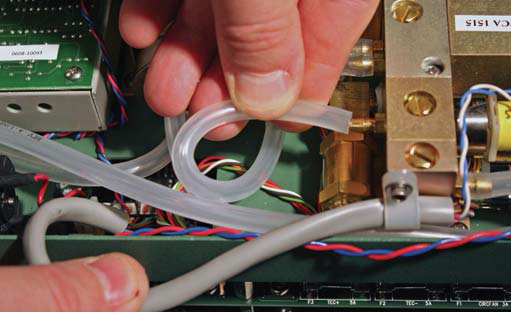
- Gently form tubing (3) into an “S” to route the tubing to outlet hose barb (E) on buffer volume (1).
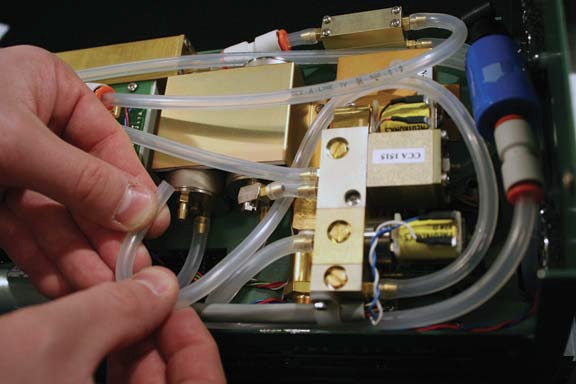
- When routing the tubing for the connections, position it to avoid crushing by the console shell. Summary of Connections (barb-tubing-barb): A- (1) -F; G- (2) -D; E- (3) -B; and C- (4) -H.
Once the flow modification is complete, the system should be tested for leaks. Right the console and connect the power. Care should be taken not to touch any of the electrical components to prevent injury to the user or any damage to the instrument from a short. Fill the CO2-scrub tube with fresh soda lime and place on full scrub. Bypass the desiccant. Connect the sensor head cables and tubing and power-on the instrument. In New Measurements (F4), monitor the CO2 concentration in the sample and reference cells. Once the CO2 concentration is stable, blow under the console to increase the ambient CO2 concentration around the flow-path components. If the CO2 concentration increases in both the reference and sample, the flow path has a leak. Blow through a tube/straw around the different components to isolate the leak. Any leaks should be repaired before using the instrument for measurements.
Reverting back to standard CO2 control
To return the instrument to the standard, factory flow-path, remove tubing from connections A - H. From a new supply of Bev-a-line tubing (LI-COR PN 8150-250), cut four lengths of tubing: 1 = 7.4 cm; 2 = 11.5 cm; 3 = 12.7 cm; and 4 =16.5 cm. Connect them in the following sequence (barb-tubing-barb): A- 1 -B; C- 2 -D; E- 3 -F; and G- 4 -H. Undo the edits to the CO2 Mixer Calibrate program (see next section).
Configuration and calibration for modified CO2 control
With the modification of the flow path, the response of the 6400-01 CO2 mixer assembly to the control voltage signal will change. The LI-6400/LI-6400XT relies upon a calibration curve for determining the control voltage to achieve an initial set-point for a given requested CO2 concentration for either CO2R or CO2S control. Within the Calibration Menu (F3), CO2 Mixer Calibrate generates a calibration for the CO2 mixer. For instruments running OPEN v6.1.4 and below, the system code for the automated process needs to be modified to include additional set points at low CO2 concentrations. The file can be modified either via “Access the Filer” in the Utilities Menu (F5) or via a PC connection using LI6400Finder (networked instruments only).
- Access the Filer
- Press D to change the directory to /sys/open
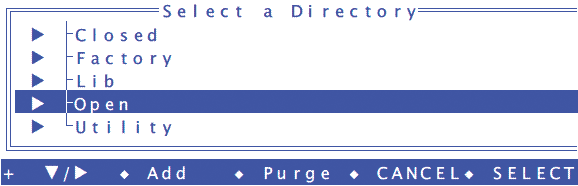
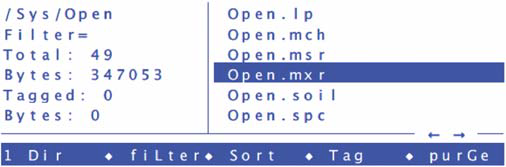
- Using the arrow keys, highlight the file Open.mxr.
- Press E to edit.
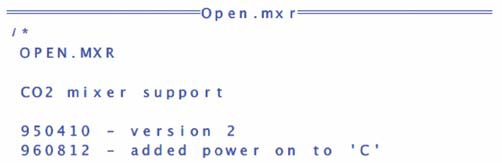
- Press end and then pgup 23 times to locate the section of the file to be edited.
- Change:
-
- PUB mixerSignalOrig[8] to PUB mixerSignalOrig[10]
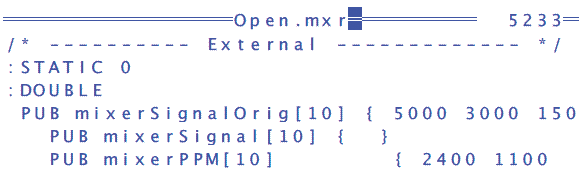
- PUB mixerPPM[8] to PUB mixerPPM[10]
- Add 50 and 0 to the end of PUB mixerSignalOrig to get PUBmixerSignalOrig[10]{ 5000 3000 1500 1000 500 300 200 100 50 0}
- Add 15 and 0 to the end of PUB mixerPPM[10] to get PUB mixerPPM[10] { 2400 1100 450 270 120 70 50 30 15 0}
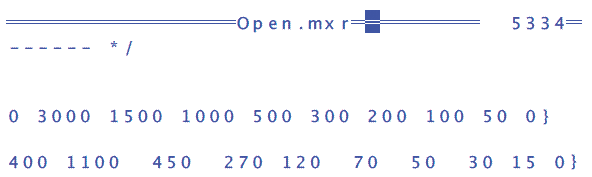
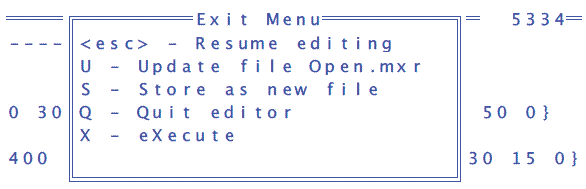
- Press Escape, then U for update, and Q for quit.
- Restart instrument by powering off and then on.
Nuances and limitations of the modification
CO2 mixer setpoints altered
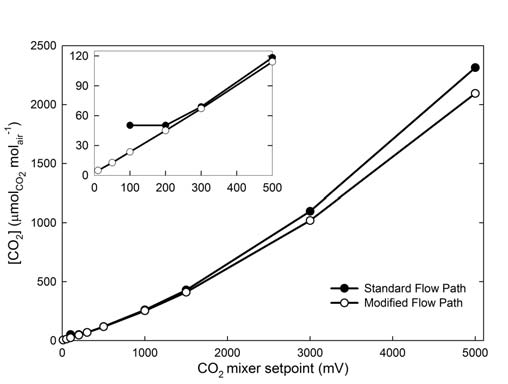
The flow path modification imposes some limitations to the LI-6400/LI-6400XT systems that must be considered when making measurements. Placing the CO2 mixer on the positive pressure side of the pump forces injection of CO2 against the pump pressure decreasing the CO2 concentration at all settings by about 10% (Figure 1‑2). For most LI-6400/LI-6400XT instruments, the maximum attainable CO2 concentration typically will be > 2000 μmol mol-1.
The response time of the CO2 mixer increases slightly (Table 1‑1), but is still rapid enough for survey-style measurements to be taken in approximately 90 - 120 seconds. The adjustment times from a higher concentration to a lower concentration are the same (data not shown) because they are controlled by system flow rate and not the CO2 mixer. Even at the lower CO2-mixer set points, the moment-to-moment noise is similar to that in the standard flow path. Across the range of CO2 set points, the CO2 concentration variance resulting from CO2 mixer is comparable for the standard and modified flow paths (Table 1‑1).
| Response metric for CO2 mixer | Standard flow path | Modified flow path |
|---|---|---|
| Minimum CO2 set point (ppm) | 50.6 | 1-2 |
| Maximum CO2 achieved (ppm) | 2328.3 | 2090.8 |
| Noise (60s Std.Dev.) at: Minimum (ppm) | 0.044 | 0.017 |
| 100 (ppm) | 0.053 | 0.080 |
| 400 (ppm) | 0.11 | 0.11 |
| Maximum (ppm) | 0.11 | 0.12 |
| Time to maximum from turned off (not initial pressurizing) (seconds) | 26 | 46 |
| Step time: | ||
| Minimum to Maximum (seconds) | 103 | 132 |
| Minimum to 100 ppm (seconds) | 17 | 52 |
| 100 ppm to 400 ppm (seconds) | 30 | 35 |
Simultaneous flow and CO2 concentration control
The modified system flow does have one major limitation; it hampers the system’s ability to simultaneously control CO2 concentrations and to continuously vary the flow rate. In the LI-6400/LI-6400XT, there are two separate controls of the sample water concentration, the flow and the desiccant scrub position (see Chapter 3, Tour #3 LI-COR, 2008). When configured in the standard flow path, we recommend using the desiccant to coarse adjust the H2O concentration entering the sample chamber. The entering H2O plus the transpired H2O will determine the chamber H2O concentration. As air flows through the sample chamber, longer retention in the chamber allows greater amounts of transpired H2O to be added. The flow rate controls the retention time of the chamber air; greater flow rates flush the chamber faster resulting in the air passing through the chamber picking up less H2O. Conversely, the longer the air remains in the chamber, the greater quantity of H2O that is taken up by each air unit which increases the chamber H2O concentration. The flow rate has a greater control range on the sample chamber H2O concentration than does the entering H2O concentration (do Tour #3, Experiment #1 to prove this, LI-COR, 2008). With the standard flow path, the CO2 mixer will operate independently of the flow to control chamber (or reference) CO2 concentrations at the desired set-point.
When the LI-6400/LI-6400XT flow path is modified for low CO2 concentration control, we recommend only operating on constant flow control because changes to the flow rate result in a momentary change in the pressure at the pump. This transient pressure change momentarily relieves the back pressure that is working against the pure CO2 injection from the CO2 mixer causing a brief spike in CO2 concentration. If the system is operating at a constant flow rate, there will not be any CO2 concentration perturbations. However, flow rate changes cause CO2 concentration to noticeably change. In the automated H2O concentration control, the LI-6400/LI-6400XT uses continuously variable flow to maintain a constant H2O concentration in the sample chamber and subsequently the sample relative humidity (RH%) and vapor pressure deficit of the leaf (VPDl).
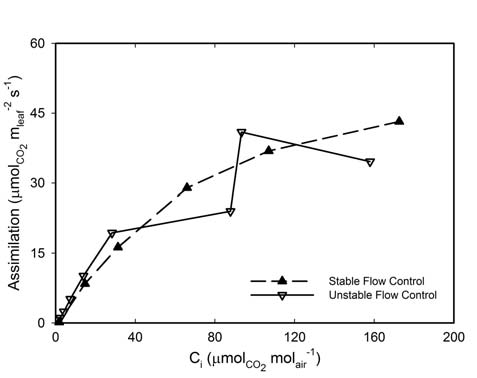
In a modified instrument, every adjustment of the flow rate causes a change in the CO2 concentration, which causes the photosynthetic rate to change, resulting in altered stomatal aperture controlling the gs. The altered gs changes the transpiration rate, which affects the H2O concentration in the chamber resulting in flow rate changes to maintain the requested chamber H2O concentration. This becomes an endless loop of change and subsequent adjustment making measurements impossible as seen in the measured CO2 response curve for Zea mays (Figure 1‑3). A leaf was measured with the standard flow path and using the automated flow control to maintain H2OS constant. The system flow path was modified and the same leaf was measured again using the automated flow control. As the CO2 concentration in the chamber changed, the resulting increased Ci caused the stomata to begin responding. This began the feedback loop described and resulted in the unstable calculated rates of photosynthesis.
Diffusion at low CO2 concentration
The most common use of low CO2 concentration control will be to measure the photosynthetic response to CO2 concentration in C4 plants. Typically these measurements will be at CO2 concentrations that are much different than ambient. The large concentration differences drive diffusional fluxes that can be a significant error in the measured photosynthesis rate. When the chamber CO2 concentration is controlled at a low set point, the diffusion flux is into the chamber countering the net removal of CO2 by leaf photosynthesis. This effectively decreases the calculated photosynthesis and can be a large error in the measurement (Flexas et al., 2007, Rodeghiero et al., 2007, Long and Bernacchi, 2003, LI-COR, 2008). At the low CO2 concentrations that result in a large diffusional flux, the photosynthetic rates are often very low compounding the error effect (LI-COR, 2008). Fortunately, there are methods for correcting the calculated rate of photosynthesis including a method for calculating a diffusion correction (see LI-COR, 2008). When measuring at low CO2 concentrations, the effects of diffusion become proportionally larger errors in the photosynthetic measurements. Fortunately, the errors can be accounted for and corrected. Each user will have to determine the impact that the diffusion may have on their experiments.
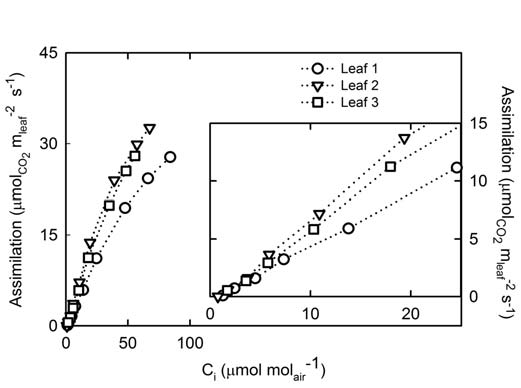
The photosynthetic response to CO2 concentrations was measured on three Zea mays leaves for chamber CO2 concentrations < 400 μmol mol-1 (Figure 1‑4). Glasshouse grown plants in 13 L pots of MiracleGro® potting mix were measured at approximately growth stage V5. Leaves were acclimated to 1900 μmol m-2 s-1 light, approximately 380 μmol mol-1 in the sample chamber, 29 °C, and relative humidity ranging between 60 - 75 %. An autoprogram was used to change the reference CO2 stepwise from 400 to 0 μmol mol-1.
With the low CO2 modification, the LI-6400/LI-6400XT measured was able to measure numerous points < 20 μmol mol-1 Ci.
Bibliography
| 1 | Flexas, J., Diaz-Espejo, A., Berry, J. A., Cifre, J., Galmes, J., Kaldenhoff, R., Medrano, H. & Ribas-Carbo, M. (2007) Analysis of leakage in IRGA’s leaf chambers of open gas exchange systems: quantification and its effects in photosynthesis parameterization. Journal of Experimental Botany, 58, 1533-1543. |
| 2 | Lambers, H., Chapin III, F. S. & Pons, T. L. (2006) Plant Physiological Ecology. Springer Science+Business Media, LLC, New York. |
| 3 | LI-COR, I. (2008) Using the LI-6400/LI-6400XT Portable Photosynthesis System. LI-COR, Inc., Lincoln, NE, USA. |
| 4 | Long, S. P. & Bernacchi, C. J. (2003) Gas exchange measurements, what can they tell us about the underlying limitations to photosynthesis? Procedures and sources of error. Journal of Experimental Botany, 54 (392): 2393-2401. |
| 5 | Rodeghiero, M., Niinemets, Ü. & Cescatti, A. (2007) Major diffusion leaks of clamp-on leaf cuvettes still unaccounted: How erroneous are the estimates of Farquhar et al. model parameters? Plant, Cell and Environment, 30, 1006-1022. |
| 6 | von Caemmerer, S. (2000) Biochemical Models of Leaf Photosynthesis. Techniques in Plant Science. CSIRO Publishing, Collingwood, VIC, Australia. |