
Useful Information
The Diagnostic Text Display
(This display configuration is still around for historical purposes. Don’t confuse this display map with the Diagnostic Screens A through G.)
One of OPEN’s default displays is named Diagnostic (Figure 20‑22). This display can be useful when trouble shooting, as it contains all of the raw input signals, in addition to the standard computed variables.
To enable this display, Quik Pik (f1 level 6) in New Measurements mode.

The quantities in levels a, c, d, f, and j are common system variables, also found in the standard display list. Levels b, e, and g contain the raw signals (mV) for the sensors.
User Channel Voltages
The spare analog input channels are shown in level i. These will show 0 mV if they have not been enabled via the ‘UserChan=’ configuration command.
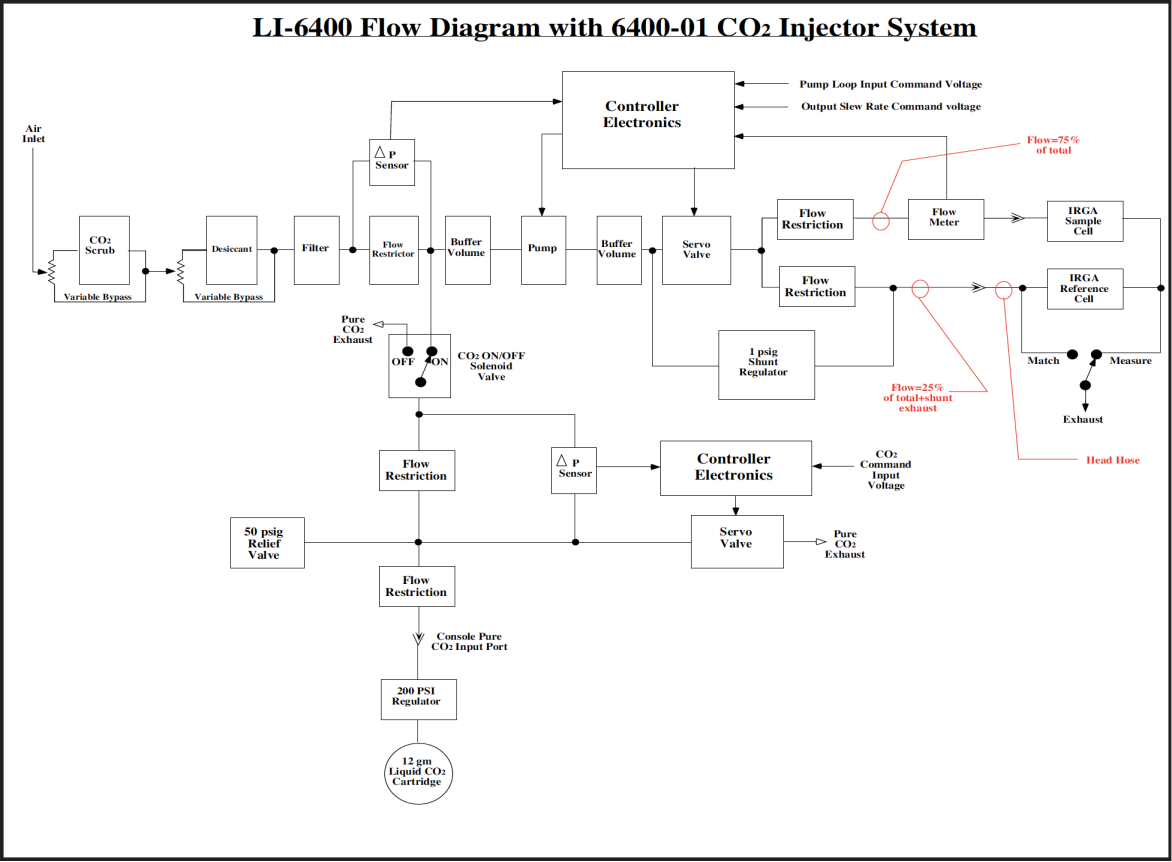
System Flow Schematic
Figure 20‑23 provides a schematic of the flow components of the LI-6400.
Chamber Connectors
The chamber cable has a 25-pin D-connector on the console end, and a 26-pin D-connector on the chamber end (Table 20‑2).
| Connector | |||
|---|---|---|---|
| Description | 26 Pin D Chamber | 25 Pin D Console | Comments |
| BlockTemp1 | 22 | 1 | |
| BlockTemp2 | 10 | 3 | |
| AirTemp1 | 21 | 14 | |
| AirTemp2 | 11 | 16 | |
| Match+ | 23 | 2 | |
| Match- | 24 | 15 | |
| Circ fan + | 26 | 19 | A normal fan motor has an impedance of 63 Ohms. |
| Circ fan - | 25 | 7 | |
| Tleaf | 14 | 4 | |
| Log | 1 | 25 | |
| +10V | 7 | 11 | |
| -9V | 6 | 24 | |
| Signal Gnd | 8 | 12 | |
| Power Gnd | 9 | 13 | |
| PAROut | 18 | 5 | |
| PARIn | 15 | 17 | |
| TEC1+ | 4, 5 | 10, 23 | |
| TEC- | 2, 3 | 9, 22 | |
| +12V | 17 | 8 | |
| TEC Fan | 13 | 21 | |
| Lamp+ | 19 | 18 | Warning: voltages can exceed 100V |
| Lamp- | 20 | 6 | |
| Lamp Fan | 16 | 20 | |