Light transfer and reported light intensities
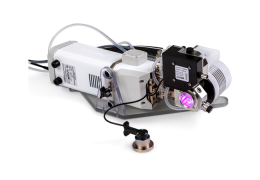
The aquatic chamber has an attachment for placing LI-COR LI-190R Quantum Sensor on the viewing window, to measure how much light is getting through the sample. The measurement can be used to estimate the absorbed quanta relative to a clear water sample, as shown in the following deviation.
Qf is the flux of photons (µmol m-2 s-1) from the fluorometer incident on the window of the sample cell (Figure 10‑19), and Qexit is the flux leaving the opposite window. The windows (when clean) each have a transmittance g of 0.981.
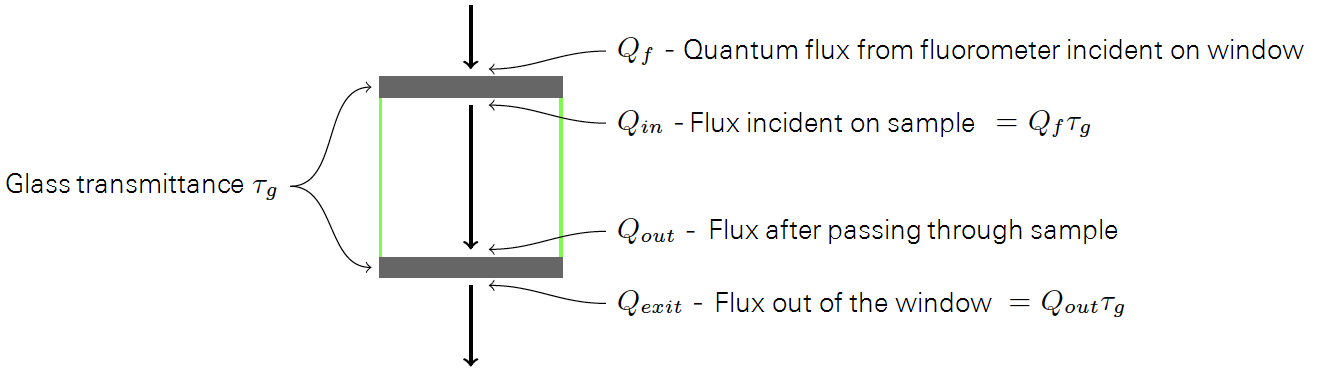
What are the "knowns"? On the fluorometer side, we know Qf , what the fluorometer is generating. If window transmittance τg is specified, then we actually have Qin reported directly, since the fluorometer takes transmittance into account when setting light levels.
There is a subtlety here: The fluorometer is calibrated with a 6 cm2 aperture, but when used with the aquatic chamber, the aperture is 7.92 cm2. If the fluorometer's light output were perfectly uniform, then increased area would not change the irradiance, since it is on a per area basis. However, the light output is brightest near the edges, and the area increase results in about 20% more light output than expected. This is accounted for in the transmittance factor of 1.18 that is applied when using the aquatic chamber, which includes the window transmittance of 0.98. For example, if you set the fluorometer to 1000 µmol m-2 s-1, it will actually set itself to 1000 / 1.18 = 847 (according to its 6 cm-2 based calibration), The actual output is some 20% higher (1020), which reduces to the 1000 you asked for when it passes through the window into the aquatic chamber.
Outside the opposite window is a quantum sensor reading q, from which we can estimate Qexit. To do this, we must account for calibration differences (due to light spectra, field of view, etc.) between the fluorometer and the particular sensor being used. This difference depends on color (red and blue fractions fr and fb), so we use an empirically determined adjustment factor for each, ar and ab. These are measured using a dry, empty aquatic chamber with a procedure described below. It is assumed we know the effective transmittance of light through a dry, empty chamber. This has been measured using a fluorometer and an integrating sphere to collect the light. For red, the value is 0.54, and for blue, it is 0.51.
Once ar and ab are known, we can now get Qexit and Qout from q:
10‑72

10‑73

The cell transmittance (τ) is computed from

If the sample cell were a perfect "light pipe", the transmittance would be 1.0 when the cell is empty. In reality, it is closer to 0.5, because of light losses to interior surfaces; filling the sample cell with clear water actually increases the transmittance slightly. Since what is of interest is how many photons are being absorbed in the algal sample, we can use an empirically determined clear-water transmittance (τw), as a reference, and compute a transmittance (and absorptance) relative to that.
With clean water in the sample cell, we use equation 10‑74 to get an expression for clean water transmittance τw:
10‑75

Since red and blue are scattered slightly differently in the cell, the determination of w should actually be done twice: once for red light (fr = 1) yielding wr, and once for blue fb = 1, yielding wb. Typical values are wr = 0.58 and wb = 0.57. Then, for any mix of fr and fb, the appropriate color-weighted water transmittance (w) is
10‑76

With an algal sample in place, we again use equation 10‑74 to write the expression for transmittance τs through that sample:
10‑77

Given these two transmittances, we can compute2 the average light intensity within the sample cell, and the portion of it that is absorbed by the algae. To do this we assume light extinction in the sample cell is a Beer's law process. For water
10‑78

and for water plus algae
10‑79

where ϵw and ϵs are extinction coefficients, and d is the optical depth (arbitrary, because it cancels out in the final equations).
The extinction coefficient for algae by itself is then
10‑80

The average light intensity (Qavg) in the sample cell is

10‑81


The light absorbed by just the algae (Qabs) within the sample cell is

10‑82


The rate  (in mol s-1) at which photons are being absorbed by the algae is.
10‑83

where Sw = 7.92× 10⁻⁴, the area (m2) of the aquatic chamber's window that faces the fluorometer.
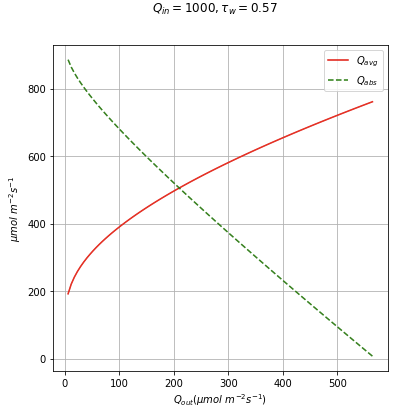
Figure 10‑20 illustrates how Qavg and Qabs change with Qout for a fixed Qin.
We have neglected the effect of the pump and resulting bubbles in the analysis up to now, but bubbles have a significant effect, typically reducing measured Q values (and thus computed sample and water values) by a factor of 0.7 to 0.8. To handle this effect, we introduce one more empirical constant B, which is simply
10‑84

where Q|on is the external quantum sensor reading with the circulation pump on, and Q|off when it is off.
We apply B when computing the effective clear water transmittance, which is now corrected for color and bubble effect:
10‑85

Implementation details
The aquatic light measurements and computations described above are contained in the AquaticQ group, and can be viewed in the Measurements screen (Figure 10‑21).
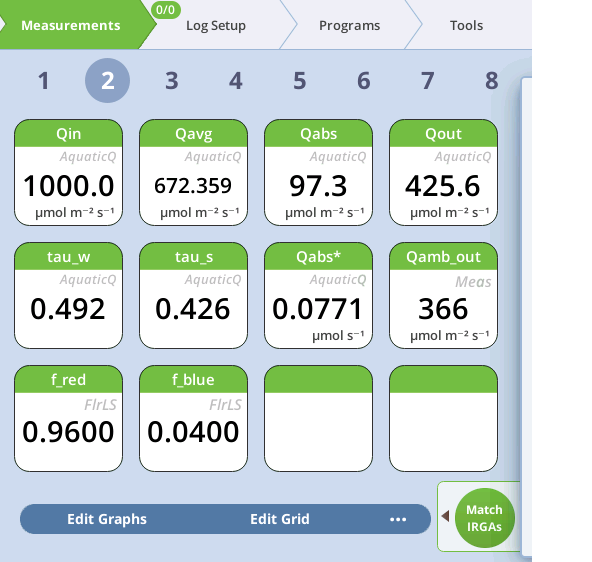
The sources of the parameters used in the above computations are shown in Table 10‑2. The five empirical constants (ar; ab; wr; wb; B) are accessible on Constants > Aquatic Chamber, but more typically are set using the calibration screen (see Setting the light calibrations). In the fluorescence computations (group = Flr), the computations are the same, but some labels and units change. With the aquatic chamber, the "non-basis" Flux value from GasEx is used for "assimilation", and the quantum flow value Q*abs is used for "absorbed" light. This allows a computation of PhiCO2, and changes the units of ETR as shown in the table.
Setting the light calibrations
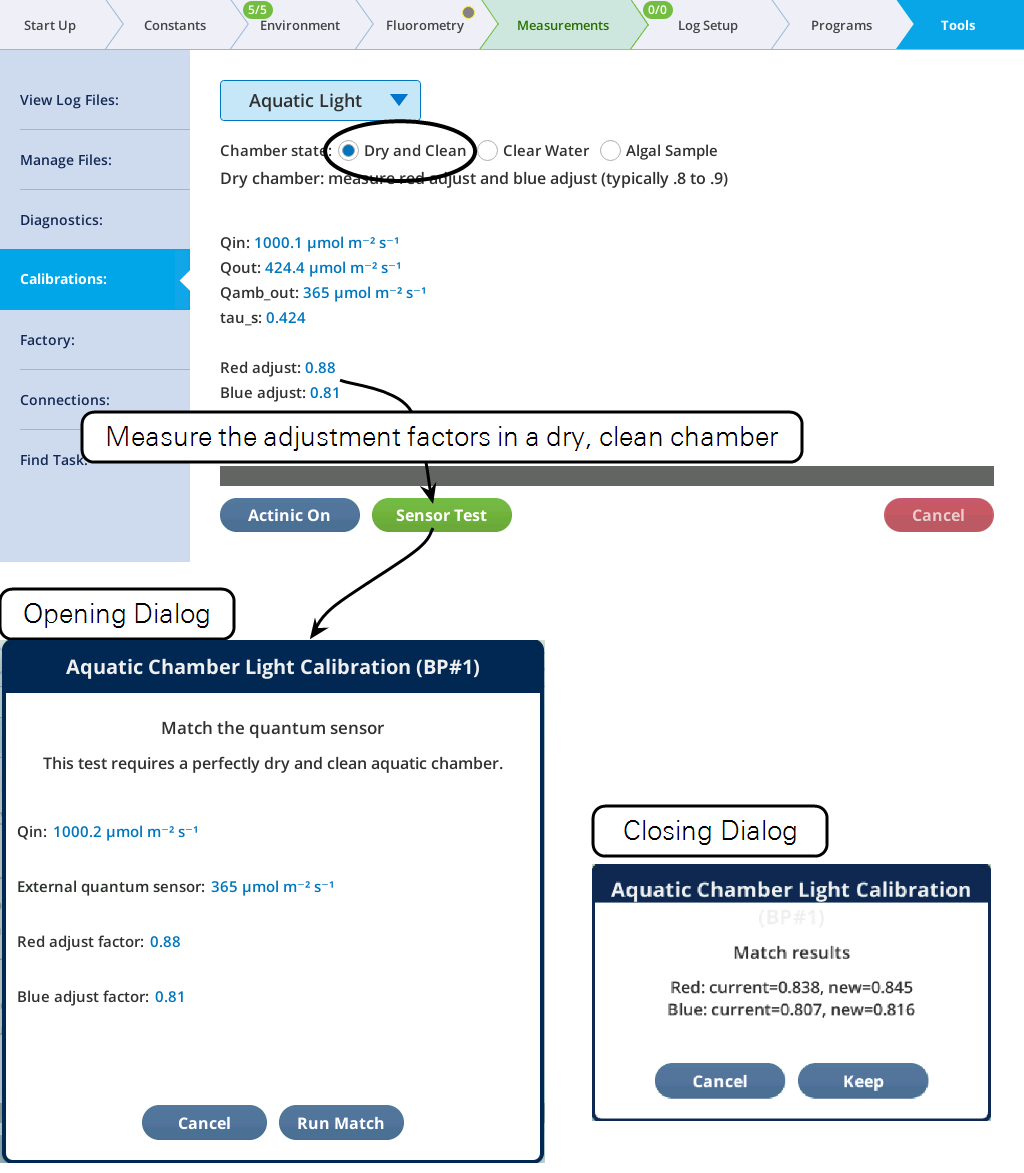
A calibration page is provided for determining the five constants required to compute absorbed light in the aquatic chamber (Figure 10‑22). All of these procedures require the external quantum sensor to be mounted on the viewing window of the aquatic chamber.
The chamber state determines which factors can be measured. The first, Dry and Clean, is used to measure the adjustment factors for a particular quantum sensor. This need be done only once for a particular sensor.
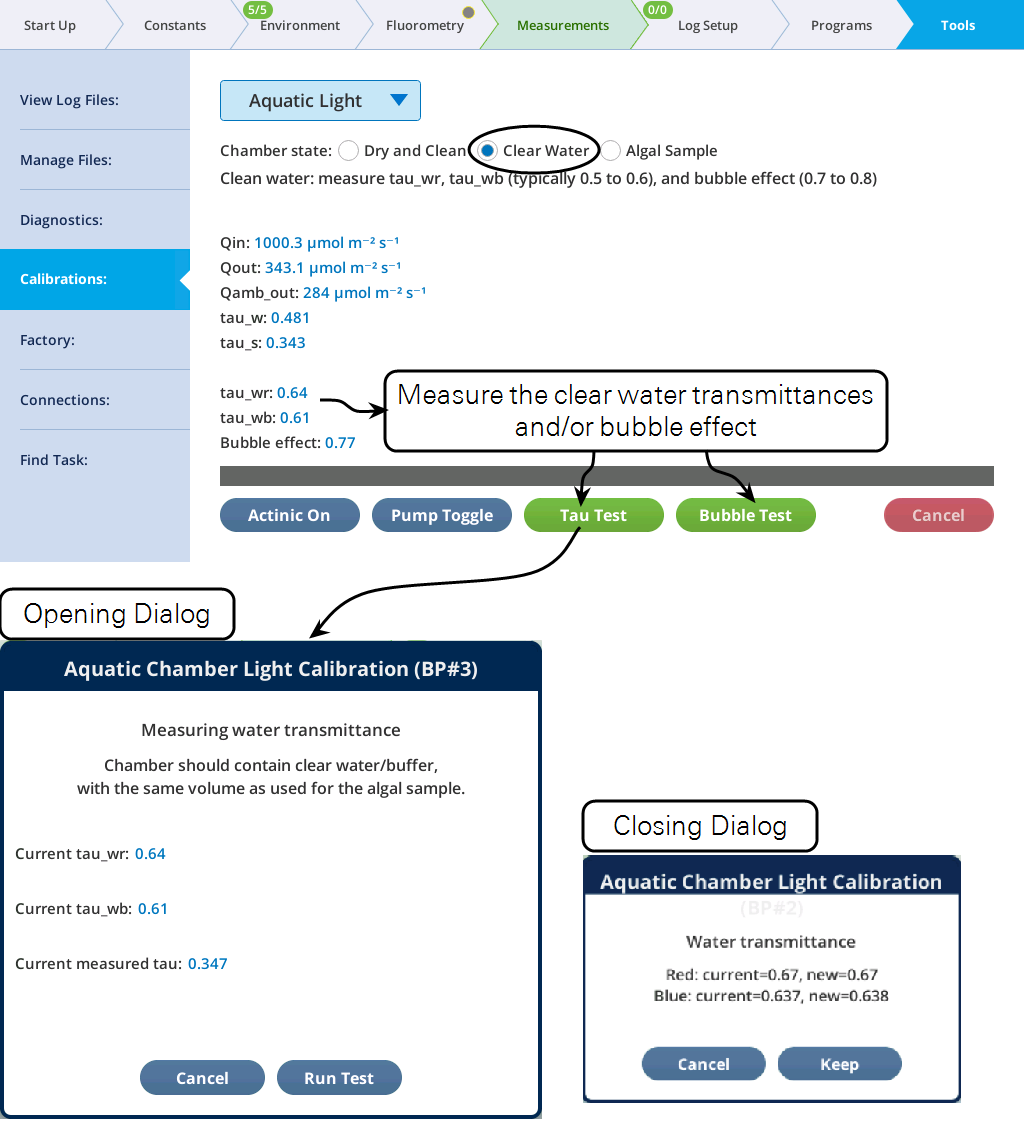
With the chamber filled with clean fresh media, the red and blue chamber water transmittances can be measured (Figure 10‑23). The transmittance of a wet chamber depends strongly on the volume of liquid in the chamber. When measuring wr and wb, be sure to use the same volume as you intend to use with algal samples.
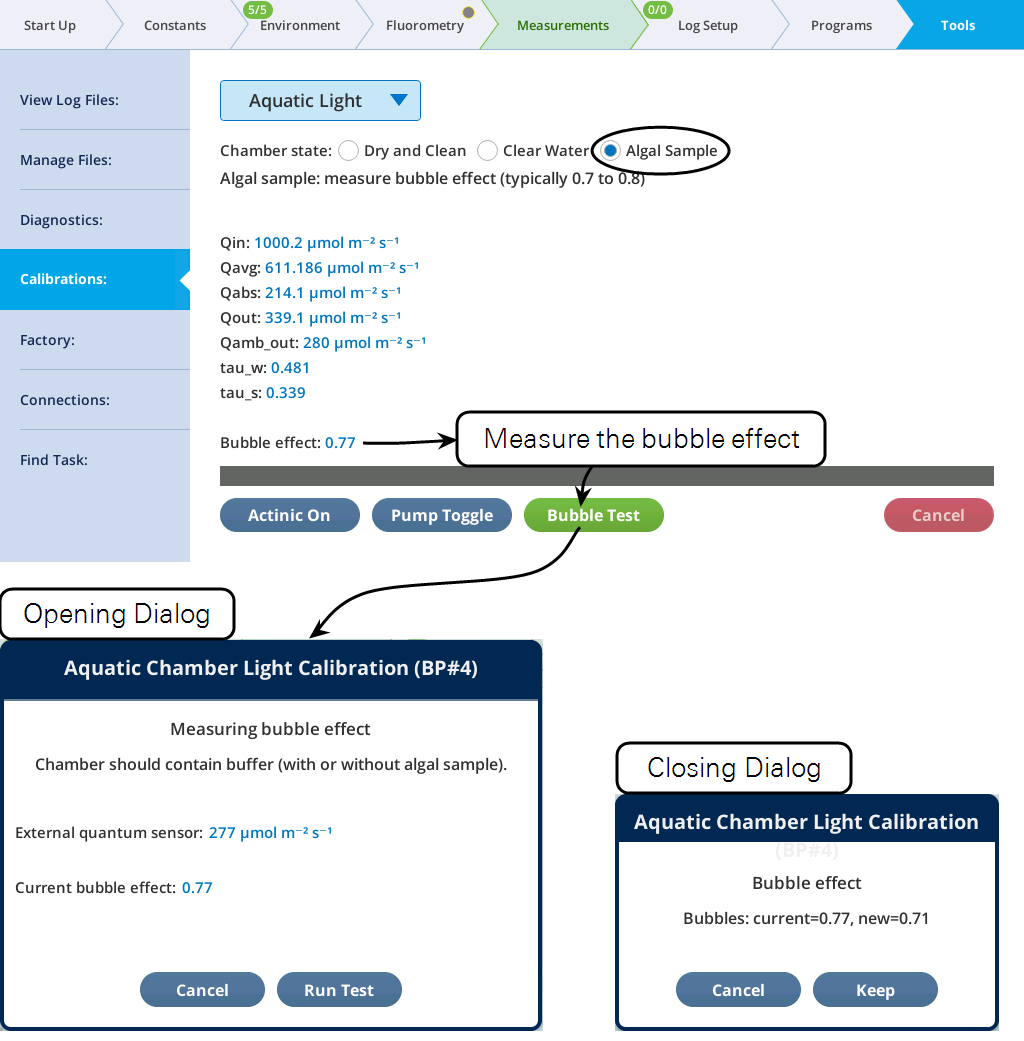
With the chamber filled with an algal sample, the only calibration that can be done is for the bubble effect (Figure 10‑24).