
The FlashAnalysis application
FlashAnalysis is a tool that displays LI-600, LI-6400/XT, and LI-6800 flash data. The main goal of the software is to optimize the flash protocol. The program also provides tools to summarize and export data of interest.
Full operating information and downloads are in the tech tip.
Importing data files
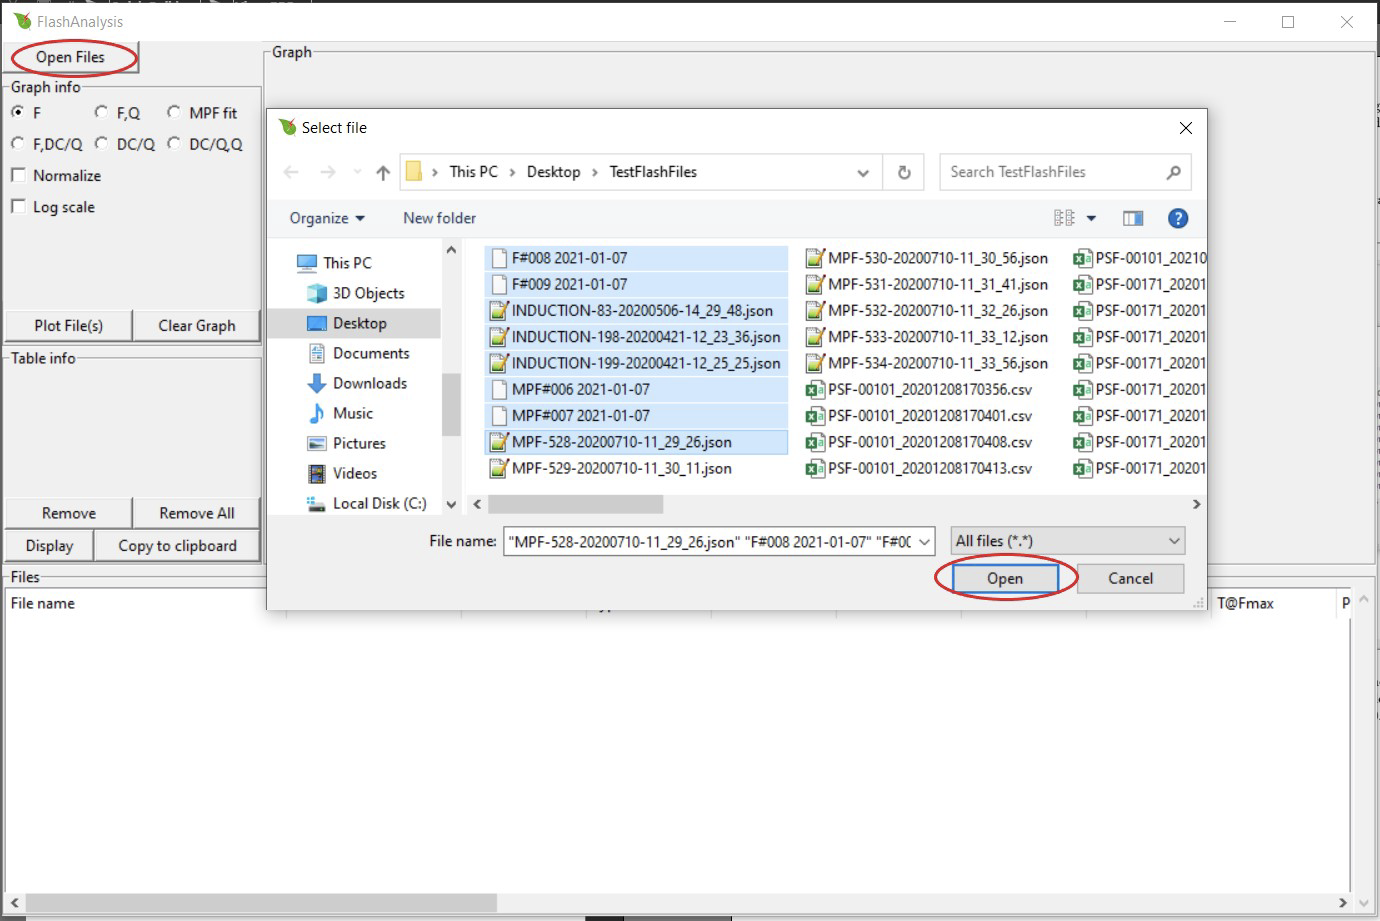
Import data by clicking Open Files. Select one or more files then press Open. The default file type is 'All' but the you choose to view the LI-6800 (.json) or LI-600 (.csv) file format from the menu (Windows OS only).
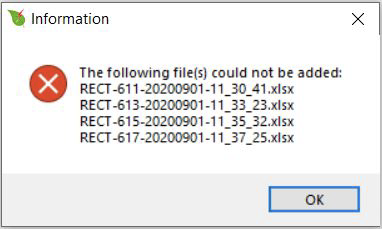
If a file is of a different extension or does not contain flash data, you will see an error message. The error message box shows a list of the files that the program was not able to open. This error could also arise with a flash file collected without a leaf in the chamber and where Fmin (or Fmax) is rounded to 0.
Importing data from the LI-6800
Using Windows Explorer
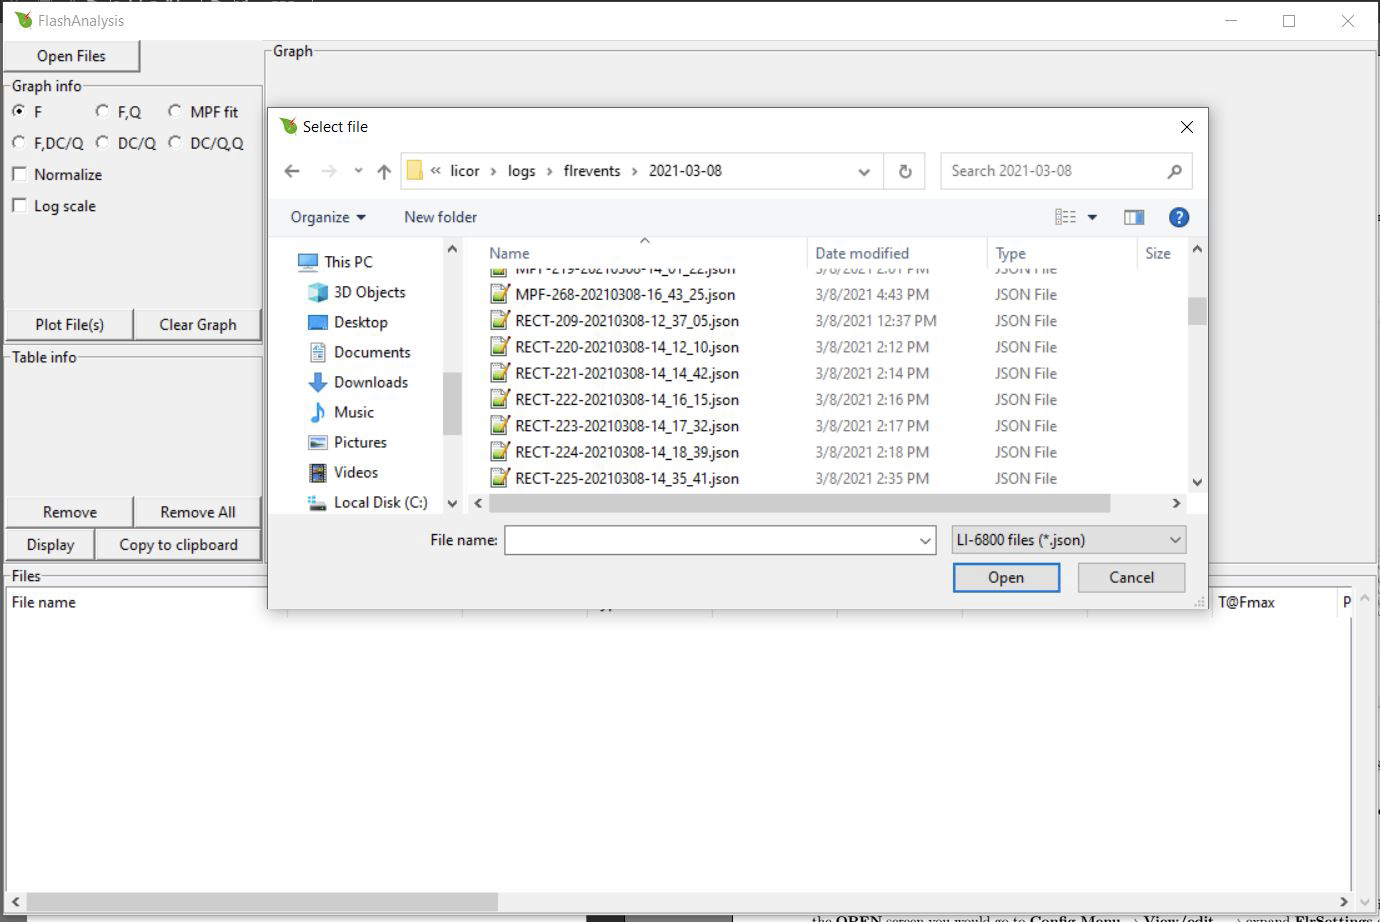
FlashAnalysis can import data directly from the LI-6800 if the LI-6800 is connected to the same network as your computer. To open the files this way, click Open Files and in the file path box type two backslashes followed by your LI-6800 console's serial number: \\68C-XXXXXX. If this does not work, try \\68C-XXXXXX.local..
Your flash files will be located in licor\logs\flrevents\.
Using USB
You can also export flash files from the LI-6800 using a USB drive. Insert the USB into your LI-6800 and go to Tools > Manage Files > USB and select Copy files to USB.
Using the FlashAnalysis application
Changing displayed variables
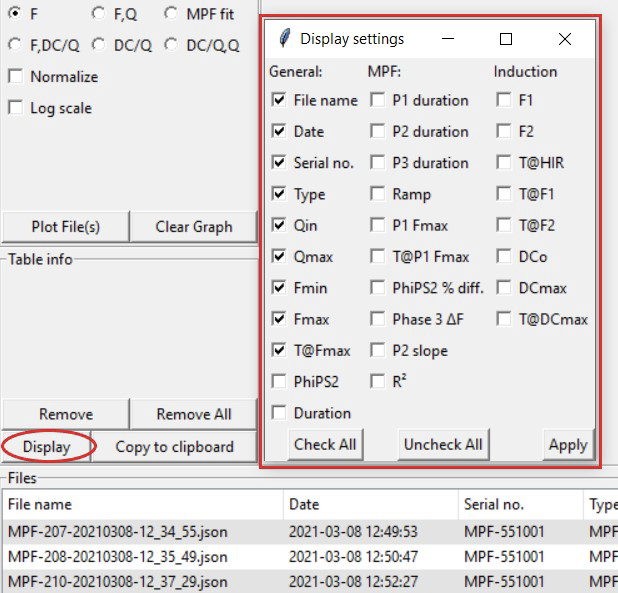
Change or add displayed columns by clicking the Display button located under Table info. A new window will open up allowing the user to check and clear variables they want displayed. Click Apply to save the changes.
Plotting data
Files can be plotted either by double clicking on the file in the table or by highlighting one or several rows then clicking Plot File(s) under Graph info. Rows in bold font indicate that the file is plotted on the graph. A double click on a bold font row removes the file from the plot. Clear the graph by clicking Clear Graph.
Graphing options
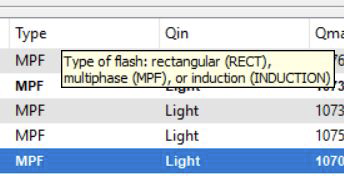
You can modify what is graphed by using the radio buttons under Graph info. Note that any file that does not have the relevant information will be hidden, e.g. plotted rectangular flash data will be hidden for the MPF fit.
- F: plots demodulated fluorescence (F) vs. time
- F,Q: plots demodulated fluorescence (F) vs. time on the left y-axis and actinic light (Q) vs. time on the right y-axis
- MPF fit: plots demodulated phase 2 fluorescence (F) vs. 104/Q
- F,DC/Q: plots demodulated fluorescence (F) vs. time on the left y-axis and raw fluorescence per quanta of actinic light (DC/Q) vs. time on the right y-axis
- DC/Q: plots raw fluorescence per quanta of actinic light (DC/Q) vs. time
- DC/Q,Q: plots raw fluorescence per quanta of actinic light (DC/Q) vs. time on the left y-axis and actinic light (Q) vs. time on the left y-axis
Below the radio buttons, there are two check buttons that allow you to modify how the data is being displayed on the graphs (not available when MPF fit is selected):
- Normalize: normalizes the data to its maximal value. Useful for comparing flash data of different magnitudes (e.g. LI-600 vs. LI-6800 files)
- Log scale: changes the x-axis to log scale. Useful for plotting induction flashes.
The graph itself comes with some useful tools:

Use zoom ( ) to zoom in, use home (
 ) to reset the view, and click save (
 ) to save the graph as a .png.
Removing data
Click Remove to remove highlighted file(s). Click Remove All to remove all files.
Exporting data
To export the variables you are interested in, make sure they are selected as columns, then highlight the rows (files) you want to export and click Copy to clipboard.
Example analysis
Section 27-40, Using the MultiPhase Flash > Making Measurements in the LI-6400/XT manual and a section in the LI-6800 manual has details on what to look for in both a rectangular and MPF flash to collect the best data.
In the following example we show six rectangular flashes collected with the LI-6800. To make easier comparisons between the flashes we have normalized the data and zoomed in on the top 2.5%:
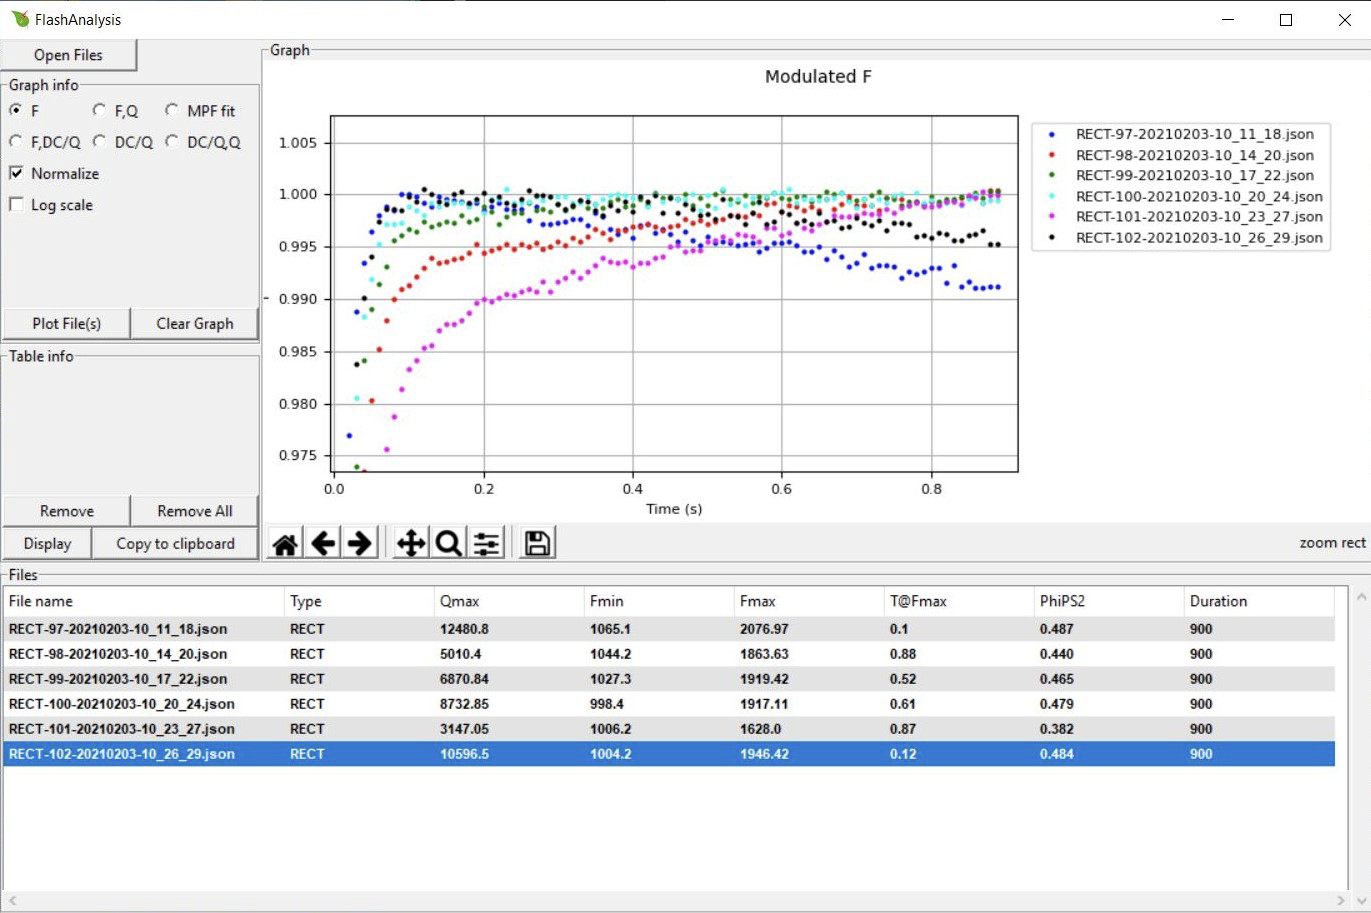
The plot above leads to the following conclusions:
- The highest flash intensity (Qmax) yields the highest Fmax (RECT-97). One might increase the flash intensity to see if it would cause a higher Fmax, but since fluorescence is decreasing over time (dark blue dots) indicating flash-induced quenching, one might consider implementing an MPF.
- The two lowest flash intensities (RECT-101 and RECT-98), never reach saturation. We can tell this from the continuous rise in fluorescence and the two flashes’ T@Fmax parameters, which both are close to the total duration. This is not simply a duration issue, since higher intensities (e.g., RECT-99 and RECT-100) do flatten out (fully close PSII reactions centers).
- RECT-100 at a Qmax of 8,700 μmol m-2 s-1 gave the most steady fluorescence. It reached saturation quickly and stayed there throughout the flash. Fmax occurred at about 0.6 s (T@Fmax). A shorter flash could therefor be used, somewhere around 650 to 700 ms would be sufficient.
- These data suggest an MPF with a flash intensity of about 8,500 μmol m-2 s-1. Since fluorescence stayed steady under the flash, a starting phase 1 duration of 300 ms should be fine.
- If using an MPF, further optimization might be needed to find optimal phase 2 and 3 durations.
FlashAnalysis Definitions
Table 8‑11 shows the variables that are measured by each instrument.