
Leaf-level O2 and CO2 measurements with the LI-6800 and Picarro G2207-i
Printable PDF: Leaf-level O2 and CO2 measurements with the LI-6800 and Picarro G2207-i
(6800_Note-Oxygen-Measurements_17744)
Download this content as a pdf that can be saved to your computer or printed.
The LI-6800 Portable Photosynthesis System probes the carbon fixation reactions of photosynthesis by calculating fluxes for CO2 (Assimilation) from the difference in measured concentrations of CO2 and H2O entering and exiting a leaf cuvette. With the 6800-01A Multiphase Flash Fluorometer, additional information on the light reactions of photosynthesis, including quantum yield of photosystem II (ΦPSII) and electron transport rate (J) can also be calculated. The source of electrons for redox reactions in the chloroplast is H2O, resulting in the evolution of Oxygen (O2). While the general stoichiometry of these reactions is 1 mol O2 evolved per mol CO2 fixed (von Caemmerer 2000), net fluxes of O2 can depend on environmental conditions, as O2 is produced solely during the light reactions, but can be consumed by at least three separate reactions (Canvin et al., 1980). Simultaneous measurements of O2 exchange, CO2 exchange and chlorophyll fluorescence can provide unique information regarding leaf biochemistry.
Oxygen concentrations in the atmosphere are two to three orders of magnitude larger than CO2, yet the leaf fluxes are similar in magnitude. Significant challenges occur when measuring small changes in O2 concentration on a large nominal background concentration, resulting in potentially larger errors in the O2 fluxes relative to the CO2 fluxes. With proper attention to the setup and signal averaging, physiologically significant data can be collected.
Here we describe measurements using a Picarro G2207-i O2 gas concentration analyzer coupled to the LI-6800 Portable Photosynthesis System to quantify both CO2 and O2 fluxes using the 9968-210 subsample kit. Best practices for plumbing the instruments together, correction for dilution by foreign gases, and calculation of O2 fluxes are discussed. A discussion of relative uncertainties between CO2 and O2 fluxes and a few example data-sets are also included.
Plumbing
The first consideration for an open flow-through gas exchange measurement should be the concentration stability of the air supply to the measurement cuvette, in this case the air source supplied via the LI-6800 console. In the open atmosphere O2 concentration is fairly constant over the short-term, but can vary significantly inside a poorly ventilated lab space. In order to achieve a constant reference O2 concentration, a source of constant O2 is preferred. For the measurements described here, we used a tank of CO2-free compressed air (N2/O2 mix) supplied to the LI-6800 console.
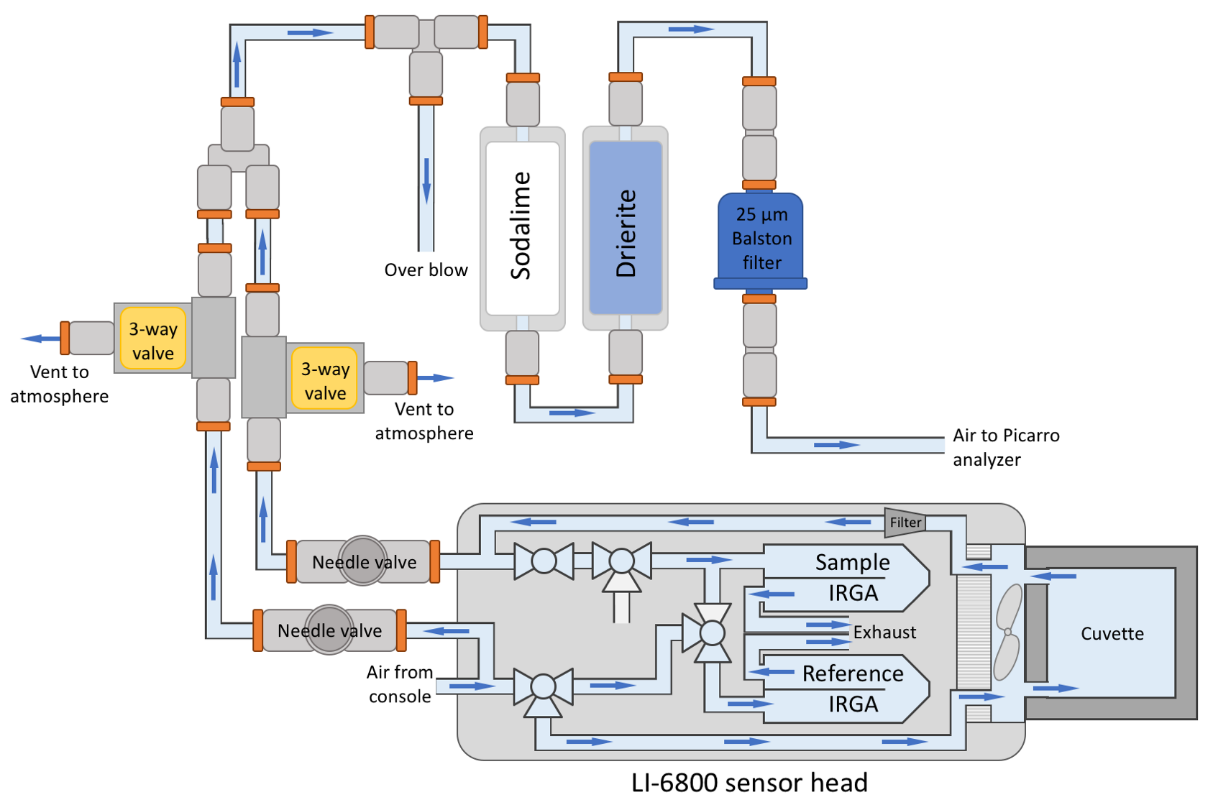
A recommended plumbing configuration for the LI-6800 and G2207-i is shown in Figure 1‑1. To supply sample air to the G2207-i, the LI-6800 provides subsample outlets on both the reference and sample air streams. In the G2207-i, these sample and reference air streams must be sequentially sampled. A needle valve is placed on each of the lines to maintain constant, controlled airflow from the subsample ports. Due to the comparatively low flow rate of the G2207-i (80-110 sccm or 50 – 75 µmol s-1), diverting 100 μmol s-1 from each channel is sufficient for the O2 measurements. Continuous flow from each line even when not being sampled helps to minimize dead volumes and keep the air-lines purged. The flow meters at the exhaust ports of the LI-6800 gas analyzers can be used to adjust the needle valve on each subsample line to ensure the proper flow rate. Initial setup of the flow can be done by closing the reference or sample needle valve and monitoring the respective IRGA exhaust flow meter. Then the needle valve can be opened until 100 μmol s-1 is being diverted. This flow rate should be continuously monitored throughout the experiments.
By continuously venting the output of both reference and sample air streams, there will be minimal dead volumes present in the system. On the G2207-i side of the valve, it is necessary to include an open split, as the LI-6800 airstream will supply a larger flow rate than required by the G2207-i. The open flow split and identical flow rate in the two airstreams is important for the G2207-i. the G2207-i’s vacuum pump acts to maintain cavity pressure by adjusting flow through the system. A change in flow rate through the G2207-i will cause pressure changes up-stream including scrub tubes present in the flow path. Both H2O and CO2 should be removed from the airstream (see Box 1 on foreign gas dilution), therefore changes in the pressure can cause differential scrubbing between sample and reference lines. In our experiments, the pressure effect was on the order of 30 – 50 ppm H2O (0.03 – 0.05 mmol mol-1), enough to cause significant errors in the O2 measurements (see Appendix A: Foreign Gas Dilution on O2). The order of the scrub tubes is also important. If using soda lime to scrub CO2 and Drierite® to scrub H2O, air should pass through the soda lime first. Soda lime must contain moisture to be effective and releases water vapor as a result. Placing Drierite® before the soda lime will not result in a dry airstream for O2 measurements and will shorten the effective life of the soda lime.
Oxygen Evolution calculations
The flux calculations for O2 evolution will depend upon the scrubbing scheme chosen. We recommend scrubbing H2O at all times, but it is up the you to choose whether or not to scrub CO2. The flux calculation for O2 evolution will depend on what foreign gases are being scrubbed. A full derivation for either scenario is given in Appendix B: Mass balance equations for CO2 and O2 flux calculation. In the case of scrubbing both H2O and CO2 the calculation for O2 evolution (OE) is:
1‑1

Where s is measured leaf area (m2), ui is the flow rate entering the leaf cuvette (mol s-1), OR and OS are the O2 concentrations measured in reference and sample, respectively in ppm, (or mol O2 mol -1).
If scrubbing H2O only, the equation for O2 evolution is:
1‑2

where CR and CS are CO2_r and CO2_s respectively, from the LI-6800. Note that the above equations have been derived to report positive values for O2 evolution and negative values for O2 consumption.
Uncertainty in Calculated Fluxes for CO2 and O2
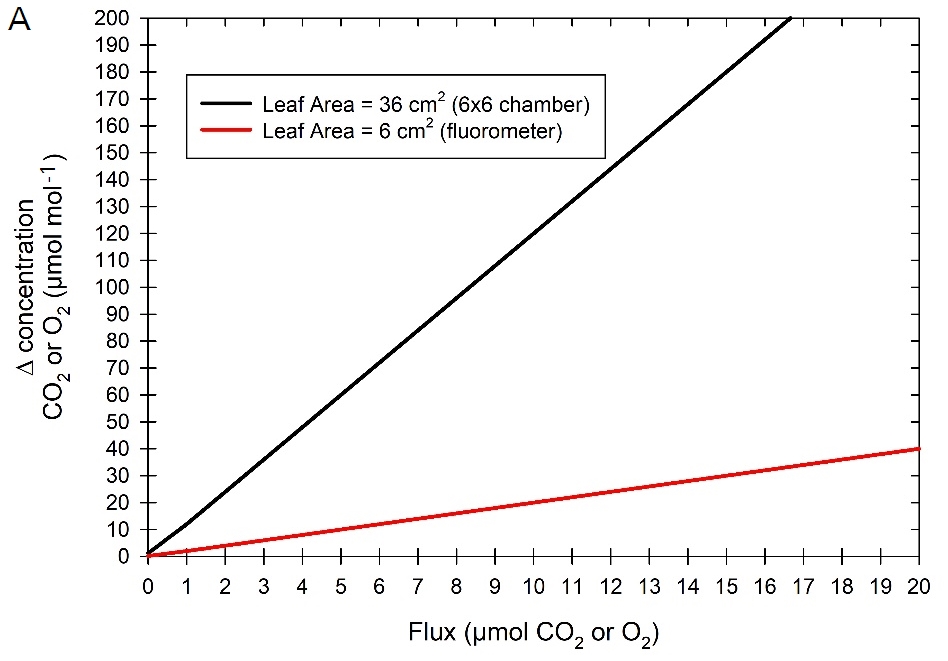
The uncertainty in a differential measurement, as computed from two absolute measurements, is the sum of the uncertainties in each absolute measurement. In general, for leaf-level measurements, the expected Δ in gas concentrations between sample and reference air streams in O2 will be similar to the Δ measured for CO2. For any given flux value, the Δ in concentration is determined by the flow rate to the cuvette and the amount of leaf material being measured. Figure 1‑2A shows the expected Δ as a function of the flux rate for two different cases – the large 6×6 cuvette encompassing 36 cm2 of leaf area, and the fluorometer with 6 cm2 of leaf area. In both scenarios, a cuvette flow rate of 300 μmol s-1 was assumed, to allow 100 μmol s-1 flowing to the O2 analyzer and maintaining 200 μmol s-1 through the LI-6800 sample gas analyzer. For very low fluxes, for example a respiration rate of 1 μmol m-2 s-1, the Δ generated is 2 μmol mol-1 and 12 μmol mol-1 for a leaf area of 6 cm2 and 36 cm2, respectively.
The uncertainty in calculated flux is a function of the uncertainty in the measured Δ between the reference and sample airstreams. Here, we will use the 1-σ standard deviation specification (e.g., 68% confidence interval) provided by the manufacturer (0.1 μmol mol-1 on CO2 for the LI-6800 with 4-second averaging and 2 μmol mol-1 on O2 for the G2207-i at 300 second averaging). The uncertainty in calculated fluxes is calculated as a function of the 1-σ standard deviation and expected Δ. The calculated uncertainty in fluxes is shown in Figure 1‑2B, as % uncertainty from the “true” value. In the case of the fluorometer, with a Δ of 2 μmol mol-1, the uncertainty in CO2 Assimilation in the LI-6800 is 5%, while in the G2207-i it is > 100%. However, when using the larger 6x6 cuvette with a Δ of 12 μmol mol-1, uncertainties decrease for both measurements, <1% for the LI-6800 and < 20% for the G2207-i.
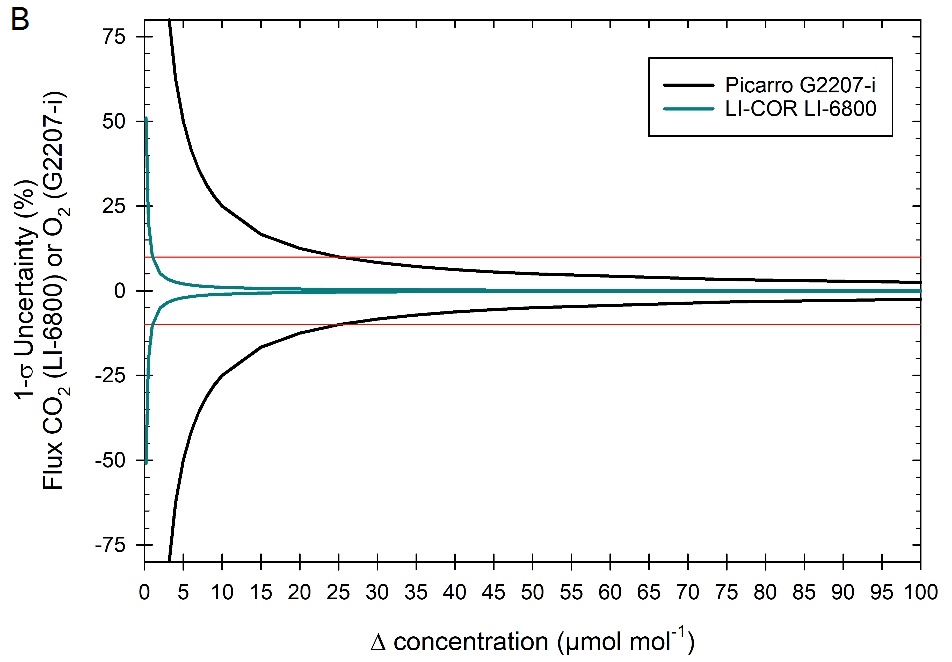
While good measurements can be made using any of the LI-6800 cuvettes, caution should be taken when measuring small leaf areas as the errors in the O2 measurements can become considerable. Best practice is to use the largest leaf area as possible and to operate at low flow rates. This will increase the Δ and reduce uncertainty. Additionally, when leaf area and/or fluxes are small, it is critical to use longer averaging times in the G2207-i (up to 5 minutes) to increase precision.
Example Data
We performed several experiments to validate combined measurements with the LI-6800 and the G2207-i. In order to reduce uncertainties, we used low flow rates and large leaf areas.
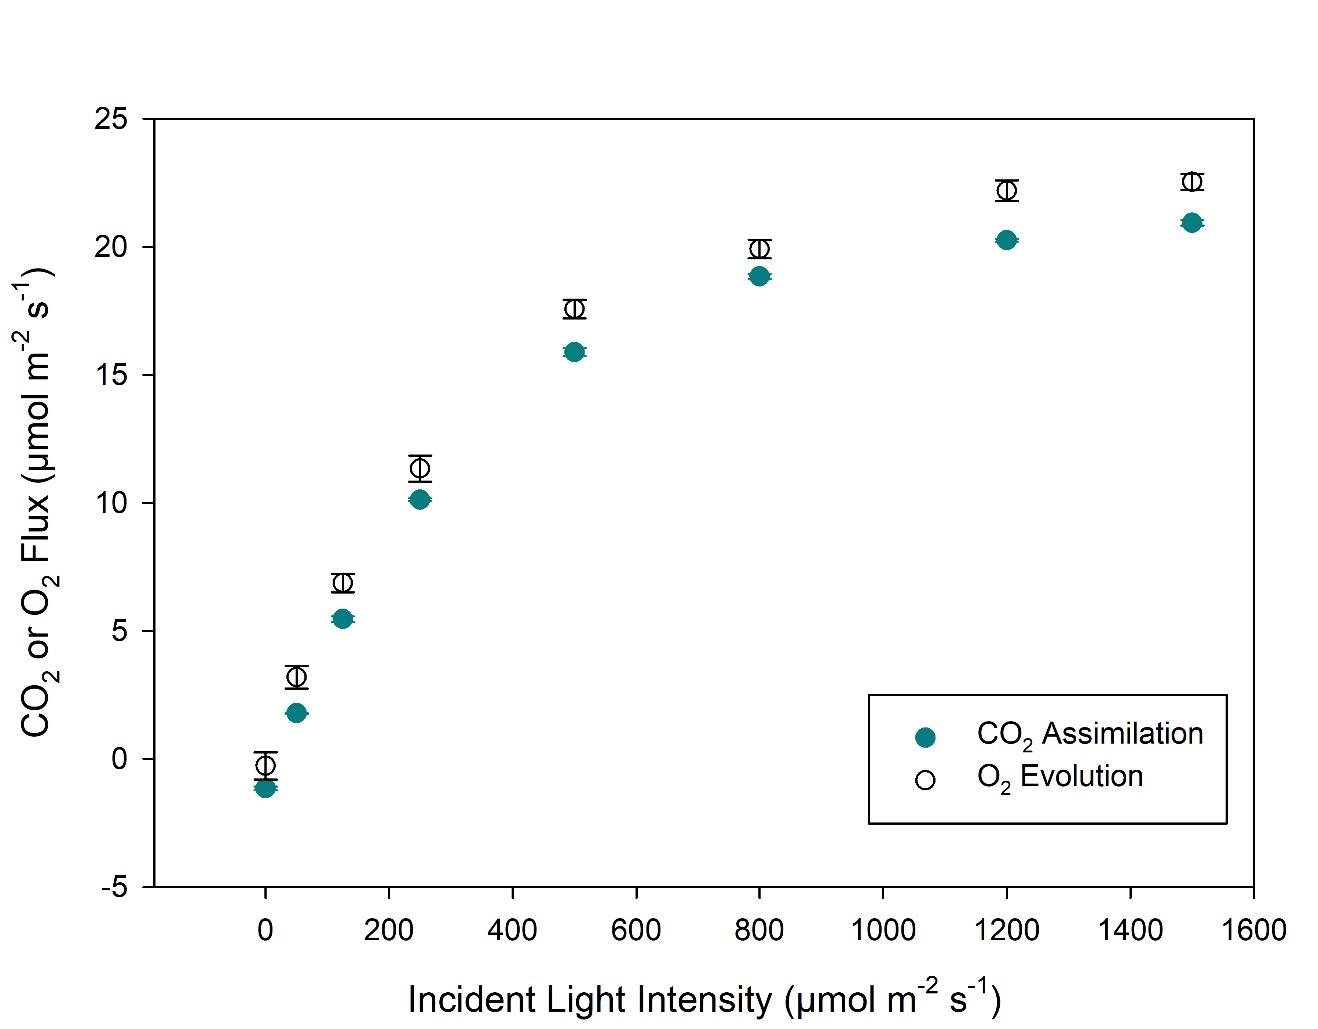
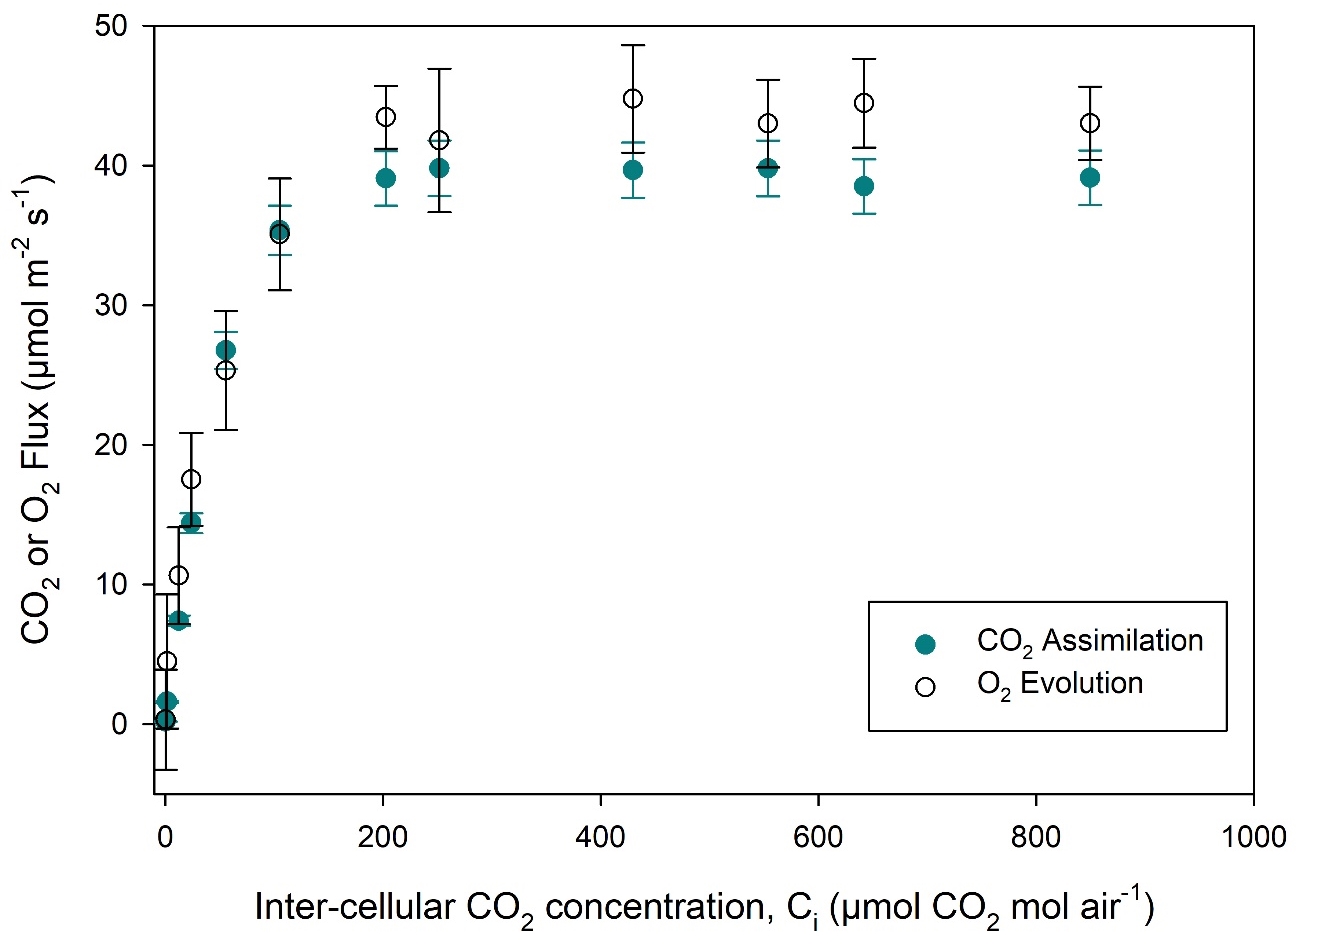
Light response curves were performed on Phaseolus vulgaris (bean) leaves (Figure 1‑3). Our results are in line with the expected 1:1 stoichiometry for CO2:O2 (von Caemmerer 2000). While not studied in detail, the φO2 in the linear portion of the light response curve is higher than that for φCO2, agreeing with theoretical expectations (Singsass et al., 2001). The light response curves were performed using the 6x6 cuvette with 36 cm2 of leaf area. At higher light intensities, ΔO2 is greater than 100 μmol mol-1, and uncertainty in the measurements is reduced. Near the light compensation point, uncertainty in both CO2 and O2 measurements will be high. With the large leaf area in this cuvette, ΔO2 is reasonably large even during respiration measurements (~9 μmol mol-1, see Figure 1‑2B).
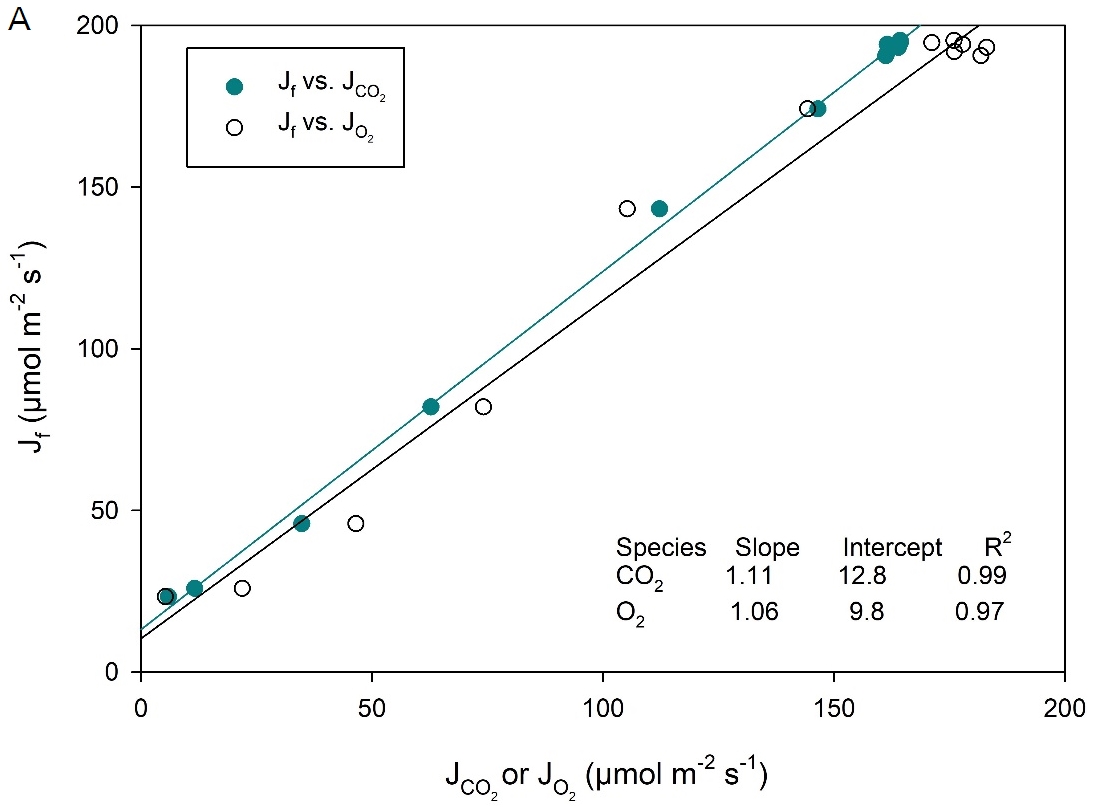
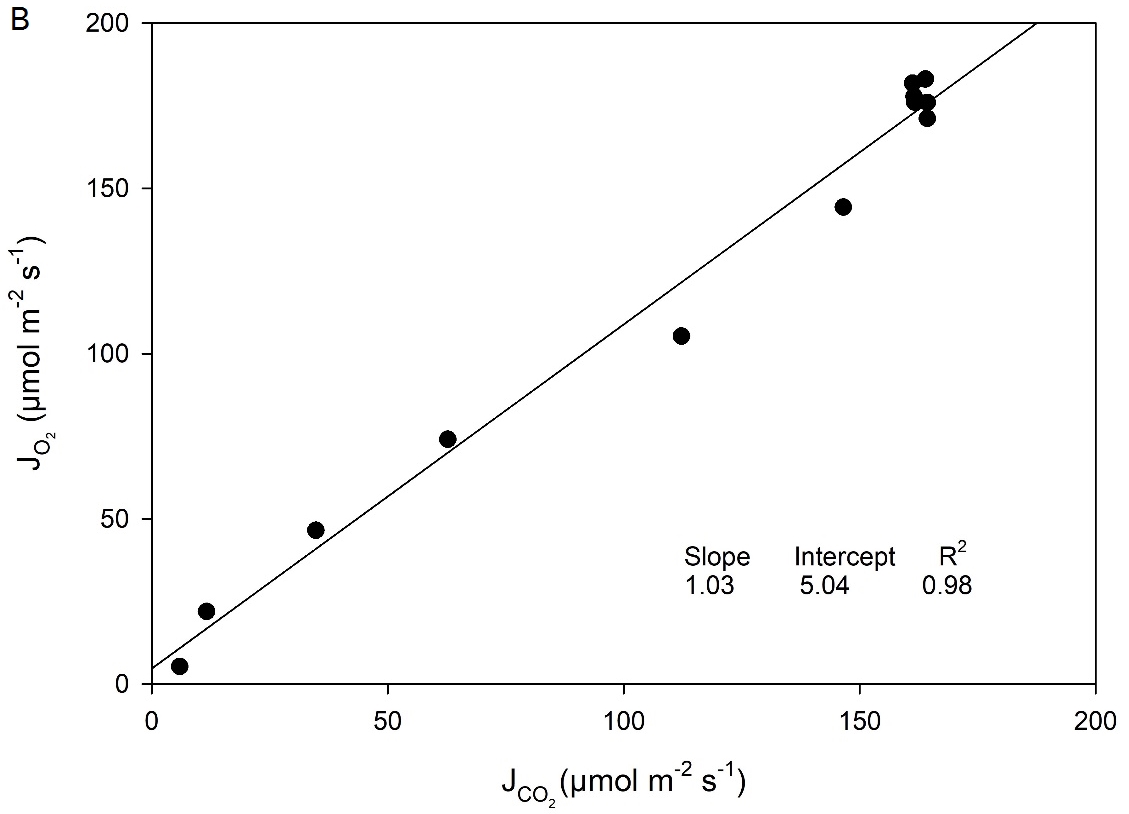
Additionally, CO2 response curves were performed on the C4 species Zea mays (corn) using the 6800-01A MultiPhase Flash Fluorometer (Figure 1‑4). This cuvette allows for the combined simultaneous measurement of CO2 gas exchange, O2 gas exchange and chlorophyll fluorescence. The LI-6800 fluorometer can measure up to 6 cm2 leaf area. In this experiment, electron transport rate (J) can be calculated from three different measurements: 1) Fluorescence, or  , where ΦPSII is measured by chlorophyll fluorescence, Q is incident light intensity, α is leaf absorptance here assumed to be 0.84 and fII is fraction of photons absorbed by photosystem II, here assumed to be 0.5; 2) Gross CO2 exchange
  , where AG is Gross CO2 Assimilation, or net CO2 Assimilation + dark respiration; and 3) Gross O2 exchange,
  , where OEG is gross O2 evolution (net O2 evolution + dark O2 consumption).
The results of these comparisons are shown in Figure 1‑5. Slopes of ~1 in all cases agree with theoretical expectations and with previous results using isotopic techniques to measure O2 exchange (Ruuska et al., 2000).
Conclusions
O2 measurements can be combined with CO2 and chlorophyll fluorescence to provide unique information for leaf-level physiological research. Issues to consider prior to performing experiments include plumbing the system, dealing with dilution by foreign gases and expected uncertainty in the O2 flux measurements relative to CO2 flux uncertainty.
Appendix A: Foreign Gas Dilution on O2
In a non-reactive mixture of multiple gas species at constant temperature and pressure, the addition of one species results in a commensurate decrease in the mole fraction of all other gas species in the mixture. We refer to this effect as dilution. An equation can be written to describe this dilution effect for O2 (see Hupp, 2011 for derivation of the dilution correction). First, let’s consider the dilution impacts of adding only H2O on O2 mole fraction (all units in mol mol-1):

where Omeas is the mole fraction measured, Wmeas is the water mole fraction in the airstream and Odry is the dilution-corrected O2 concentration. The high abundance of O2 in the atmosphere leads to a large dilution effect. For example, at typical atmospheric concentration of 21% (210,000 μmol mol-1), an increase of 5 ppm (0.005 mmol mol-1) water vapor leads to a ~1 μmol mol-1 dilution of O2.
In a leaf-level gas exchange system, incoming air must be humidified to prevent stomatal closure during measurements, and the leaf will add H2O to the airstream. The sample airstream can have significantly larger water mole fraction than the reference airstream. For this reason, the H2O dilution effect cannot be ignored. The precision of the LI-6800 H2O gas analyzer is 0.01 mmol mol-1 (10 ppm) at 10 mmol mol-1 (1,000 ppm). From equation 1‑3 then, at best the uncertainty in a dilution-corrected O2 measurement near 21% is 2 μmol mol-1 simply due to uncertainty in the H2O measurement. This uncertainty can be as large as the induced O2 change in some cases. Additionally, water sorption on cuvette surfaces and tubing will cause further errors. For these reasons, a dilution corrected O2 flux measured in wet air streams unacceptably uncertain. To make high precision O2 measurements it is necessary to calculate small O2 fluxes, and the H2O must be scrubbed prior to entering the G2207-i O2 analyzer physically eliminating the need for an H2O dilution correction.
The analysis above justifies the necessity of scrubbing H2O from the airstream before making the O2 measurements. CO2 will also differ significantly between reference and sample air streams, enough to require a dilution correction. Just as for H2O, a 5 μmol mol-1 change in CO2 will cause a 1 μmol mol-1 in O2 near 21% O2 concentrations. However, for CO2, the LI-6800 measurement precision is better (<0.1 μmol mol-1). Uncertainties in the CO2 concentration measurement result in an uncertainty of ~0.02 μmol mol-1 in the CO2 dilution-corrected O2 concentration. However, if CO2 is not scrubbed, then the choice of chemicals for scrubbing H2O becomes more limited, as the H2O scrubber must not interact with CO2. In our experience, the chemical of choice for this scenario is magnesium perchlorate (Mg(ClO4)2), which comes with certain drawbacks; the final state of magnesium perchlorate is a liquid, which needs to be prevented from entering the analyzer and causing damage. Magnesium perchlorate can also be quite expensive. For these reasons, scrubbing both H2O and CO2 from the airstream prior to the G2207-i is often the best solution. A single set of chemical columns placed directly in front of the G2207-i, can be used to scrub both sample and reference lines (Figure 1‑1).
| Part Number | Description |
|---|---|
| 300-157121 | Hose barb (metric; M5×0.8 to 1/8" ID) |
|
300-10471a |
Needle Valve |
| 300-07385a | ¼” Quick-connect “T” fitting |
| 300-03367 | ¼” Quick-connect “Y” fitting |
| 300-03123 | ¼” Quick-connect straight union |
| 8150-250 | Bev-a-line tubing (15m roll) |
| 300-01961 | Balston air Filter |
| 300-07025 | Solenoid valve 6 PSI 5V |
| 314-07215 | 25 pin D -ub connector for LI-6800 console |
| 9960-093 | Scrub Tube with ¼” hose barb fittings |
Appendix B: Mass balance equations for CO2 and O2 flux calculation
The LI-6800 system measures both CO2 and H2O and corrects for the mole fraction dilution of CO2 by H2O. Uncertainties in H2O measurements as well as the kinetics of H2O surface interactions make using the dilution correction problematic (see Appendix A: Foreign Gas Dilution on O2). Thus, the options are to scrub only water vapor and correct the O2 concentrations for dilution by CO2, or to additionally scrub CO2 and H2O. We will provide mass balances and final flux calculations for both calculations here.
Scrub H2O and CO2
The mass balance for O2 in an open-path gas exchange system can be written as:

where s is leaf area (m2), OE is O2 evolution (μmol m-2 s-1), ui and uo are molar flow rates (mol s-1), entering and exiting the leaf cuvette, respectively, and OR and OS are O2 concentrations (μmol O2 mol-1) entering and exiting the leaf cuvette, respectively. When scrubbing both H2O and CO2 from the airstream prior to measurement by the Picarro G2207-i O2 analyzer, the output flow rate uo is altered only by the addition of O2:

Combining equations 1‑4 and 1‑5 and solving for sOE yields the flux equation
1‑6

Scrub only H2O
The mass balance for O2 in the LI-6800 system when H2O is scrubbed but CO2 is not, is identical to equation 1‑4
1‑7

However, in this case the flow exiting the cuvette is altered by both the uptake of CO2 and evolution of O2
1‑8

where A is CO2 Assimilation (μmol CO2 mol-1 s-1) and other variables as in equation 1‑4. Combining equations 1‑5 and 1‑4 and solving for sOE yields

A similar equation can be written for the mass balance of CO2
1‑10

Substituting the expression for sA into equation 1‑9 allows us to solve for sOE in terms of the concentrations. This form of the equation can be used to calculate O2 evolution in the case where CO2 is not being scrubbed.
1‑11

References
Canvin, David T, Joseph A Berry, Murray R Badger, Heinrich Fock, and C Barry Osmond. “Oxygen Exchange in Leaves in the Light.” Plant Physiology 66, no. 2 (1980): 302–7.
Hupp, J.R. 2011. The Importance of Water Vapor Measurements and Corrections. LI-COR, Inc., Application Note 129.
Ruuska, Sari A, Murray R Badger, T John Andrews, and Susanne Von Caemmerer. “Photosynthetic Electron Sinks in Transgenic Tobacco with Reduced Amounts of Rubisco: Little Evidence for Significant Mehler Reaction.” Journal of Experimental Botany 51, no. suppl\_1 (2000): 357–68.
Singsaas, Eric L, Donald R Ort, and Evan H DeLucia. “Variation in Measured Values of Photosynthetic Quantum Yield in Ecophysiological Studies.” Oecologia 128, no. 1 (2001): 15–23.
Von Caemmerer, Susanne. Biochemical Models of Leaf Photosynthesis. Csiro publishing, 2000.