
Central to the LI-6800's gas exchange computations is the difference (Δ) between sample and reference gas analyzer readings Cs and Cr. (We are using C for concentration, meaning CO2 or H2O). For Δ to be accurate, we need to ensure that Cr = Cs when the IRGAs are receiving identical air streams. We call this condition matching, and it is used to measure correction factor M.
9‑99

where the |m indicates the readings were made in match mode. M is used to correct subsequent measurements.
9‑100

The value of M is unchanged until another match is performed. How stable is M? There is some relation between sample and reference that likely depends on concentration, time, temperature, and human activity such as zeroing and/or spanning one or both IRGAs. Let's designate this match relationship as function m(C), to emphasize its potential dependency on concentration. We don't really know what m(C) looks like, but every time we match, we capture its value at a particular concentration, time, temperature, etc. Since matching is done at the reference concentration, we can write
9‑101

- Question #1: Does frequent matching assure accuracy?
- It may not. It turns out that the shape of m(C) is very important. Figure 9‑17 illustrates the potential problem.
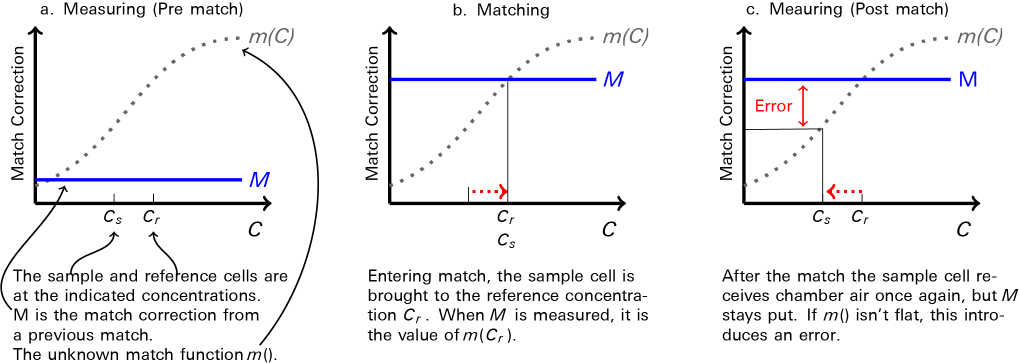
The post-match error can be expressed as a fraction by
9‑102

which is the slope of m(C) over the interval (Cs; Cr). This error (as a fraction or a percentage) is independent of how large or small Δ is. This means that if m(C) has a 1% slope, the post match error in flux will also be 1%.
So, the shape of m(C) is crucial: the more sloped it is, the more you need to re-match if concentration changes, but with each match, there will still be a post-match error. A flat m(C) is good, a sloped m(C) is bad.
- Question #2: If m(C) is an unknown function, how can I know the slope?
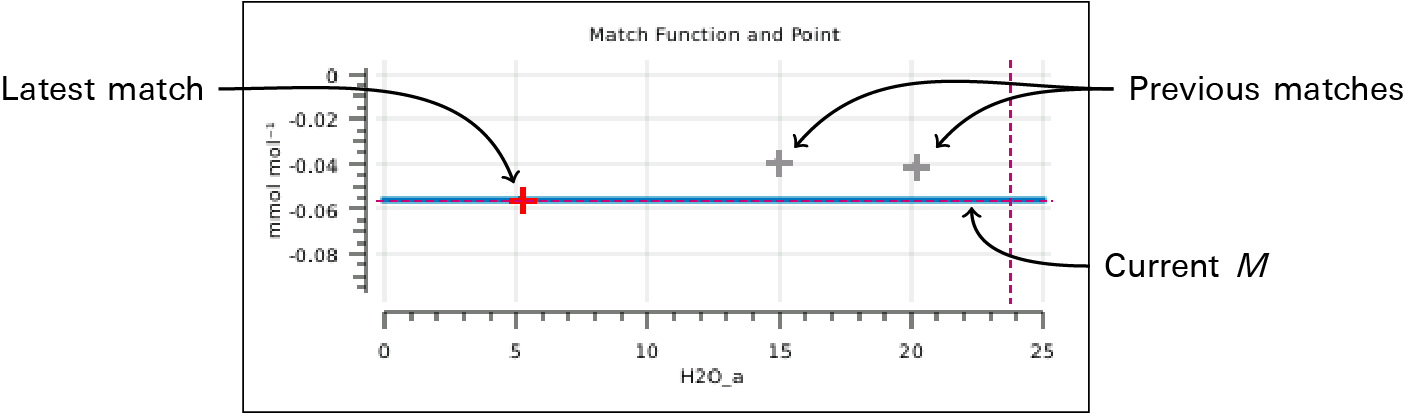
- The match screen in version 1.4 has match graphs for both CO2 and H2O. This graph displays the current and previous match values (i.e., values of M). If you do a few matches over a range of concentrations, you will quickly get a sense of the overall slope of m(C) (Figure 9‑18).
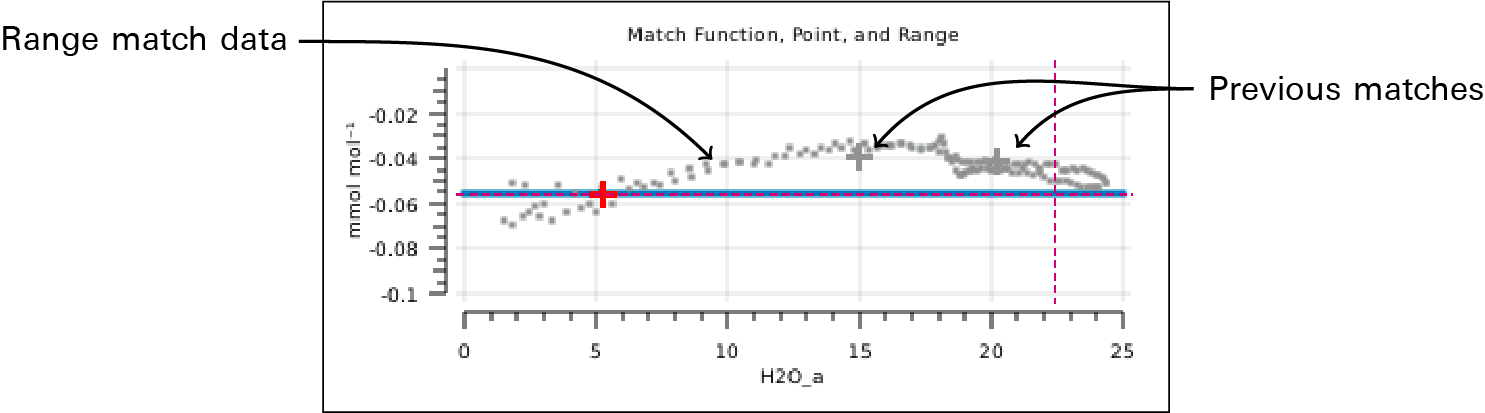
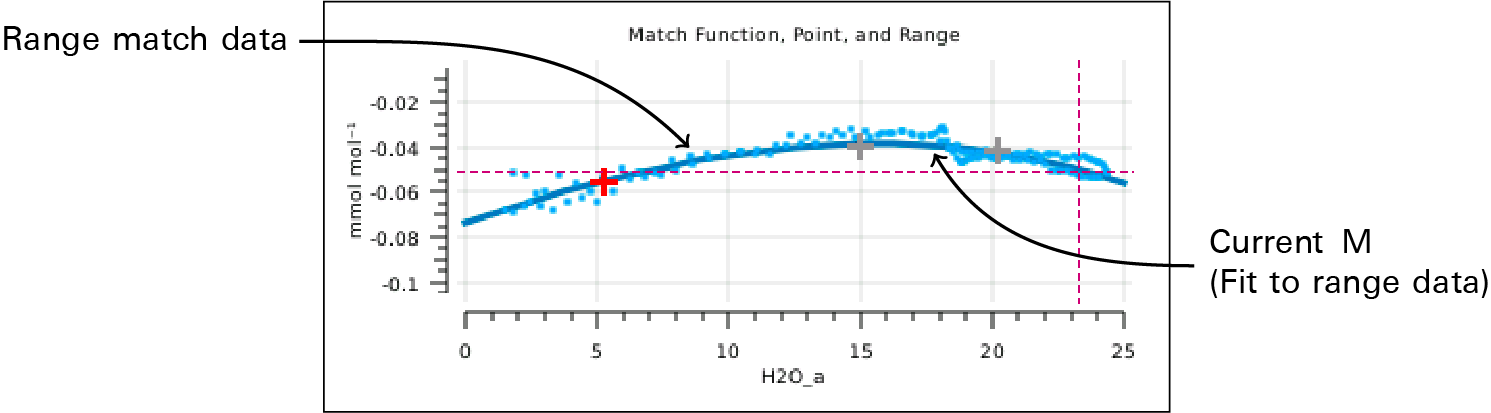
In addition, version 1.4 provides a mechanism to acquire "range match" data (Figure 9‑19). This is a set of values of M taken over the full concentration range in about 5 minutes and shows a very detailed estimate of what m(C) looks like, over that window of time.
- Question #3: Can a sloped m(C) be corrected (i.e., flattened)?
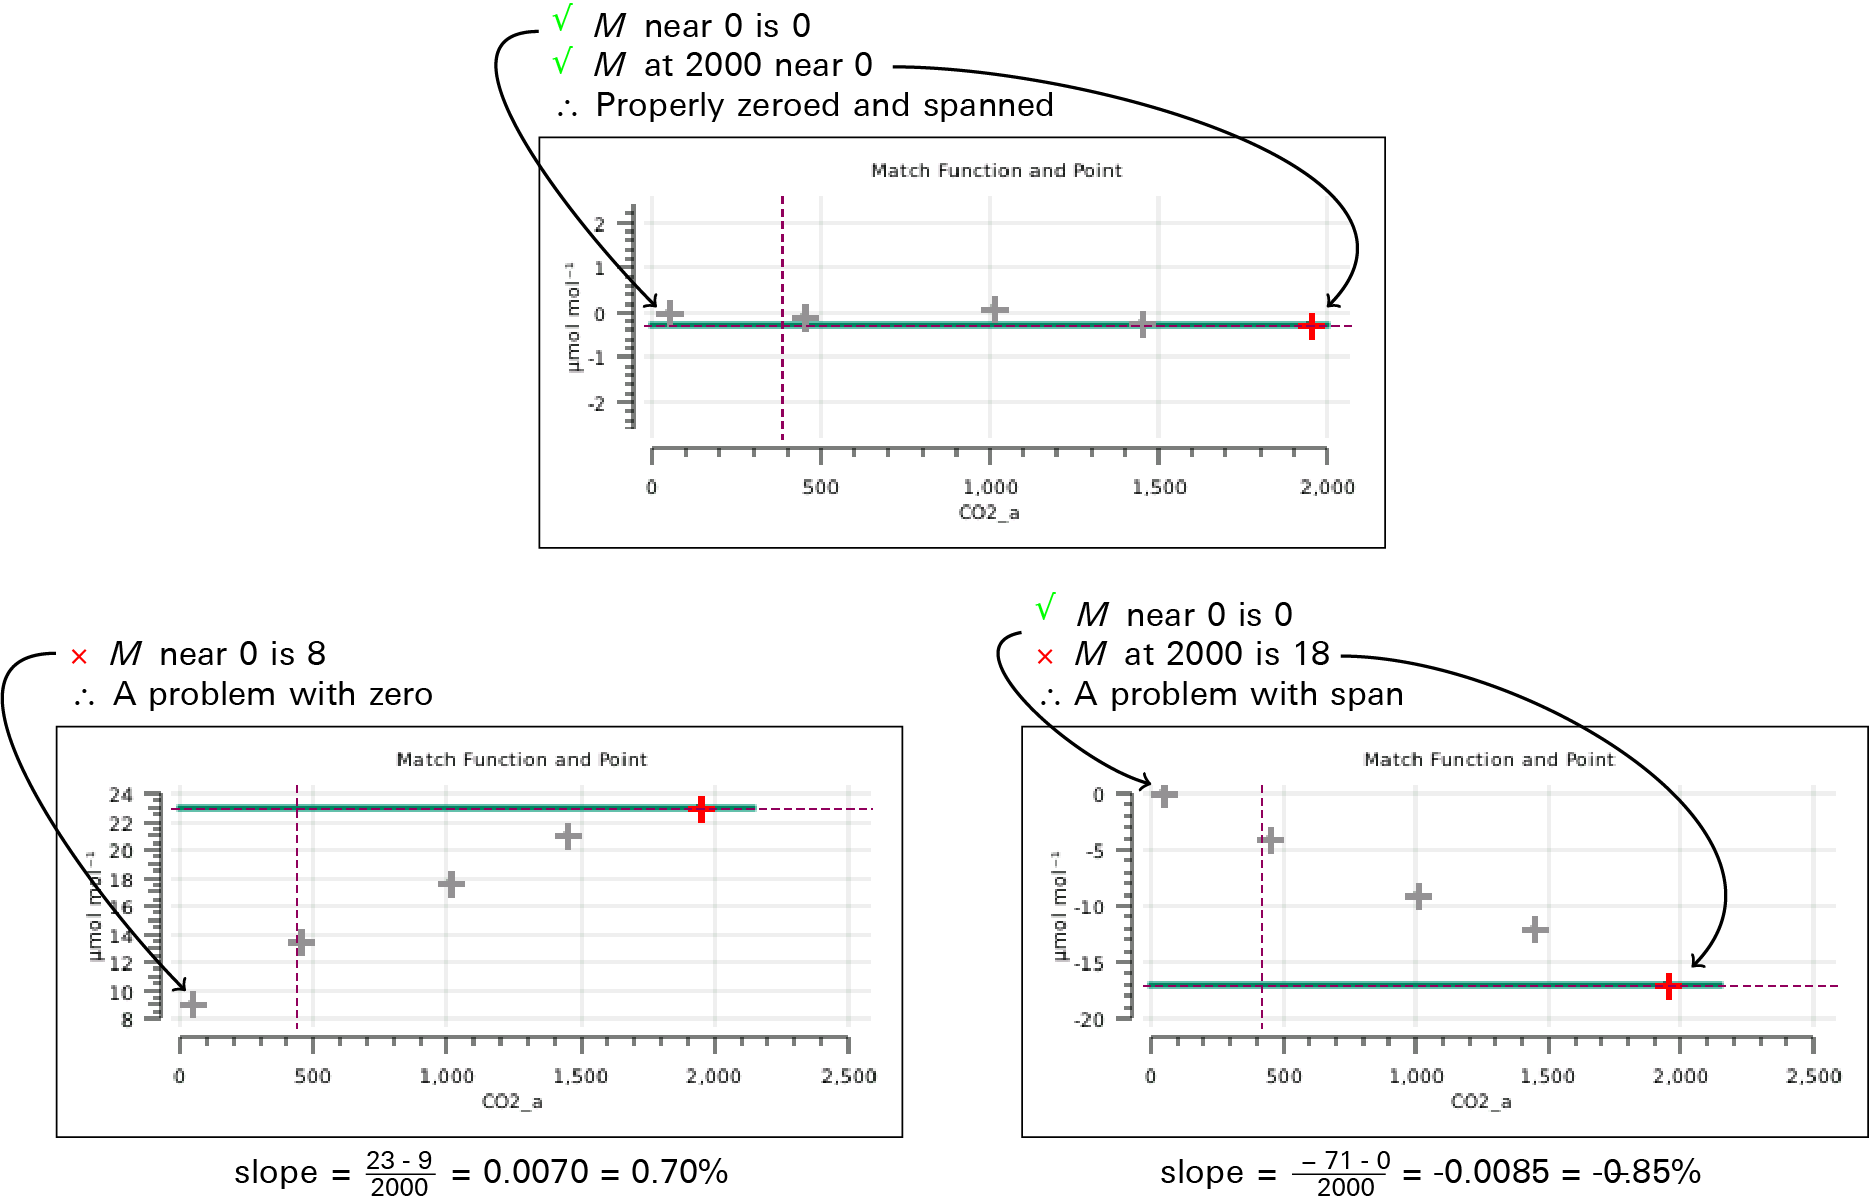
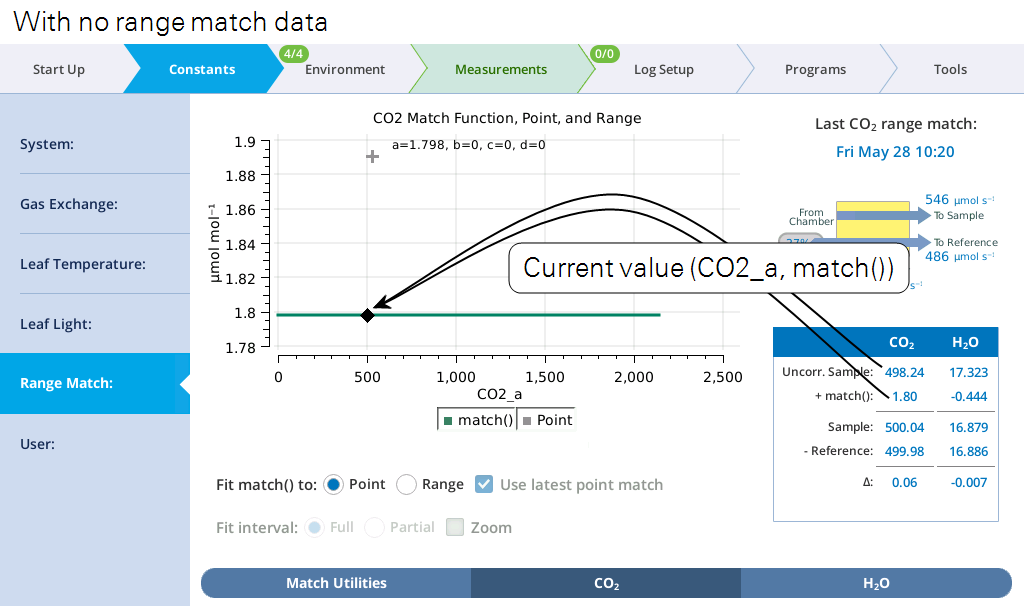
- Yes. A sloped m(C) means there is a calibration mismatch that you can correct. Values of M should go to 0 as concentration goes to 0. If they don't, one or both IRGAs need to be properly zeroed. At high concentrations, large M values can be caused by an improperly zeroed IRGA, or when one IRGA (or both) is improperly spanned. Figure 9‑20 illustrates some examples.
- Question #4: The post-match error problem stems from the fact that M is a constant. Does it have to be?
- Version 1.4 allows the match correction M to be a 3rd order polynomial based on Cs. It can be fit to range match data, yielding an M that continually updates as Cs changes (Figure 9‑21). This not only removes post-match errors, but reduces the need to match when concentration changes. In other words, instead of a constant M, you can have M(C) ≈ m(C).
The match screen
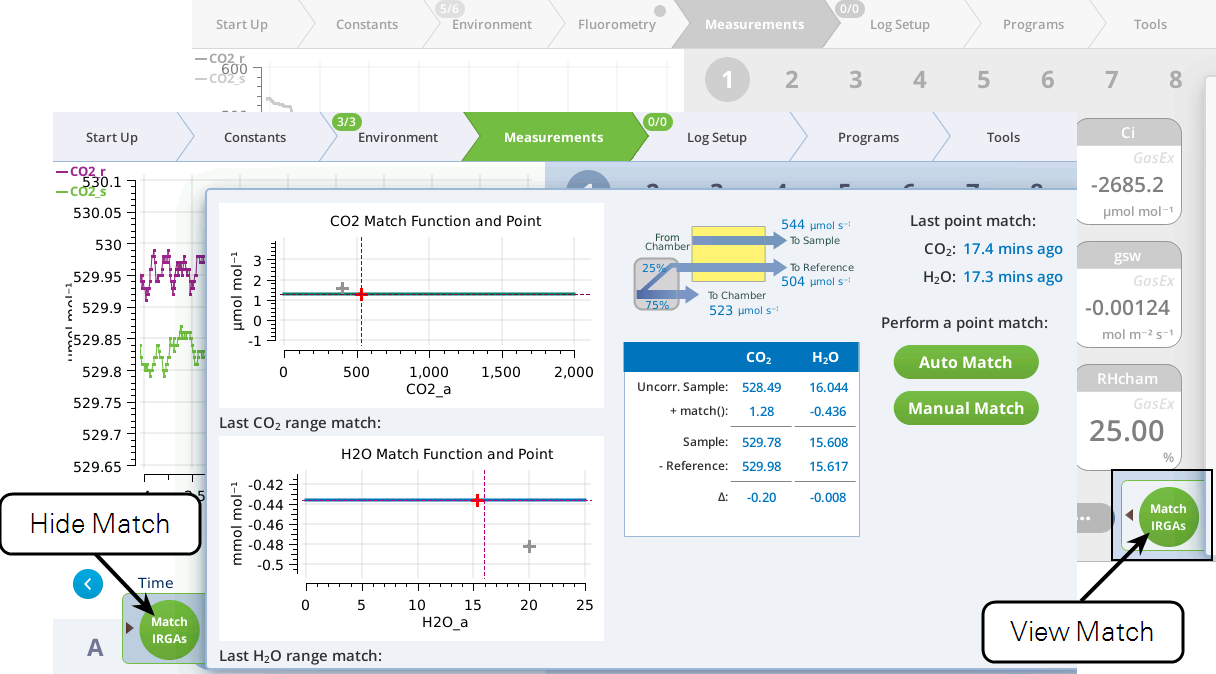
The Match screen — for point matching — is under the measurements tab (Figure 9‑22). Matching can be triggered by the Auto Match or Manual Match buttons. The status table in the center shows exactly how the current value of Δ is being computed. The graphs show matches done since power on (gray plus marks) and the current match value as a function of concentration (solid green or blue curve).
The summary table
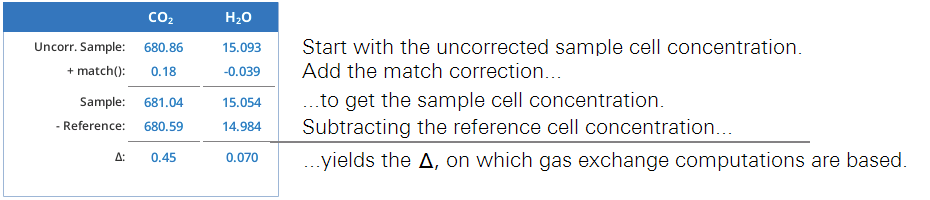
The summary table (Figure 9‑23) makes explicit what the match function is doing. We label it match() since the match offset is now potentially a function of uncorrected sample cell concentration.1
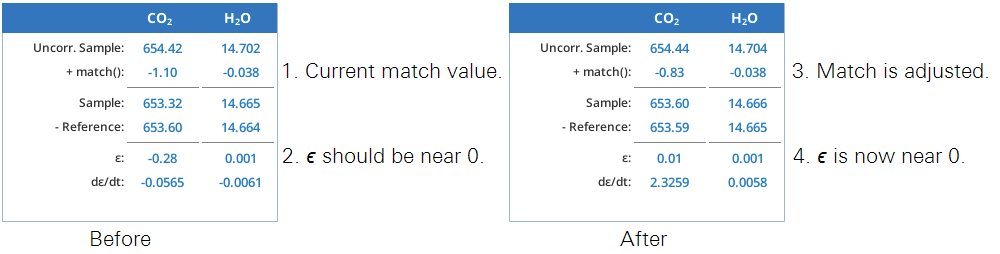
During a match, the table changes a bit (Figure 9‑24). Since both cells are seeing the same gas, the expected Δ is zero; it is labeled ϵ, since a non-zero value represents an error in the current value of match(). There is also a stability indicator, dϵ = dt, the rate of change of that error with time.
The graphs
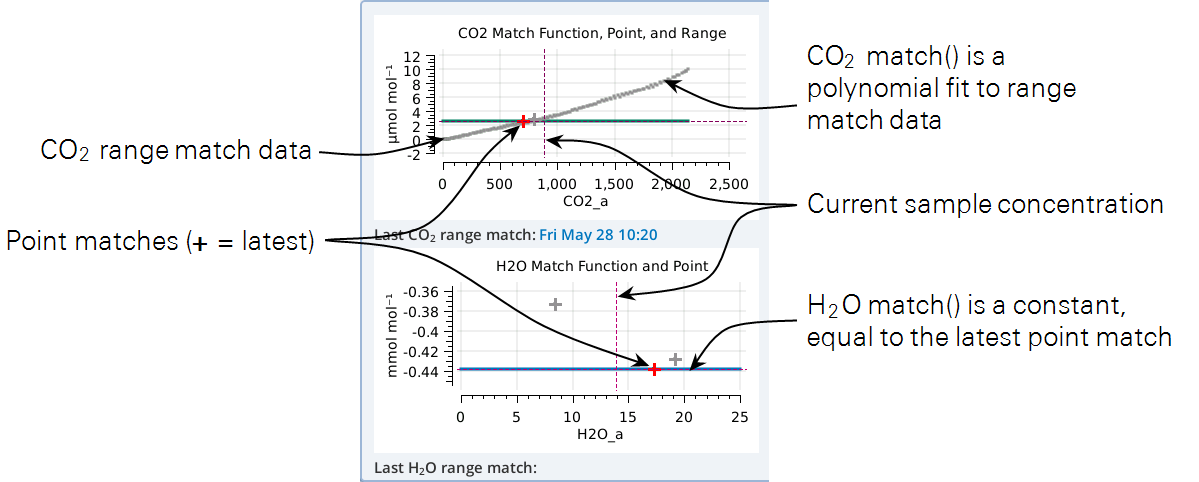
The graphs on the Match page show three things: the current match function (solid colored line), recent point matches (most recent in red), and (if present) range match data. In the example in Figure 9‑25, the H2O graph (bottom) does not have range data; the CO2 graph (top) has range data with the match function fit to them.
Range matching
Range matching in version 2.0 is under Constants > Range Match.
Managing the details
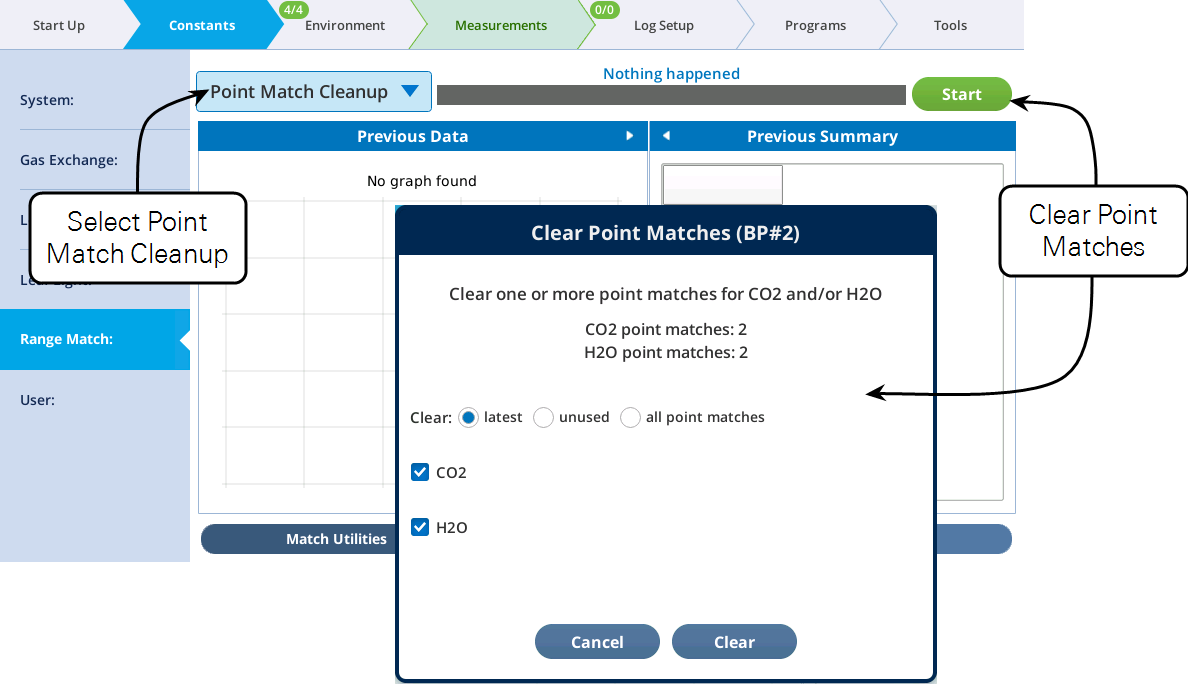
The Range Match tab presents three menu items (CO2 Range Match, H2O Range Match, and Point Match Cleanup) and three sub-tabs (Match Utilities, CO₂, and H₂O).
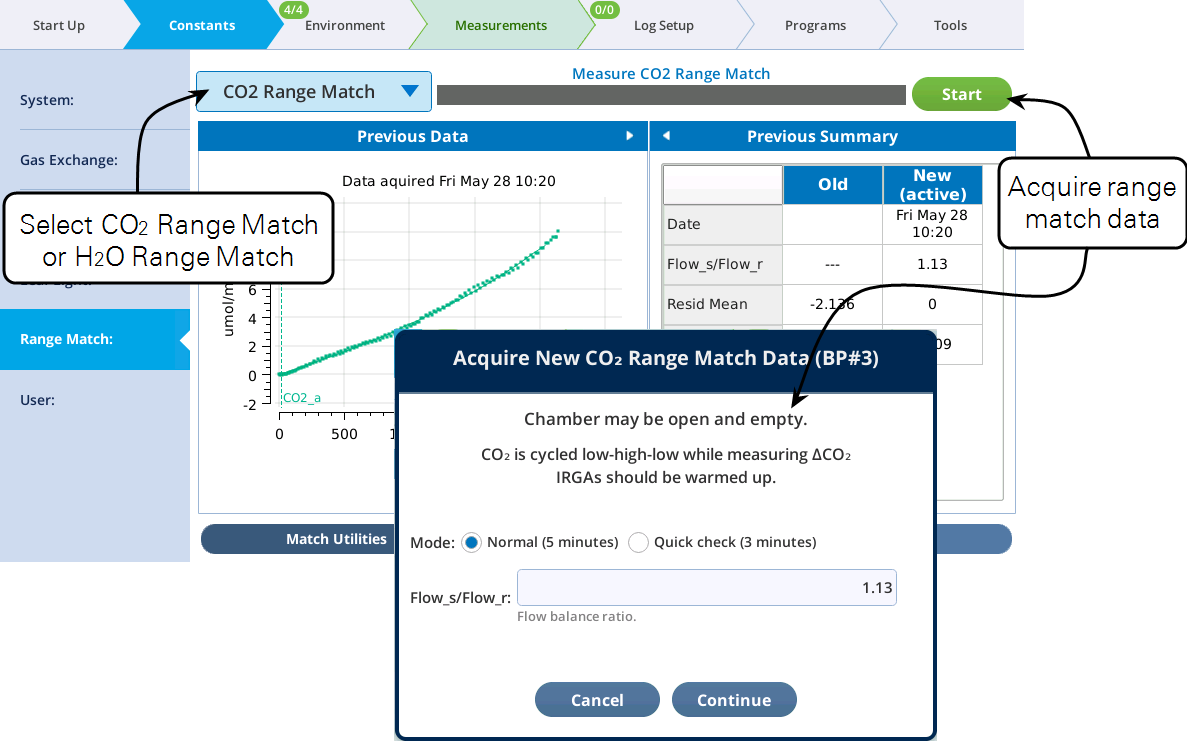
Under Match Utilities, you acquire range match data by selecting CO2 Range Match or H2O Range Match from the menu and tapping Start.
To remove point match data:
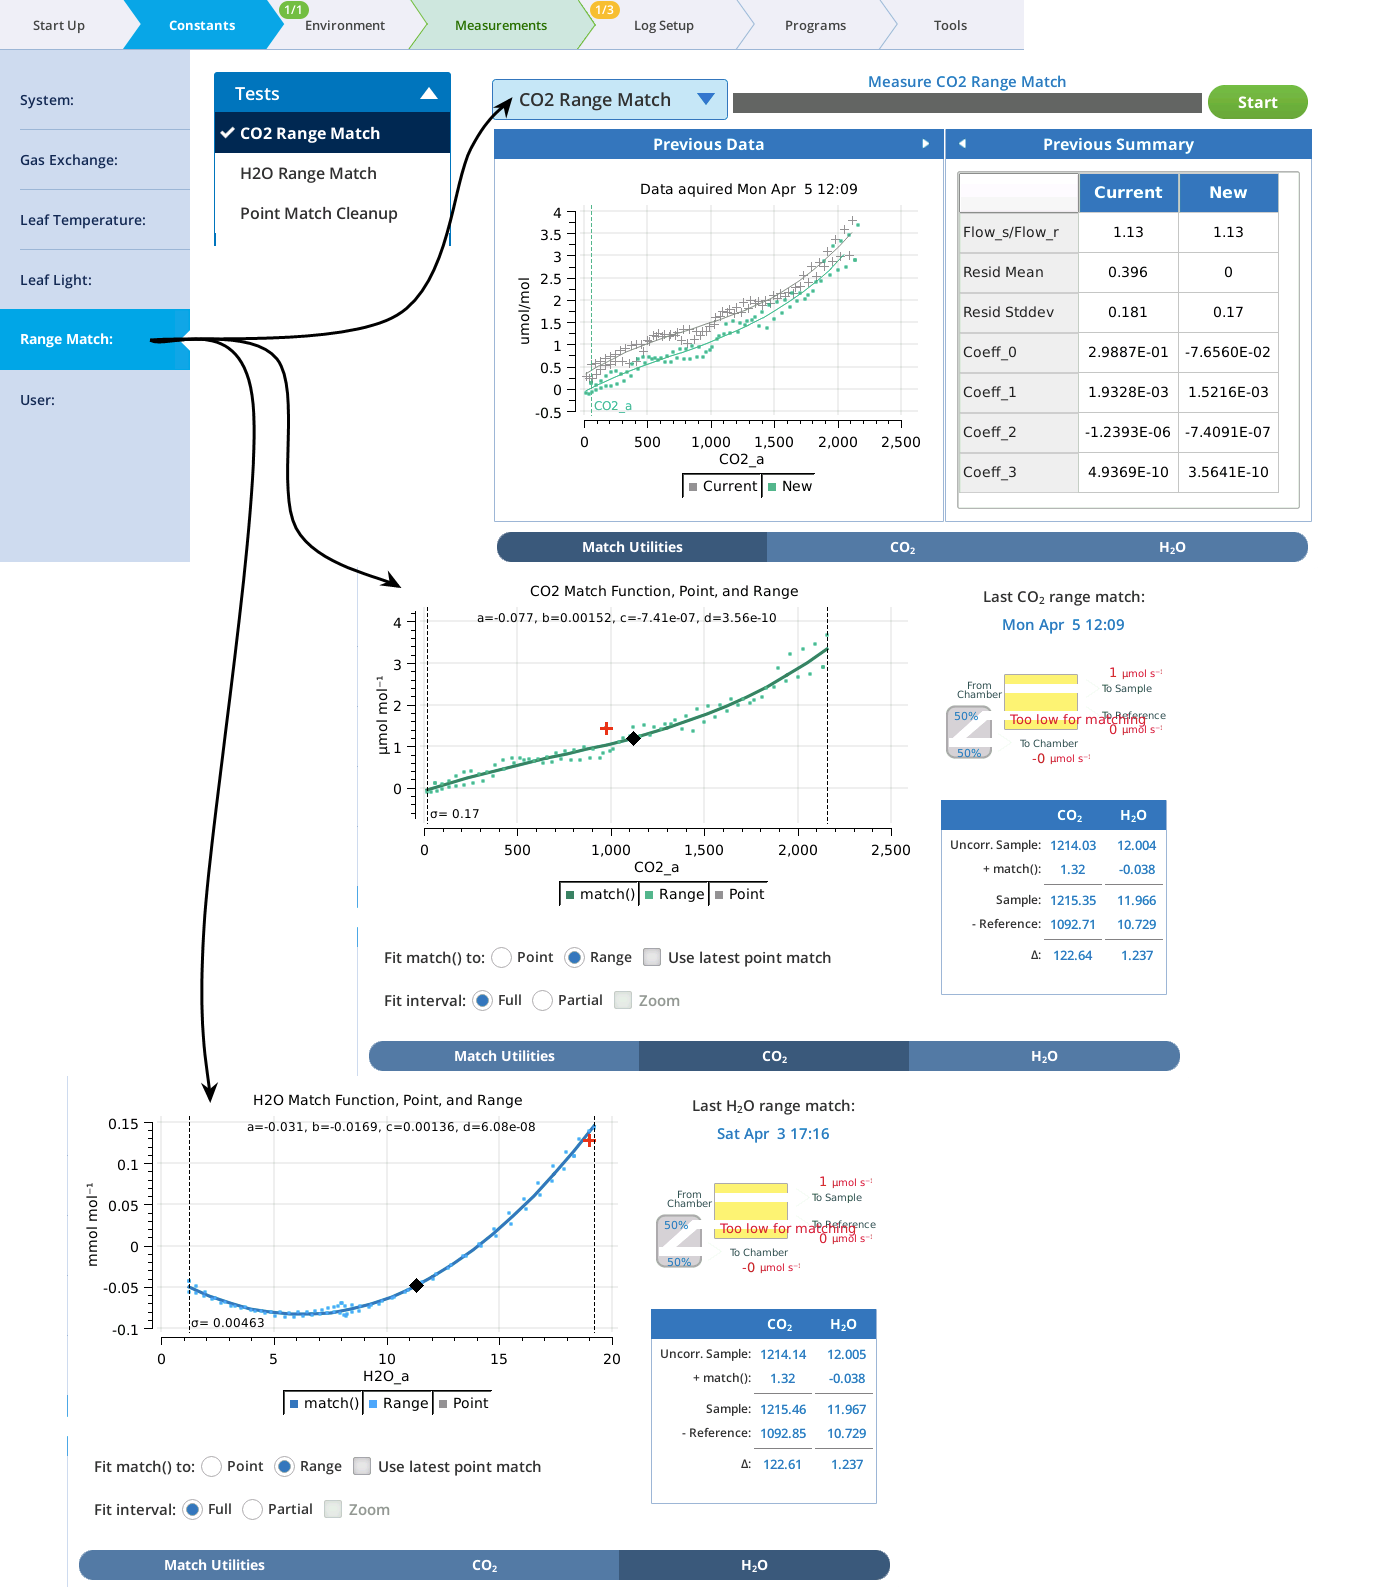
When range match data is available (Figure 9‑26), you can choose to fit the match function to it, and whether to adjust the fit to the latest point match.
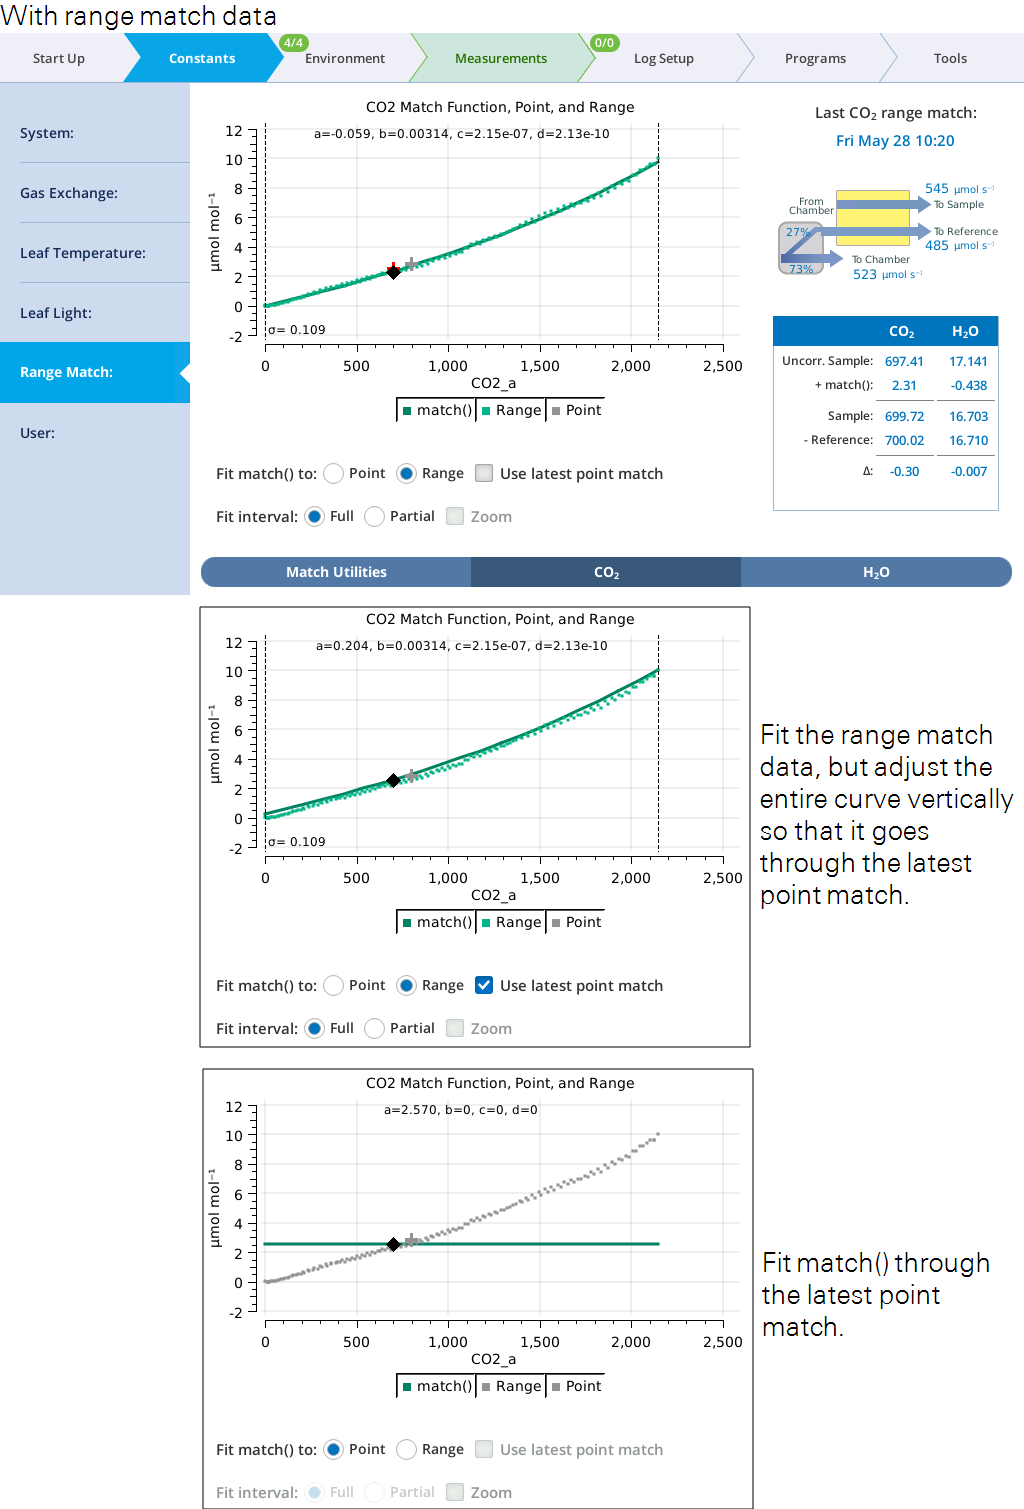
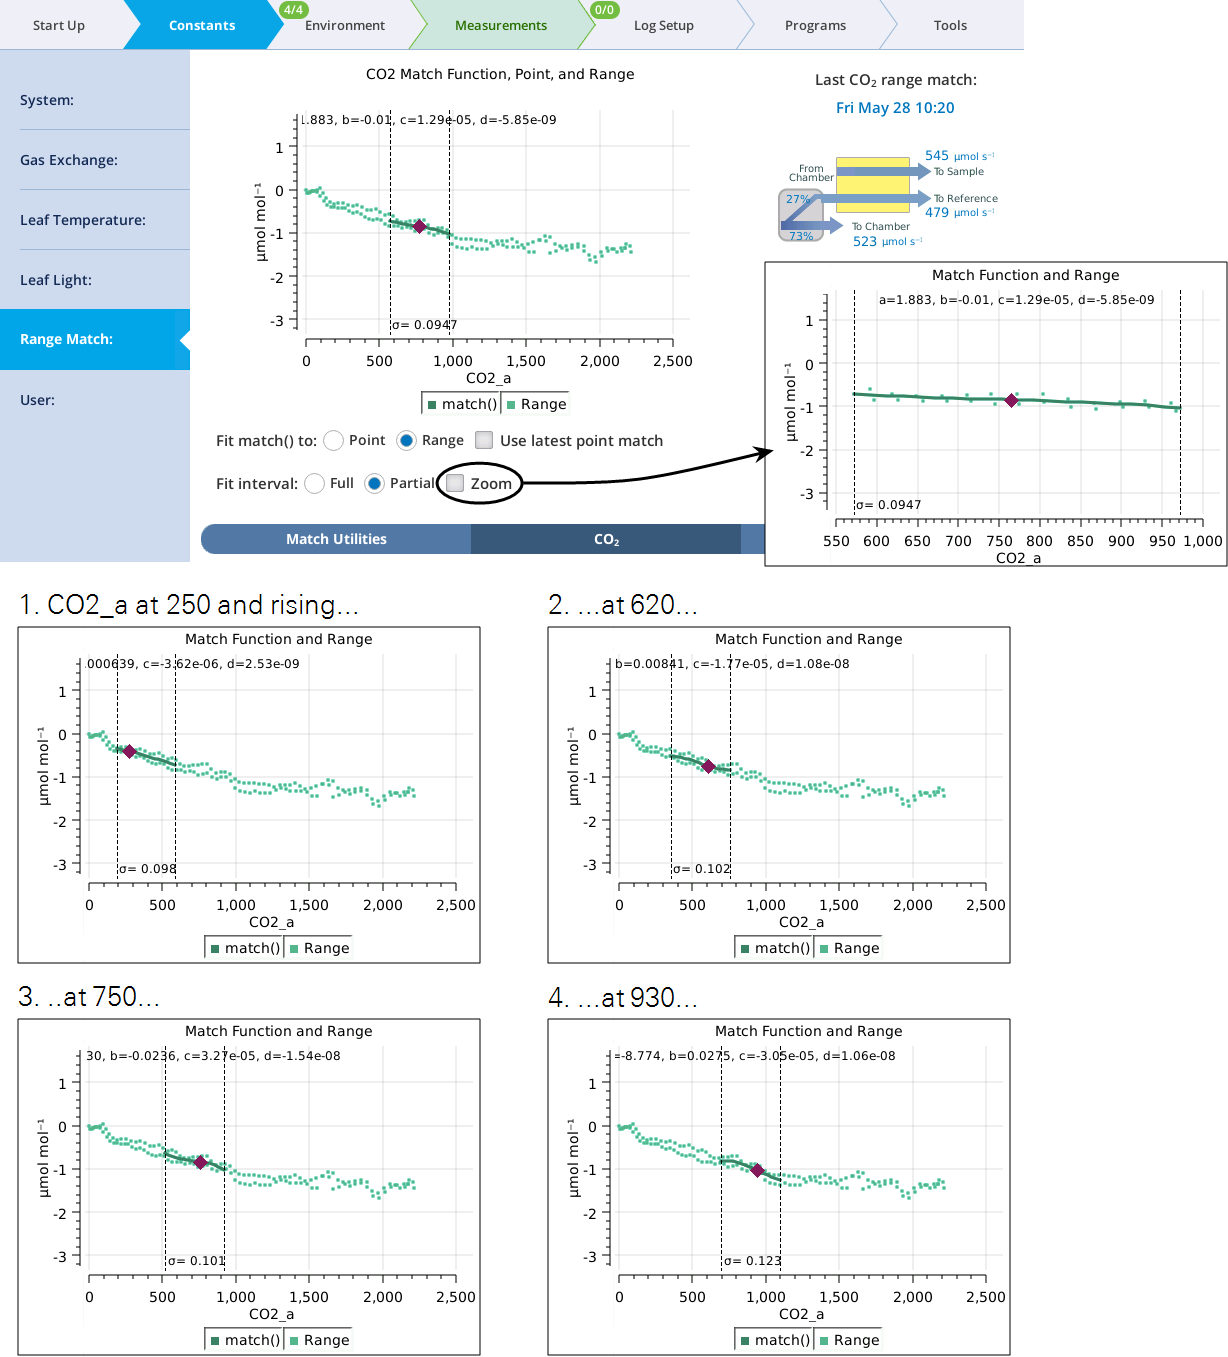
The match function can be fit to the full range match data set, or to a subset by setting Fit interval to Partial, which selects a narrow band of range match data that contains the current sample concentration. This band shifts automatically as sample cell concentration changes (Figure 9‑27).
Acquiring range match data
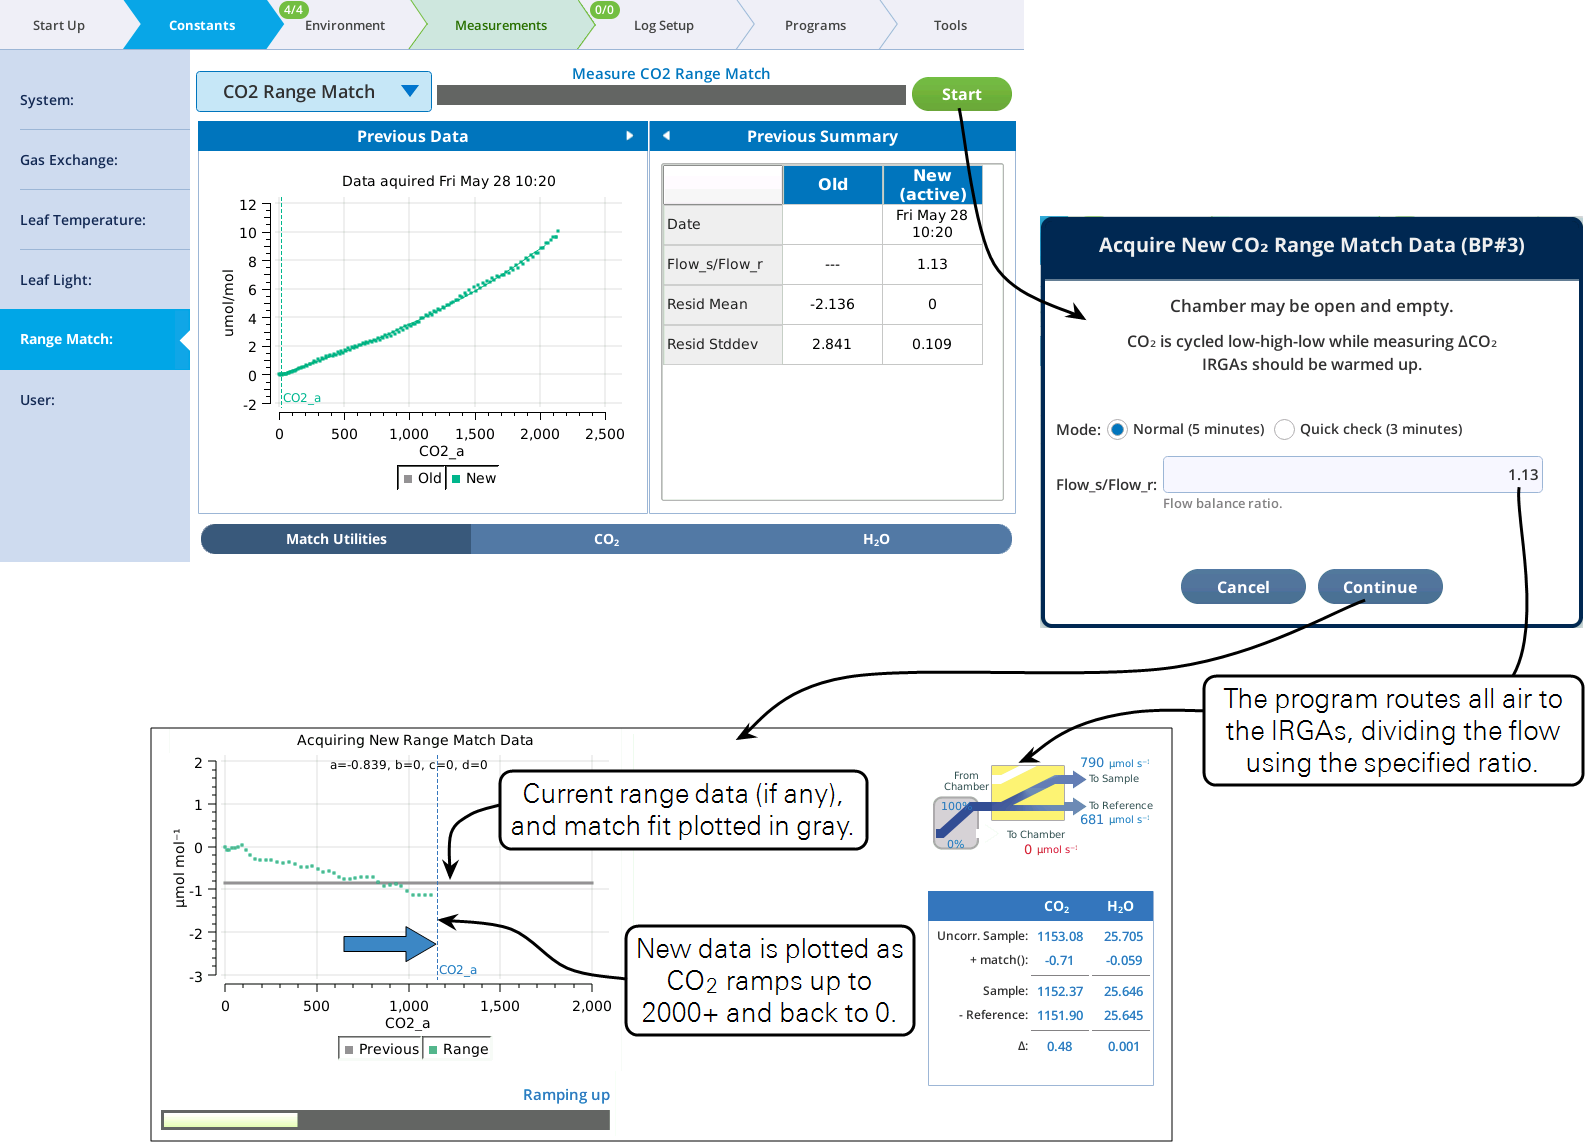
The Start button will launch a program to collect range match data (Figure 9‑28). This process takes a few minutes, and should be done without any leaf in the chamber, since the chamber receives no air flow during the process.
The Acquire program tries to cover as wide a concentration range as possible. For CO2 this means having fresh soda lime and an adequate CO2 cartridge. For H2O, it means having fresh desiccant and a saturated humidifier tube.
Once running, the Acquire program does the following: a) Routes all the flow to the IRGA, splitting it between sample and reference. b) Ramps concentration from low to high and back to low. c) Records the concentrations differences between uncorrected sample and reference during the ramp up and back.
When the program is done, the closing dialog (Figure 9‑29) gives you the option of keeping or discarding the new range match data set.
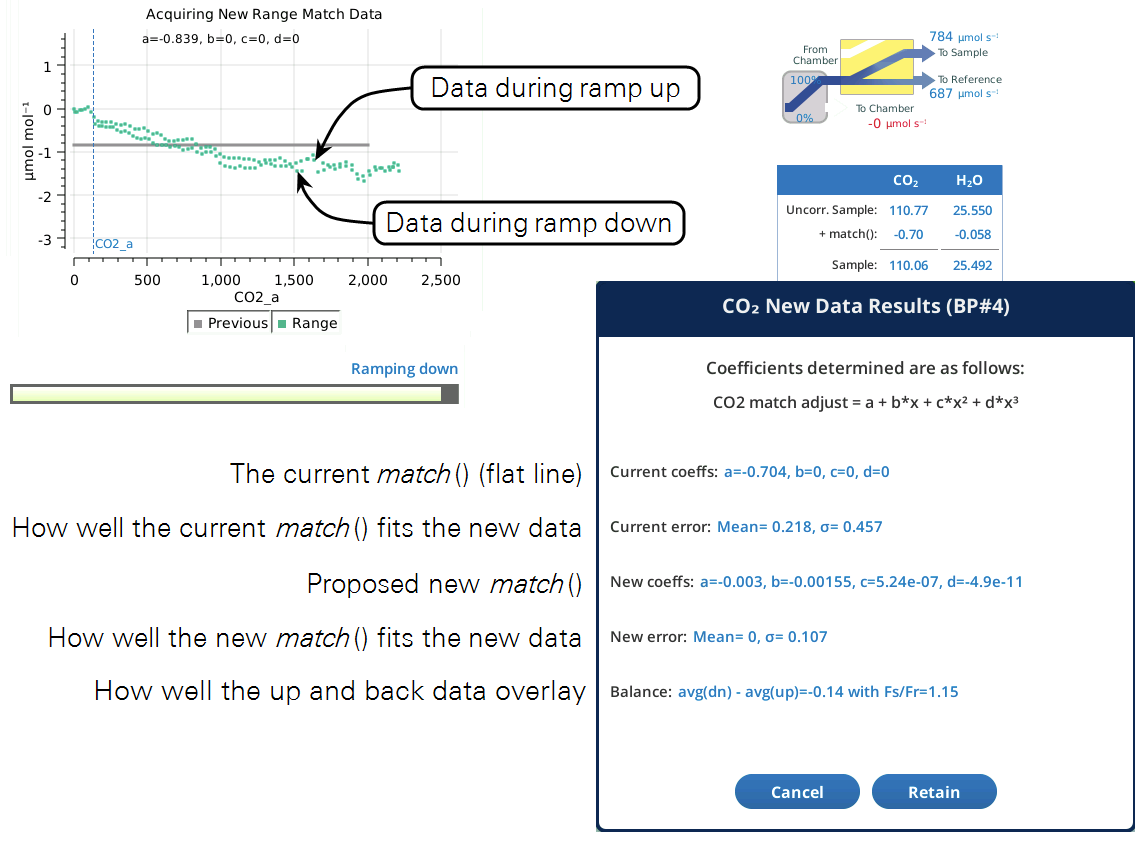
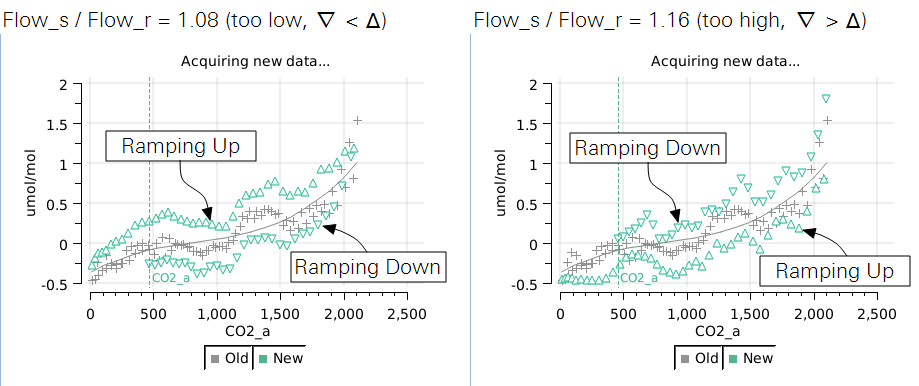
The ramp up values should overlap reasonably well with the ramp down values. If they don't, you can adjust the Flow_s/Flow_r parameter to compensate. Doing the ramp at a faster rate will exaggerate the difference, so you can run Acquire a couple of times at the faster rate to try and get the best Flow_s/Flow_r value. Then, when you slow it down for a normal run, the overlap will be even better.
- If the "coming back" values are higher than the "going up" values, then Flow_s/Flow_r should be lowered.
- If the "coming back" values are lower than the "going up" values, then Flow_s/Flow_r should be raised.
Values in the 1.10 to 1.20 range seem typical for CO2. For H2O, expect flow ratios to be 1.3 to 1.4.
Range match stability
Zero and span
Zeroing and spanning an IRGA will potentially invalidate range match data. In fact, entering those routines will reset the match function to a 0th order polynomial with 0 offset. The range match data is not discarded, but you may need to run Acquire after the zero or span adjustments.
Effect of warmup
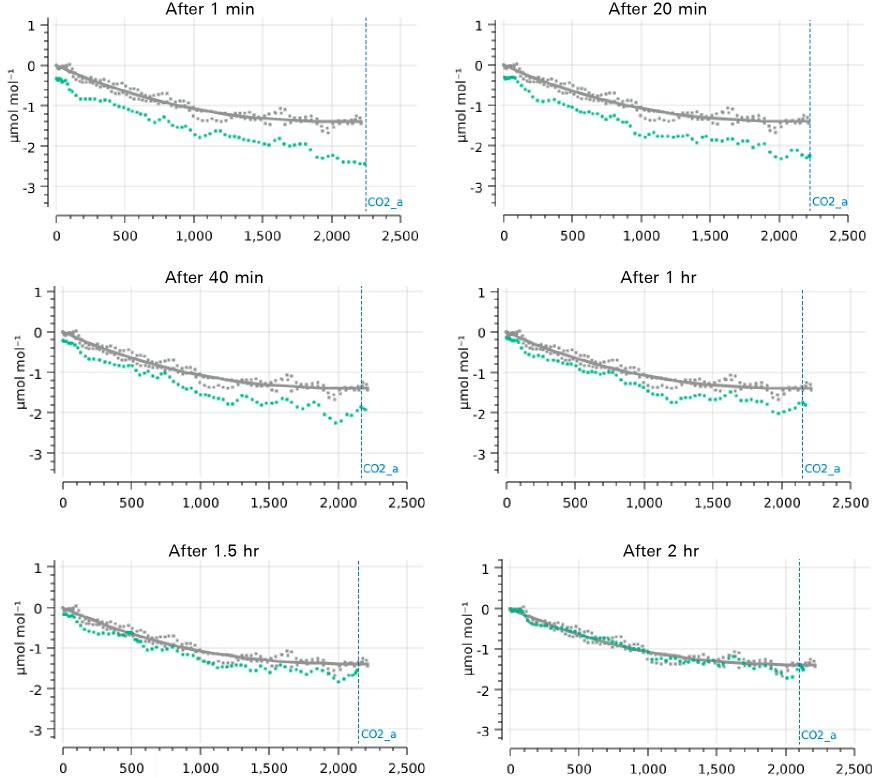
There is typically a shift in range match data as an instrument warms up. Figure 9‑31 compares an original range match data set taken when fully warmed up on a prior day (gray data, same in all plots) with newly acquired data (green points) taken at regular intervals since being awakened from sleep mode, in which it has been for 16 hours prior to the experiment. (The new data is discarded each time, so the plot comparisons are always with the same original data set.)
The largest differences were at 1 minute after warmup, when the curve was shifted down by 0.2 ppm at the low end, and by 1 ppm at the high end. Over the course of 2 hours, the data slowly drifted toward the original data set.
Fortunately, the general shape of the curve was consistent. This suggests you can compensate for disequilibrium by performing a point match (to shift the curve fit), rather than by remeasuring range match data.
Match information in data files
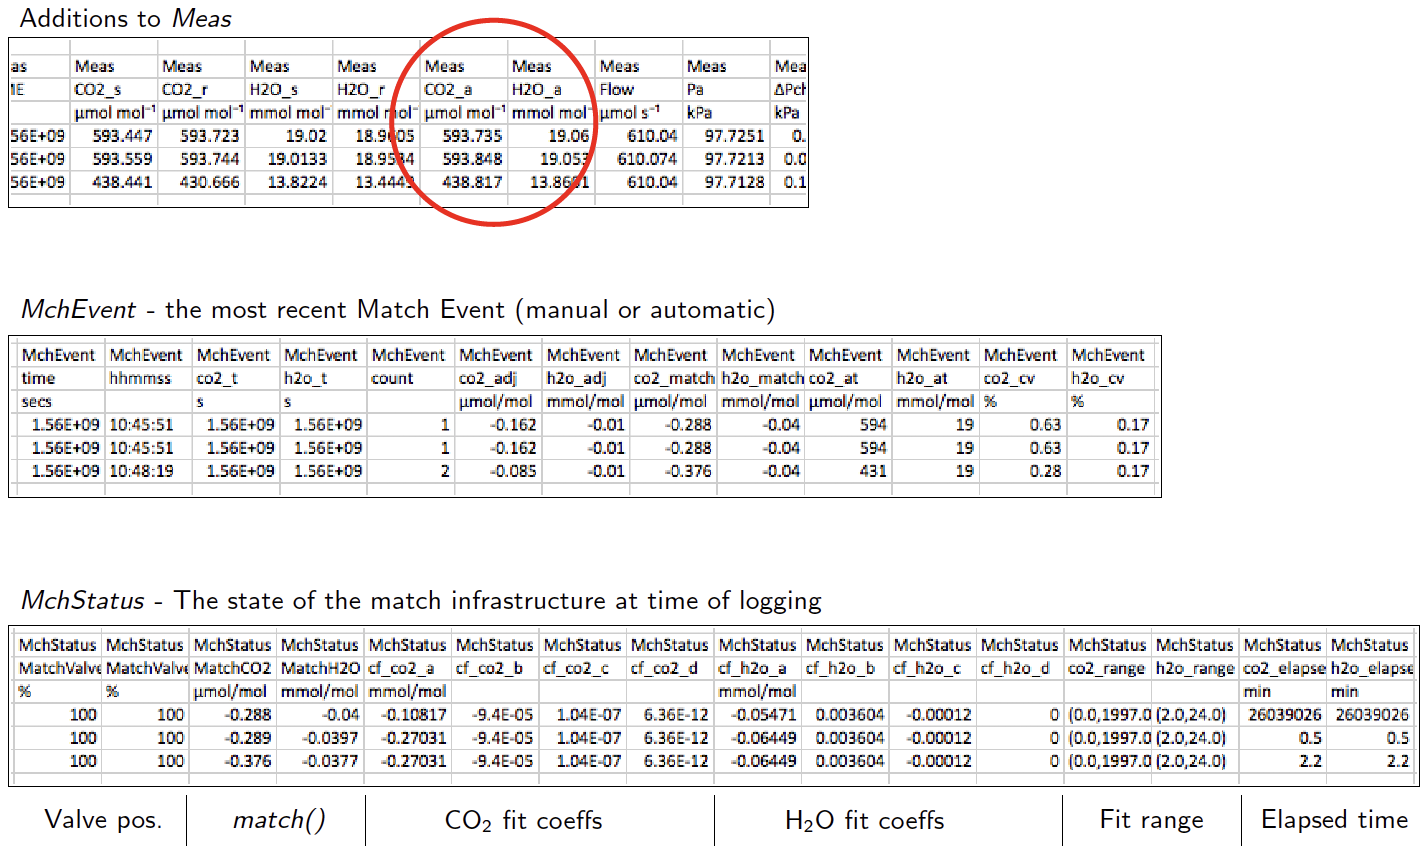
Version 1.4 has some changes to what is stored in data files to accommodate the new matching infrastructure:
- The group Match has been replaced by MchEvent ("match event").
- New group: MchStatus ("match status").
- MchStatus and MchEvent are always in data files, whereas the old Match group was optional.
- The variables CO2_a and H2O_a have moved from group Meas2 to Meas, so are always present in data files.
Range match information storage
The data set created during range matching is specific to the head. When it is stored, it is associated with the head serial number that collected the data set. But the data set is stored on the console. Therefore, if you attach a different head to a console, you'll need to collect a new range match data set for that head.
Suggested range match protocol
Now that we've covered the important details regarding range matching, here is a recommended match protocol.
- Acquire range match data for CO2 and H2O.
- If the values are not small, or if there is a significant slope to the data, zero and span as necessary and check again. Doing this will minimize the need for matching. The range match values should be as small as possible.
- Take care of whatever residual corrections there are by implementing range matching.
- This should eliminate the need to rematch because of the concentration changes (i.e., any slope in the range match data).
- Consider setting the H2O matching log option to Never.
- Here's why: During a measurement, it is often the case that the reference air is fairly dry, and the sample air wet. The proper match correction is the one at the sample concentration, not the reference. Range match provides the right correction, point match doesn't. Further, a point match is not only at the "wrong" concentration, but getting there and back can involve some long equilibration times for the sample cell, and not waiting long enough will give you the wrong correction at the wrong concentration. Avoid all that and use range matching.
- For CO2, implement range matching, and periodically do a point match if temperatures are changing.
Match failure message
When a match fails for some reason besides being cancelled by the user, a message is left on the upper right of the display. The message will persist until another match is started.
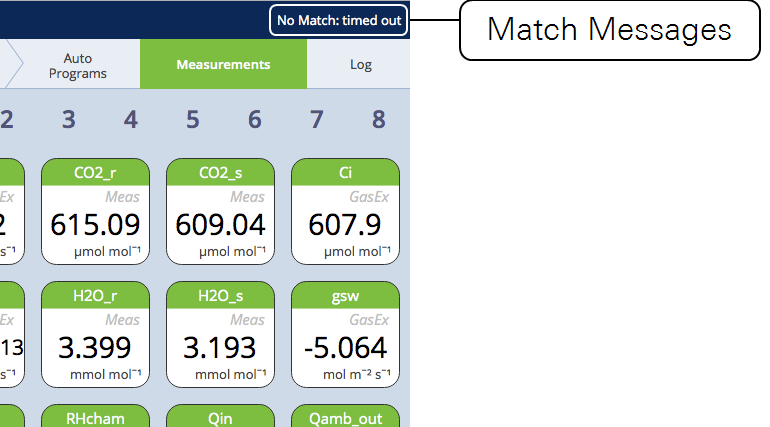
If CO2 was matched but H2O wasn't, or vice versa, the message will indicate that (e.g., "No CO2 match: timed out"). The other condition that can generate a message is low flow ("No Match: Flow too low").