Volume, flow, and mixing in open photosynthesis systems
Authors: LI-COR, Inc.
Correspondence: envsupport@licor.com
Published: 2021
Instruments: LI-6800
Keywords: mixing, volume, flow rate
Abstract
Open gas exchange systems for leaf-level photosynthesis measurements include a volume that encloses the leaf and a volume that connects the leaf chamber to a gas analyzer. The characteristics of this arrangement contribute to the overall system performance. The LI-6800 provides three features that optimize this arrangement: a well- mixed volume of air in the chamber, an optimal flow rate through the system, and direct coupling of the chamber to the gas analyzer. Below we show that the total gas transport along the flow path is a better indicator of system performance than washout time alone.
The exponential dilution model, which is derived from the mass balance of a continuous stirred tank reactor (CSTR), describes concentration dynamics in a well-mixed volume as it changes in response to a change in input concentration. The exponential dilution model can be written to solve for concentration at time t (Ct) during the step change as:
1

Where Cin is the incoming gas concentration, C0 is the initial concentration in the mixing volume, F is volumetric flow and V is the volume. A useful parameter is the mean residence time (τ) which describes how quickly the mixing volume responds to changes in the incoming concentration. The mean residence time is defined as:
2

E(t) is the residence time distribution function. The residence time distribution function can change depending upon system or chamber characteristics, but the mean residence time is a useful parameter describing the average time that air is in the leaf chamber.
Whether considering the full model or simply the washout time, it is clear that both volume and volumetric flow rate are important in defining how quickly the mixing volume responds to a step change.
In a hypothetical system with a flow rate of 500 cm3 min‑1 and volume of 14 cm3, the expected chamber washout time is a little less than 2 seconds. For the LI-6800 with the 6800-01A, where the maximum chamber flow rate at STP is 2200 cm3 min-1 and the chamber volume is a bit less than 80 cm3, the washout time is just over 2 seconds. This gives the impression that comparable washout times imply comparable system-level response times. However, the washout time neglects the inherent system-level delays due to gas transport along the flow path.
Although washout time describes what is happening in the mixing volume as a step change is applied, it doesn’t describe when those concentration dynamics are seen by the sample gas analyzer. This is controlled by transport through system tubing along the flow path, and subsequently, the arrangement of the system flow path.
Some photosynthesis systems have gas analyzers that are in the instrument console, separated from the chamber by a length of tubing. For a 1.5-meter-long tubing assembly (and ignoring any additional tubing in the sensor head and console) with an internal diameter of 3 mm and a flow rate of 500 cm3 min-1, the inherent delay between the chamber and the sample gas analyzer would be about 5 seconds. This is likely an underestimate of the true delay, because it does not include sensor head or console tubing, which will certainly contribute to the delay time.
For the LI-6800, the sample gas analyzer is placed close to the air outlet from the chamber in the sensor head, so that the delay between the gas analyzer and the chamber is minimized. At the maximum flow rate and accounting for all the volume between the gas analyzer and chamber exhaust, the LI-6800 is expected to have a delay of about 0.3 seconds.
Most modern photosynthesis systems make a differential measurement between two separate gas analyzers, measuring the concentration before and after the chamber. As such, when considering time response of the system for characterizing a step change in concentration, it is not just the delay between the chamber and sample gas analyzer that matters. Here the total delay is that between reference and sample analyzers. For systems that use a serial flow path (Reference IRGA -> chamber -> Sample IRGA), the expected total delay can be approximated by a summation of the individual delays and the washout time for the chamber. Here we use three times the washout time (95% of response) to approximate the chamber delay, giving an expected system-level delay of about 15 seconds for the example system of this design.
The LI-6800 uses a parallel flow path, where the total system flow is split just before the chamber. In this arrangement, the expected delay is approximated by the difference in the delays between the flow split and the reference analyzer versus that of the sample analyzer. Given the minimal separations between the components along the flow path and the parallel arrangement, the approximate total delay in the LI-6800 is in actuality controlled almost entirely by the washout time of the chamber. Here again, using three times the washout time, the expected system-level delay is around 6 seconds.
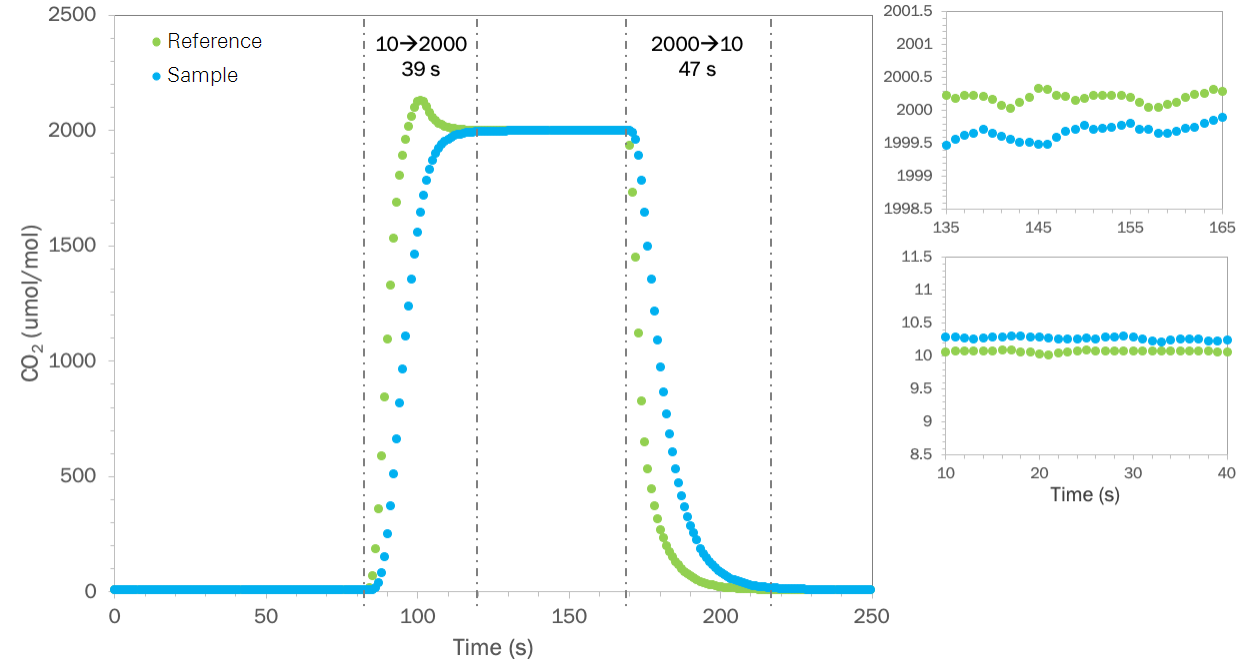
These expected delays set a best case for response in the system when applying a step change in the incoming concentration, as they inherently assume that the incoming concentration change is instantaneous. In practice, it is unlikely that this assumption is ever met, and the realized response to a step change in concentration is compounded by how the step change is generated. If the step change is implemented using the instruments’ integrated CO2 control system, as would be the case for real leaf level measurements, then the response time becomes the combined effects of the system flow delays, the performance of the CO2 control system, and the interaction between the two. In practice, it is nearly impossible to provide a simple mathematical approximation for this interaction. We can however, provide real data demonstrating the performance of the LI-6800 and use it to provide a basis of comparison in how the control/flow interaction may compound the system delays.
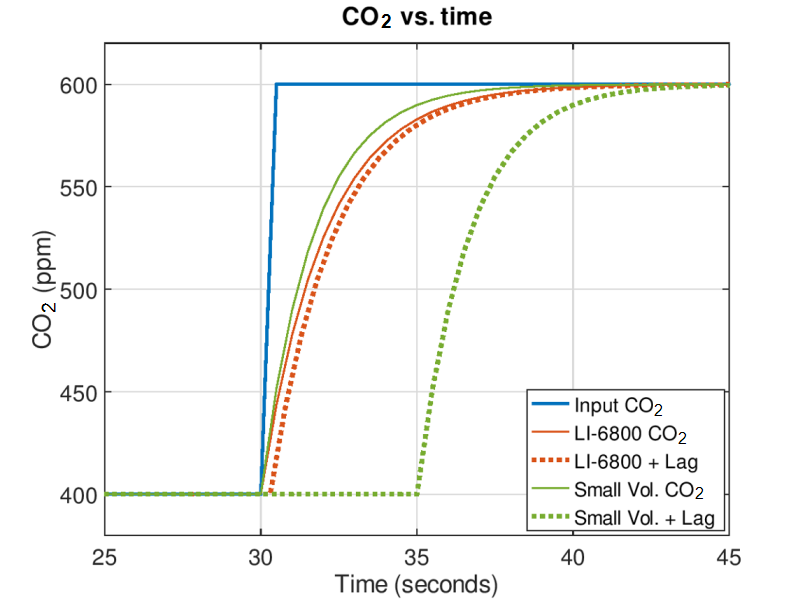
The data shown in Figure 2 were collected using reference CO2 control, a chamber flow rate of about 875 cm3 min-1 and was done without matching the gas analyzers at either endpoint. At that flow rate the expected system delay, following the previous analysis, is roughly 17 seconds for the LI-6800 with a 6800-01A. In an example system with a serial flow path and with CO2 control that works equally as well as that in the LI-6800, while operating at a comparable flow rate relative to its specified total flow as in the above experiment, we should expect the same step changes to take roughly 1.5 minutes.
At a constant incoming gas concentration, as is typically the case for any steady state leaf level measurement, the delays described above have little to do with the system response time with respect to characterizing what the leaf is doing in the chamber. Here, the response time is controlled by turbulence in the chamber volume and by the chamber to sample analyzer flow delay. In the LI-6800, a fan inside the chamber creates highly turbulent air in the chamber and the flow from this fan completely controls the chamber mixing time. Mixing time can be approximated analogously to the washout time constant but considers all turbulent flow in the chamber, not just the flow rate through the chamber as with the washout time. Here, the fan generates turbulent flow in the chamber of approximately 80,000 cm3 min-1 at STP and its nominal rotation speed (10,000 min-1), resulting in an expected mixing time of about 0.06 seconds for the 6800-01A. This mixing time suggested that leaf-induced changes in the chamber are detected in near real time in the LI-6800, with the expected delay controlled almost entirely by the chamber-to-sample analyzer flow delay (~0.3 seconds). Assuming a comparable mixing time in the example system with a serial flow path, there too the instrument’s ability to temporally resolve what the leaf is doing is also controlled by the chamber-to-sample delay. Which, as shown in Figure 2, is at least 5 seconds for this design.
Essentially, flow delay that occurs between the leaf chamber and the sample IRGA means that changes that are occurring in the leaf chamber are not detected until several seconds after they occur. As seen in the figure, this means that after a change in the input CO2 occurs, a user of a small volume, IRGA-in-the-console system will be unaware of such a change for several seconds, unlike a system such as the LI-6800 where the changes in the leaf chamber will be nearly instantaneously seen by the sample IRGA. This, in turn, has implications for other factors that govern system performance, especially control loops that rely on feedback from the sample IRGA, such as control of sample (leaf) chamber CO2 levels or water vapor controls such as chamber relative humidity or leaf vapor pressure deficit (leaf VPD). Flow delay essentially reduces the speed and responsiveness of such controls, which negatively impacts overall system performance.
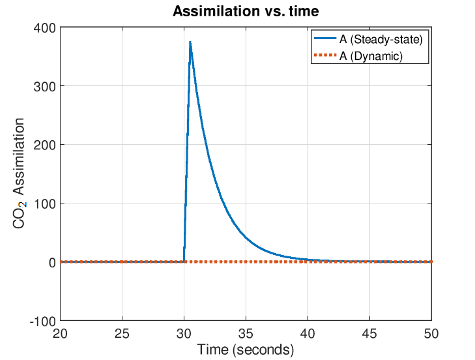
While minimizing flow delay is good system design, it is also necessary for accurate measurements under dynamic chamber conditions where steady-state measurements are not possible. A measurement approach, termed the Dynamic Assimilation™ Technique (DAT), was pioneered and developed by LI-COR and allows for gas exchange measurements to be made when conditions in the leaf chamber are not at steady-state. For instance, applying DAT to the empty-chamber step change simulation above results in the true assimilation value of zero being correctly calculated during the entire time. DAT values stand in contrast to the steady-state assimilation values which show a non-zero apparent assimilation rate until chamber conditions once again reach steady-state (Figure 3). Thus, DAT adds new measurement capabilities to the LI-6800 as well as reducing or eliminating response characteristics related to chamber volume and flow rate.