Gas analyzer diagnostics
Diagnostic information can help identify performance issues with the gas analyzer.
Diagnostic value in data files
The cell diagnostic value is a 2 byte unsigned integer (value between 0 and 8191) with the following bit map. See Gas analyzer diagnostics in EddyPro to learn how these are treated in data processing.
| Bit | Name | Description |
|---|---|---|
| 0 to 3 | Signal Strength | Value × 6.67 = Signal Strength. |
| 4 | Sync | 1 = OK |
| 5 | PLL | Phase lock loop, 1 indicates that optical wheel is rotating at the correct rate. |
| 6 | Detector | 1 = Detector temperature is near setpoint 0 = Detector temperature is not near setpoint |
| 7 | Chopper | 1 = Chopper wheel temperature is near setpoint 0 = Chopper wheel temperature is not near setpoint |
| 8 | Differential pressure sensor OK | Check range: 1 (Good) = 0.1 to 4.9V 0 = Out of range |
| 9 | Aux input OK | 1 = Internal reference voltages OK. 0 = Internal reference voltages not OK. Analyzer Interface Unit needs service. |
| 10 | Tinlet OK | 1 = thermocouple OK 0 = thermocouple open circuit |
| 11 | Toutlet OK | 1 = thermocouple OK 0 = thermocouple open circuit |
| 12 | Head detect | Sensor head attached to LI-7550. 1 = LI-7200RS |
| 13 | Unused, always reads 0 | |
| 14 | Unused, always reads 0 | |
| 15 | Unused, always reads 0 |
Example: A value of 8061 (0001111101111101 in binary) indicates Chopper not ok, and Signal Strength = 87% (1101 is 13 in binary, times 6.67).
CO2 signal strength
The raw reference signals Aco and Awo (for CO2 and H2O, respectively) can be used for diagnostic purposes. Aco and Awo are insensitive to CO2 and H2O concentrations, so if they are reduced, for example, it could be due to obstructions (dirt, precipitation, etc.) in the optical path. The values of these signals by themselves is not very informative: all you are guaranteed of is that they will be somewhere between 0 and 65535, but more typically between 25000 to 50000. To get a useful diagnostic out of Aco and Awo, one needs to know the expected value for a particular instrument when everything is clean and normal. If Acx is the maximum expected value for Aco, and Awx the maximum expected for Awo, then we could calculate a signal strength Sc for CO2, for example, from
8‑1

Sc is on a 0 to 100 scale, where 100 is clean. This value is not ‘clipped’ at 0 or 100, so may slightly exceed 100, especially after signal strength is reset. This simply reflects slight differences from reality of the temperature compensation function f(T), as shown below in equation 8‑4.
The problem with an implementation this simple is that the raw signals are a function of not only the optical throughput (obstructions, source and detector aging, etc.), but also temperature. Unless one accounts for that, the Sc could actually respond to diurnal temperature changes as much or more than contamination changes. Thus, the proper Acx or Awx needs to be a function of temperature. Fortunately, we characterize this response at the factory as part of the factory calibration of each individual unit, which allows us to use the following formulations for signal strengths for CO2 and H2O:
8‑2

8‑3

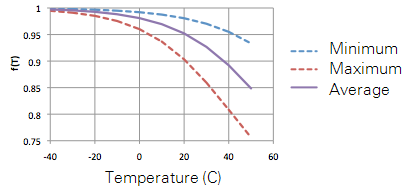
where Cx is the maximum value of Aco that we would expect from this unit. Wx is the maximum expected value of Awo. The function f(T) is the same for both CO2 and H2O, and characterizes how the raw reference signal varies with temperature, Tblock, in degrees C.

Average values of b and c are both 0.05 for the LI-7200RS, but the values for a particular unit are found on its calibration sheet. Figure 8‑4 illustrates this function by showing the range of responses for a large population of LI-7200RS instruments.
The Cx and Wx values are determined at the factory, but they are not really “factory parameters”; they will likely change over time, due to source or detector aging, or even some thin-film contaminant that gets on a window that you just can’t clean off. Thus, the LI-7200RS has provisions for you to easily reset Cx and Wx to values that reflect the reality of your instrument at any point in time. The Calibration button of the Windows software (see Signal strength tab) opens a window with a Signal Strength tab. There you will find a button labeled Reset Signal Strength that you can click if you’ve decided your instrument is as clean as you can reasonably make it, and you want to reset the signal strengths to 100. It does this by using the current values of Awo and Aco and performing the following computations:
8‑5

8‑6

Two signal strength-based values are available from the LI-7200RS when using the Windows interface program.
8‑7

8‑8

The instrument’s grammar also makes the individual values (Sc and Sw) available for output.
Delta signal strength
Why Delta Signal Strength? The concern when checking a source strength diagnostic is “Is the optical cell clean?” However, the bigger underlying concern is “Has the calibration drifted enough to matter?” Signal Strength addresses the first question, but can say nothing about the second.
Calibration shifts will occur due to contamination if the contaminants are not spectrally neutral. That is, if they scatter radiation more (or less) at the reference wavelength than the measuring wavelength. If contamination is spectrally neutral, you could block nearly all the signal (e.g. Signal Strength drops to 10) without affecting the calibration. However, most (all?) contamination is not spectrally neutral, and even worse, if it is highly spectral, very little of it (i.e., small change in Signal Strength) can have a large effect on your calibration.
Delta Signal Strength, since it is the difference in signal strength between the two reference wavelengths, provides an indicator of how spectrally non-neutral contamination is. In fact, if the contamination’s scattering function is linear over the range of wavelengths used by the LI-7200RS (2.4 to 4.2 microns), then Delta Signal Strength would directly predict the calibration shift. If it is non-linear, however, it would over- or under-predict. As an approximate guide, however, the following relations are offered:
8‑9

8‑10

These assume contamination with a linear spectral response. As a practical matter, you should experiment at your installation to see if there is a consistent relation between Delta Signal Strength and calibration shift.
Transfer functions and signal processing
The LI-7550 Analyzer Interface Unit used with the LI-7200RS has a Digital Signal Processing (DSP) bandwidth that is selectable in the Outputs > Setup window.
A plot of the transfer functions for the 3 selectable DSP bandwidths is shown below in Figure 8‑5. Care was taken in the design of the DSP filters to ensure that the transfer functions have a very flat passband.
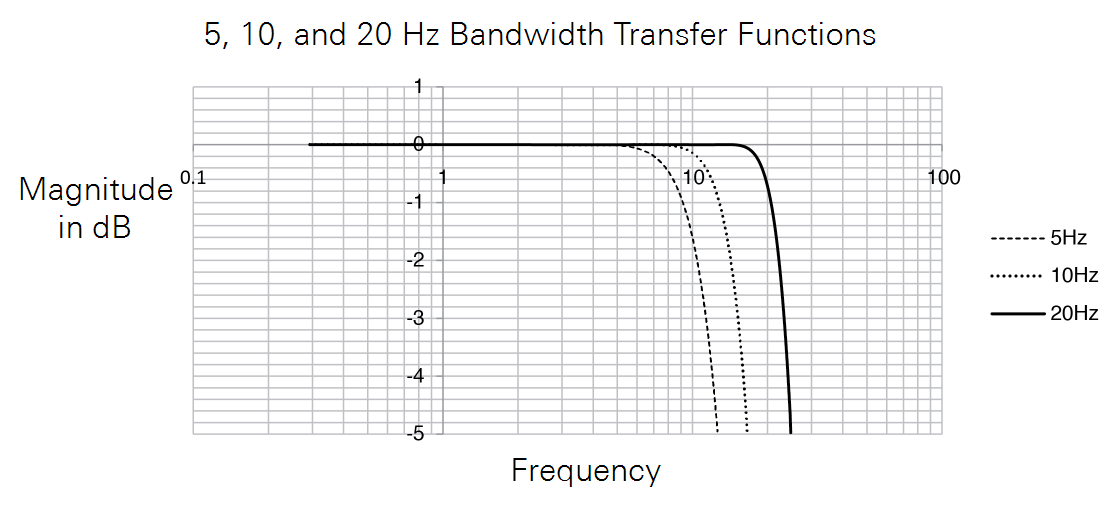
The analog signal conditioning that occurs before the DSP filtering is fixed and may cause a small amount of additional attenuation.
The frequency response of the LI-7200RS will be a combination of the optical cell frequency response multiplied by the signal processing frequency response (bandwidth setting). With air flow rates of 15 liters/minute the signal processing bandwidths of 5 Hz or 10 Hz should be used. A signal processing bandwidth of 20 Hz is more appropriate if a higher air flow rate is used.