Printable PDF: Why Does the LI-7200 AGC Signal Change After Cleaning the Optical Cell?
This content as a pdf that can be saved to your computer or printed.
The LI-7200 Enclosed CO2/H2O Analyzer is designed to enable field cleaning of the optical windows. Cleaning the windows removes any accumulated dirt or dust that reduces the optical signal being measured. Complete cleaning instructions are described in the LI-7200 instruction manual at:
https://licor.app.boxenterprise.net/s/k8b90wiwdhietarx04qd
Typically, after cleaning, the variables used for indicating optical signal (AGC in ver. 6.0 and below, and Signal Strength in ver. 6.5 & above) will improve. Cleaning the optical windows under certain conditions can cause the AGC or Signal Strength to deteriorate. This is a result of the exposure of the optical detector, located behind the top window of the optical cell, to a dosage of Ultraviolet (UV) light during the cleaning procedure. This exposure reduces the signal throughput of the system across all wavelength channels.
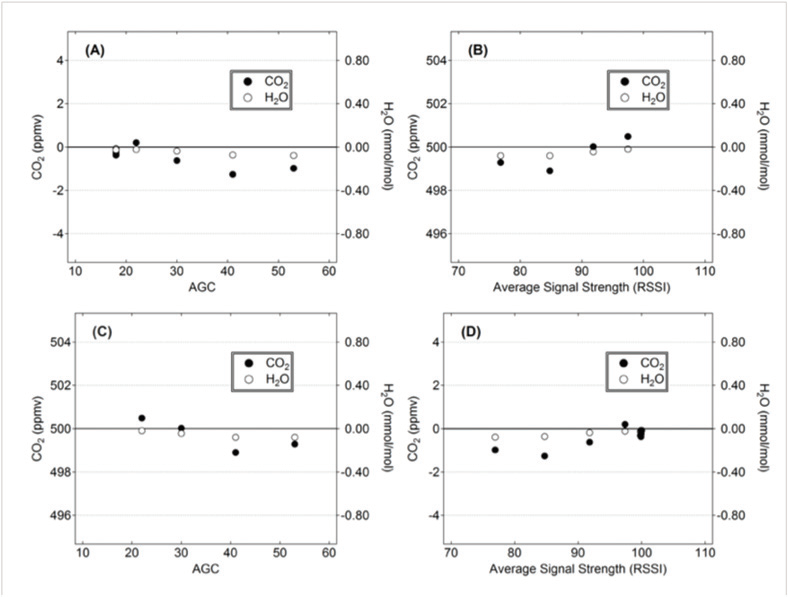
This deterioration of the optical signal indicator does not cause an error in the analyzer measurement, because the LI-7200 measures light absorption of CO2 and H2O molecules using a ratio of the sample and reference optical channels. Figure 1‑1 (A through D) shows typical instrument performance after exposure to UV light using a UV LED. The analyzer performance does not appreciably change, even after a 30% deterioration in the optical signal indicator.
After the instrument is exposed to a dosage of UV, it may take several weeks for the optical signal indicator to recover to preexposure levels, but it will eventually do so. To accelerate the signal indicator recovery, turn the instrument off (remove power) for 3 to 4 days.
To avoid optical signal indicator deterioration under UV light, simply cover the top optical window after opening the LI-7200 cell for cleaning. This can be achieved by putting any nonreflective material over the top window. This material can be a plastic plug, a dark cloth or simply covering the window with a thumb. Clean the bottom window first while keeping the top window covered, and then proceed to clean the top window (there is no need to cover the bottom window while cleaning the top). Alternatively, the instrument could be opened for cleaning under low UV light conditions.