Printable PDF: EC Site Check Routine
Instructions for EC Site Check.
Most eddy covariance (EC) systems are deployed in remote areas and exposed to harsh environmental conditions. During years-to-decades of continuous operation, potential issues related to contamination, power, animal damage, lightning, and other natural events such as fog and precipitation could arise. Aging of the hardware and out-of-date software can also become issues. In order to minimize data loss, routinely checking your EC system should be part of your maintenance plan. Considering time consumption and effectiveness, here are our recommendations:
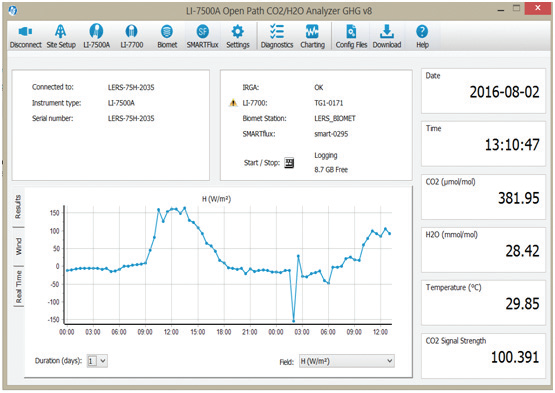
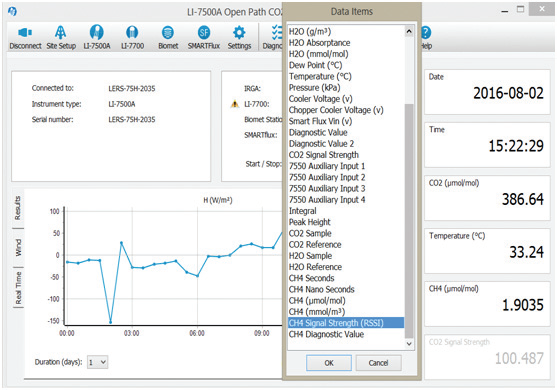
- Check CO2, H2O and CH4 (if applicable) mole fractions, air temperature, air pressure, and analyzer signal strength as often as possible through the GHG Windows interface software, as shown below. This can be done remotely or at the field site. The CO2 and CH4 mole fractions should be near ambient during the daytime. Analyzer signal strengths for LI-7500A/RS/LI-7200/RS’s should be between 80 and 100 (or slightly over 100) and the LI-7700 signal strength should be greater than 20. Although CH4 data are valid when LI-7700 signal strength is above 10, it is better to resolve the low signal strength (for example, cleaning the mirrors) before it reaches the lower threshold.
-
-
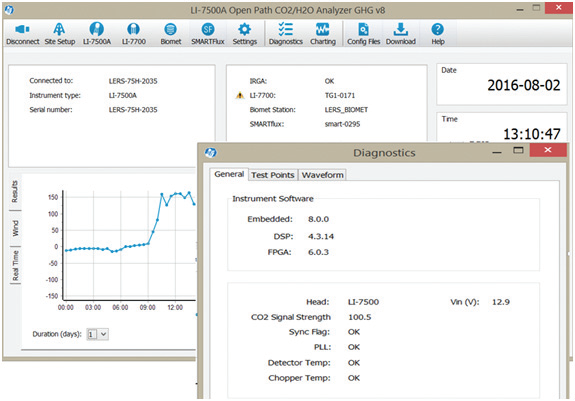
- Check for warnings on the main and diagnostics pages as often as possible. A warning symbol shows that the component is in need of attention. In the example below, the warning on the LI-7700 indicates the connection between the LI-7550 analyzer interface unit and the LI-7700 CH4 analyzer has dropped. In the “Diagnostics” window, if “SERVICE” is indicated instead of “OK”, there is a problem with the CO2/H2O gas analyzer system.
-
- Check time series data from individual raw data files. Download raw data at least monthly if possible. Follow the steps below to open a single “.ghg” file (half-hour of data) to check: a) sampling rate by looking at the time stamps and total number of records, b) values of the variables, and c) variances of the variables. If your sampling rate is too low, you will not be able to get accurate fluxes.
-
- Copy and paste the last (i.e. the newest) ghg file to a different folder.
- Rename the file extension name from “.ghg” to “.zip”.
- Select the newly renamed zip file, right click your mouse, and use the “Extract All…” function to unzip the file.
- Open the “…AIU-xxxx.data” file in the unzipped folder using a spreadsheet program like Excel, in comma-delimited format.
- Check multiple “.ghg” files using LI-COR’s LI-7x00 File Viewer for spikes, gaps, trends, and other anomalies. The File Viewer software can look at months of data instantly.
- Check flux results for any anomalies. Process raw data as soon as possible using EddyPro (for Windows, or for MAC. If you have a SmartFlux device, you can skip the raw data processing and check flux results directly by looking at the flux daily summary files.
If you see problems and cannot solve them by yourself, please contact LI-COR Technical Support.