Gas analyzer diagnostics
Diagnostic information can help identify performance issues with the gas analyzer.
Diagnostic value in data files
The cell diagnostic value is a 1 byte unsigned integer (value between 0 and 255) with the following bit map. See Gas analyzer diagnostics in EddyPro to learn how these are treated in data processing.
| Bit | Name | Description |
|---|---|---|
| 0 to 3 | Signal Strength | Value × 6.67 = Signal Strength. |
| 4 | Sync | 1 = OK |
| 5 | PLL | Phase lock loop, 1 indicates that optical wheel is rotating at the correct rate. |
| 6 | Detector | 1 = Detector temperature is near setpoint 0 = Detector temperature is not near setpoint |
| 7 | Chopper | 1 = Chopper wheel temperature is near setpoint 0 = Chopper wheel temperature is not near setpoint |
Example: A value of 125 (01111101) indicates Chopper not ok, and Signal Strength = 87% (1101 binary converted to decimal is 13, times 6.67).
CO2 signal strength
The raw reference signal Aco (for CO2) can be used for diagnostic purposes. Aco is insensitive to CO2 and H2O concentrations, so if it is reduced, it could be due to obstructions (dirt, precipitation, etc.) in the optical path. The value of this signal by itself is not very informative: all you are guaranteed of is that it will be somewhere between 0 and 65535, but more typically between 25000 to 50000. To get a useful diagnostic out of Aco, one needs to know the expected value for a particular instrument when everything is clean and normal. If Acx is the maximum expected value for Aco, then we could calculate a signal strength Sc for CO2 from
8‑1

Sc is on a 0 to 100 scale, where 100 is clean. This value is not ‘clipped’ at 0 or 100, so may slightly exceed 100, especially after signal strength is reset. This simply reflects slight differences from reality of the temperature compensation function f(T), as shown below in 8‑3.
The problem with an implementation this simple is that the raw signals are a function of not only the optical throughput (obstructions, source and detector aging, etc.), but also temperature. Unless one accounts for that, the Sc could actually respond to diurnal temperature changes as much or more than contamination changes. Thus, the proper Acx needs to be a function of temperature. Fortunately, we characterize this response at the factory as part of the factory calibration of each individual unit, which allows us to use the following formulation for signal strength for CO2:
8‑2

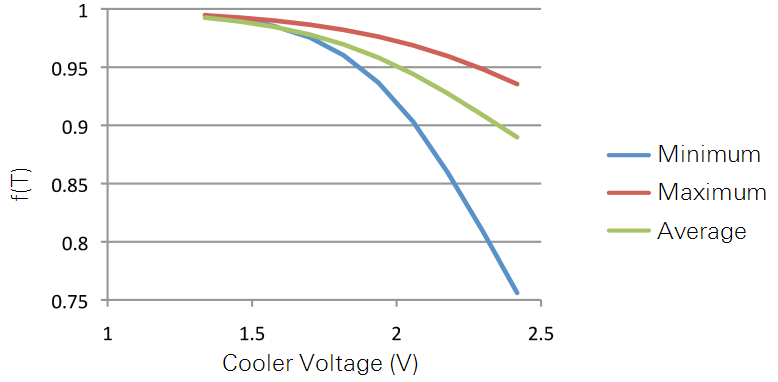
where Cx is the maximum value of Aco that we would expect from this unit. The function f(T) characterizes how the raw reference signal varies with cooler voltage, V:

Average values of b and c are 1.6 and 3.2, but the values for a particular unit are found on its calibration sheet. Figure 8‑2 illustrates this function by showing the range of responses for a large population of LI-7500RSs.
The Cx value is determined at the factory, but it is not really a “factory parameter”; it will likely change over time, due to source or detector aging, or even some thin-film contaminant that gets on a window that you just can’t clean off. Thus, the LI-7500RS has a provision for you to easily reset Cx to a value that reflects the reality of your instrument at any point in time. The Calibration button of the Windows Interface program (see User calibration) opens a window with a Signal Strength tab. There you will find a button labeled Reset Signal Strength that you can click if you’ve decided your instrument is as clean as you can reasonably make it, and you want to reset the signal strength to 100. It does this by using the current value of Aco and performing the following computation:
8‑4

A signal strength-based value is available from the LI-7500RS when using the PC software. The instrument’s grammar also makes Sc available for output.