Printable PDF: Measuring Evapotranspiration with LI-COR EddyFlux Systems
Measuring Evapotranspiration with the Eddy Covariance Method.
Introduction
The largest flow of material in the biosphere is the movement of water through the hydrologic cycle (Chahine, 1992). The transfer of water from soil and water surfaces through evaporation and the loss of water from plants through stomata as transpiration represent the largest movement of water to the atmosphere. Collectively these two processes are referred to as evapotranspiration (ET).
On a global scale, about 65% of land precipitation is returned to the atmosphere through evapotranspiration (Trenberth, 2007). Evapotranspiration is important to water management, endangered species protection, and the genesis of drought, flood, wildfire, and other natural disasters. In addition, ET, when thought of in terms of energy as latent heat flux, consumes about 50% of the solar radiation absorbed by the earth’s surface (Trenberth, 2009). This influences both climate and hydrology at local, regional, and global scales. Accurately measuring ET is very important for these reasons.
Method
Evapotranspiration can be difficult to measure because it is affected by a variety of environmental factors, including solar radiation, air temperature, wind speed, and humidity (Drexler, 2004). There are several methods for measuring ET, such as lysimetry, eddy covariance, scintillometry, the Bowen ratio, the crop coefficient approach, and remote sensing. Eddy covariance is the most direct and widely used method (Jung, 2010). Using high-speed measurements of 3-dimensional wind speeds and water vapor mixing ratio (or density) ET is computed with:

where ρ is dry air density, w is vertical wind speed, and q is water vapor mixing ratio (water vapor mass divided by dry air mass). The over bars represent means; primes stand for deviations.
The eddy covariance technique has four prominent advantages compared with other methods:
- In situ, providing direct measurements of ET and sensible heat flux
- Minimal disturbance to the region of interest
- Measurements are spatially averaged over a large area
- Systems are automated for continuous long-term measurements
Instruments
The basic instruments required for eddy covariance measurements include a water vapor analyzer and a sonic anemometer (Figure 1‑1), both of which must be capable of making high frequency measurements. The H2O analyzer measures water vapor density, while the anemometer measures 3-dimensional wind speeds and directions. Measurements are typically made at 10 Hz (10 times per second) or faster in order to catch fast-moving eddies.
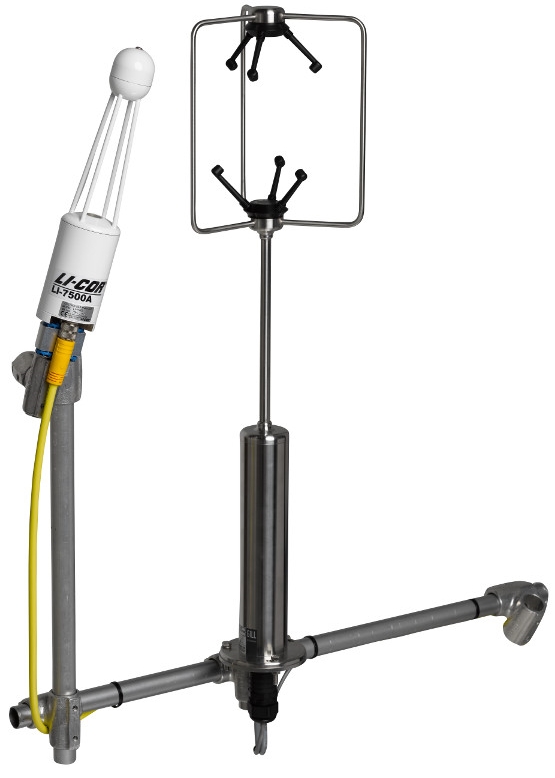
The LI-7500A/RS Open Path CO2/H2O Analyzer is an excellent choice for measuring ET because air moves freely through its open measuring volume. It requires only 12W to operate. Several models of Gill sonic anemometers are available directly from LI-COR. Compatible anemometers are also available from other manufacturers, including Campbell® Scientific, Inc., RM Young Company, Metek and Kaijo-Denki.
In addition, biological and meteorological (Biomet) sensors such as a net radiometer, soil heat flux plates, and precipitation gauge can be used for flux measurement validation through energy balance closure, gap-filling, and interpreting the flux results.
Data collection
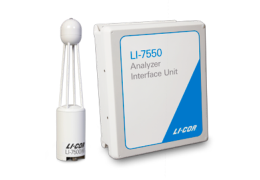
The LI-7550 Analyzer Interface Unit is the system controller for LI-COR eddy covariance systems. It provides control hardware for the CO2/H2O analyzer, inputs for the sonic anemometer data stream, integrated air pressure and temperature sensors, and a 16 GB USB drive for data storage. It is the hub of a complete eddy covariance system for measuring ET.
The eddy covariance system is configured through Windows® software. The high frequency 10-Hz raw data are logged automatically to a 16 GB USB drive or to a computer through the Ethernet or RS-232 connection. Biological and meteorological data also are logged to the USB drive through an optional Biomet station. The USB drive can hold several months of raw data for ET calculations.
Data processing
The data logged to the LI-7550’s USB drive are stored in .ghg formatted files, a compressed data format optimized for processing by the SmartFlux® System and EddyPro® Software. The SmartFlux System runs EddyPro to compute fully corrected ET results on site and in real time. The logged data also can be processed on a desktop PC by EddyPro. Both SmartFlux and EddyPro compute ET, sensible heat, Biomet data averages, and other results. Learn more at http://www.licor.com/products/eddy-covariance/
References
| 1 | Burba, G. 2013. Eddy covariance method for scientific, industrial, agricultural, and regulatory applications. LI-COR, Inc. |
| 2 | Chahine, M.T. 1992. The hydrological cycle and its influence on climate. Nature, 359: 373-380. |
| 3 | Drexler J. Z., R. L. Snyder, D. Spano, U.K.T. Paw. 2004. A review of models and meteorological methods used to estimate wetland evapotranspiration. Hydrological Processes, 18; 2071–2101. |
| 4 | Jung M., M. Reichstein, P. Ciais, et al. 2010. A recent decline in the global land evapotranspiration trend due to limited moisture supply. Nature, 467: 951-954. |
| 5 | Trenberth K.E., L. Smith , T. Qian, A. Dai, J. Fasullo. 2007. Estimates of the global water budget and its annual cycle using observational and model data. Journal of Hydrometeorology, 8: 758-769. |
| 6 | Trenberth K.E., J. T. Fasullo, J. Kiehl. 2009. Earth's global energy budget. Bulletin of the American Meteorological Society, 90; 311-323. |