Measurement overview
To measure gases, the analyzer injects laser light into a V-shaped optical cavity defined by mirrors 1, 2, and 3 (Figure A‑1). The mirrors are highly reflective — photons may circulate many times before escaping to strike the sample photodiode. This long effective path-length enhances sensitivity by creating many opportunities for the sample gas flowing through the cavity to absorb light.
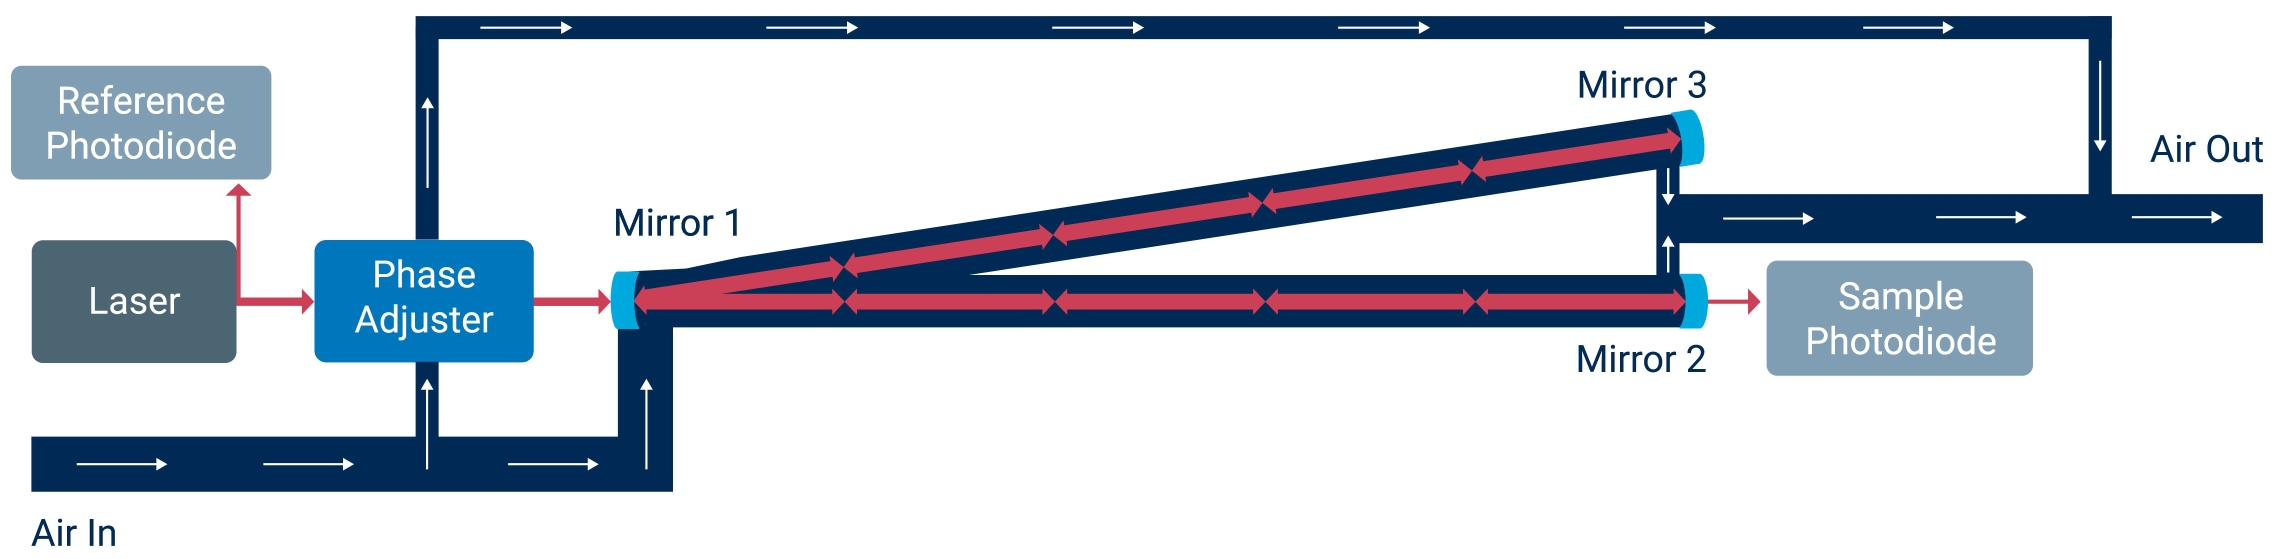
The instrument ramps the laser drive current so the laser scans a range of wavelengths that span absorption features of the gases. A fraction of the photons are allowed to leak from the cavity back into the laser, creating optical feedback that narrows the laser output. This, in turn, couples a large fraction of the laser power to the cavity and locks the laser frequency precisely to the center of a cavity resonance mode.
During a scan, the instrument creates a dense grid of fixed cavity resonance modes that are equally spaced within a few kHz. The laser jumps discretely from one cavity resonance mode to the next.
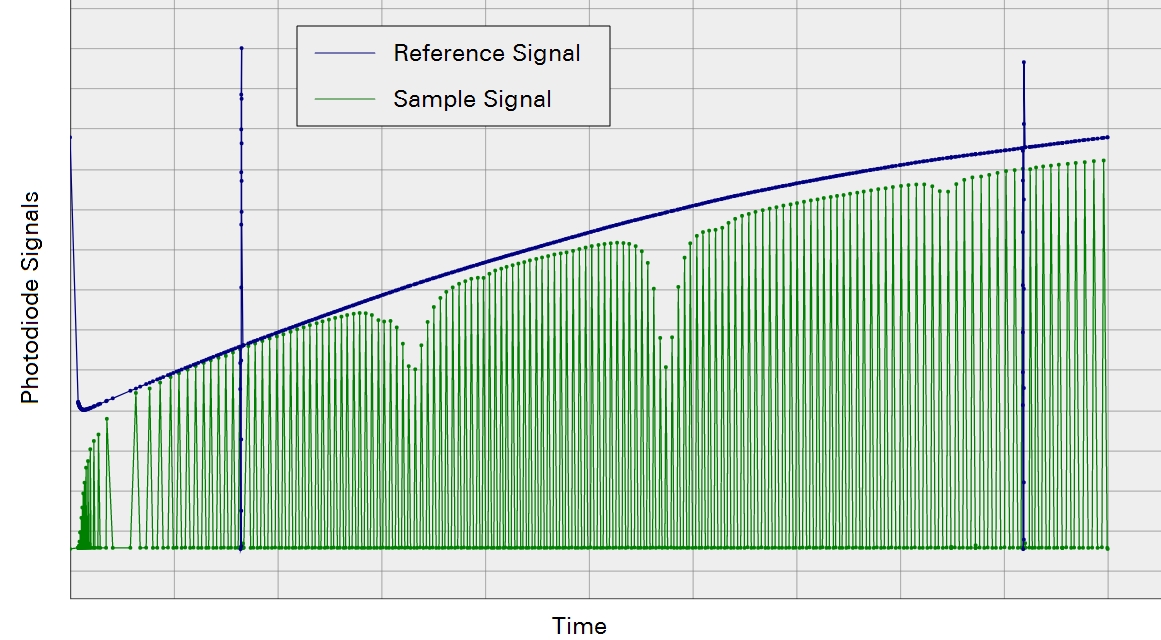
During a measurement, the laser frequency scans across the full spectral range of interest in about 0.25 seconds (see Figure A‑2). It uses the reliably fixed grid spacing in combination with spectroscopic data to determine the exact frequency of each mode. The instrument uses two ring down events—one at the beginning and one at the end of a scan—to normalize the measured signal.
Absorption is computed at each resonance mode by comparing the normalized sample photodiode signal with the reference photodiode signal. The concentration of each gas is then determined by using a fitting algorithm that compares the measured absorption spectrum with internally stored high resolution spectrum.