Measuring net carbon exchange (NCE) and net ecosystem exchange (NEE)
At the ecosystem level, carbon dioxide (CO2) is fixed through photosynthetic carbon metabolism. Fixed carbon is then used for growth and development of plants, and some of the fixed carbon is lost through respiration. Net Carbon Exchange (NCE) is defined as the carbon exchange between an ecosystem and the atmosphere. This is calculated as the photosynthesis uptake minus the total respiration, including above ground respiration and soil respiration. With the smaller 8200-104C chamber, the parameter is best described as NCE when CO2 is measured. With the larger 8200-105C chamber and other gases, the parameter is NEE. In this section, we summarize the computation of NCE using CO2 as an example. NEE for other gases is computed similarly.
NCE and NEE are key variables for understanding the carbon balance of an ecosystem. The parameters can be readily measured over a large uniform field using the eddy covariance method or with clear chambers, such as the 8200-104C Clear Long-Term Chamber for short and small canopies or the 8200-105C Automated Canopy Chamber for taller canopies. If no plants are present inside a clear chamber, then the measured NCE is the soil respiration.
For a clear chamber, the mass balance for CO2 inside the chamber would be (see equation A‑10 for more information);
A‑20

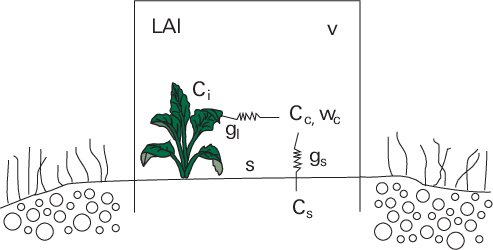
where ρc is the air number density inside the chamber (mol m-3), S is the surface area inside the chamber (m2), and wc is the chamber air water vapor mole fraction (mol mol-1). Cc’ is chamber CO2 mole fraction corrected for water vapor dilution.
For soil CO2 flux fc:
A‑21

Where fc is soil CO2 flux (mol m-2s-1), and all variables have the same definitions as described in the section for opaque chambers.
When you have living plants with leaf area index, (LAI, defined as the ratio of total one-sided leaf area inside the clear chamber to ground area), the CO2 uptake rate via photosynthesis (fp) would be:
A‑22

Where fp is the photosynthesis rate (mol m-2s-1), gl is the total leaf conductance (mol m-2s-1) including stomatal and leaf boundary layer conductance, Ci’ is intercellular CO2 mole fraction (mol mol-1), α is Ci/Ca ratio. We assume α to be constant over a wide range of CO2 concentrations (around 0.6 for C3 species, and 0.3 for C4 species) (Wong et al., 1979; Morison, 1987; Xu and Hsiao, 2004).

where Rh is total above-ground biomass respiration. Rearranging equation A‑23, we have
A‑24

Let  and
and 

Equation A‑25 can be integrated to have

Let  , we have

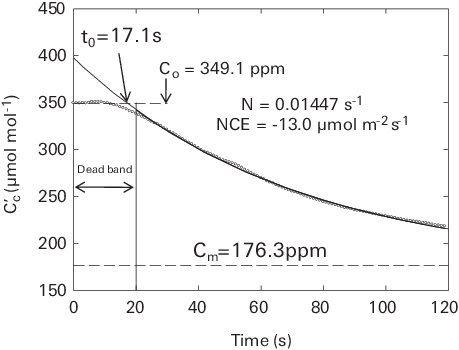
The following equation will be used to fit the time series of Cc’ (see earlier in this section for an explanation of the origin of t0)

Equation A‑25 is exactly the same as equation A‑13 for opaque chambers. For the LI-8250 Multiplexer, we use a generic exponential equation to fit the time series of chamber CO2 concentration. For a clear chamber, when Cm’ < C0’, net carbon uptake is observed. When Cs’ > C0’ from fitted equation A‑25, net carbon release is observed.
The net carbon exchange can then be estimated using equation A‑10, with the information from the initial slope of the time series of Cc’ (equation A‑26). Negative flux values will be reported for the cases of net carbon uptake and positive flux will be reported for the cases of net carbon release. Note that Cm represents the CO2 compensation point at which photosynthesis rate is equal to total respiration rate inside the chamber.
The above derivation involved some assumptions to be able to solve the differential equation A‑26 analytically. Not all assumptions are valid for all cases. For example, we assume stomatal conductance is independent of air CO2 level, which clearly is not the case. The purpose of this exercise is to provide a general view on how the time series of chamber CO2 concentration behaves after the chamber is closed.
The considerations for setting up the configuration (deadband, observation length, observation count, pre-purge) for the clear chamber measurement are the same as for LI-COR opaque chambers (part number 8200-104).
References
Keeling, C.D. (1958). The concentration and isotopic abundances of atmospheric carbon dioxide in rural areas. Geochimica et Cosmochimica Acta, 13(4), pp.322–334. doi:https://doi.org/10.1016/0016-7037(58)90033-4.
Morison, J.I.L. (1987). Intercellular CO2 concentration and stomatal response to CO2. In: Zeiger, E., Farquhar, G.D. and Cowan, I.R. (1987). Stomatal function. Stanford (Calif.): Stanford University Press. pp. 229-251.
Wong, S.C., Cowan, I.R. and Farquhar, G.D. (1979). Stomatal conductance correlates with photosynthetic capacity. Nature, 282(5737), pp.424–426. doi:https://doi.org/10.1038/282424a0.
Xu, L.-K. and Hsiao, T.C. (2004). Predicted versus measured photosynthetic water-use efficiency of crop stands under dynamically changing field environments. Journal of Experimental Botany, 55(407), pp.2395–2411. doi:https://doi.org/10.1093/jxb/erh271.