Configuring the gas analyzer
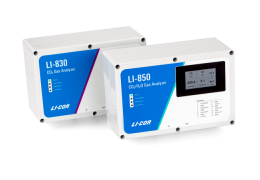
This section describes the basic operating procedures for the LI-830 and LI-850 gas analyzers. This section depends upon the instrument software, which can be downloaded from the LI-COR technical support web site: licor.com/support/home.html.
Overview of the software
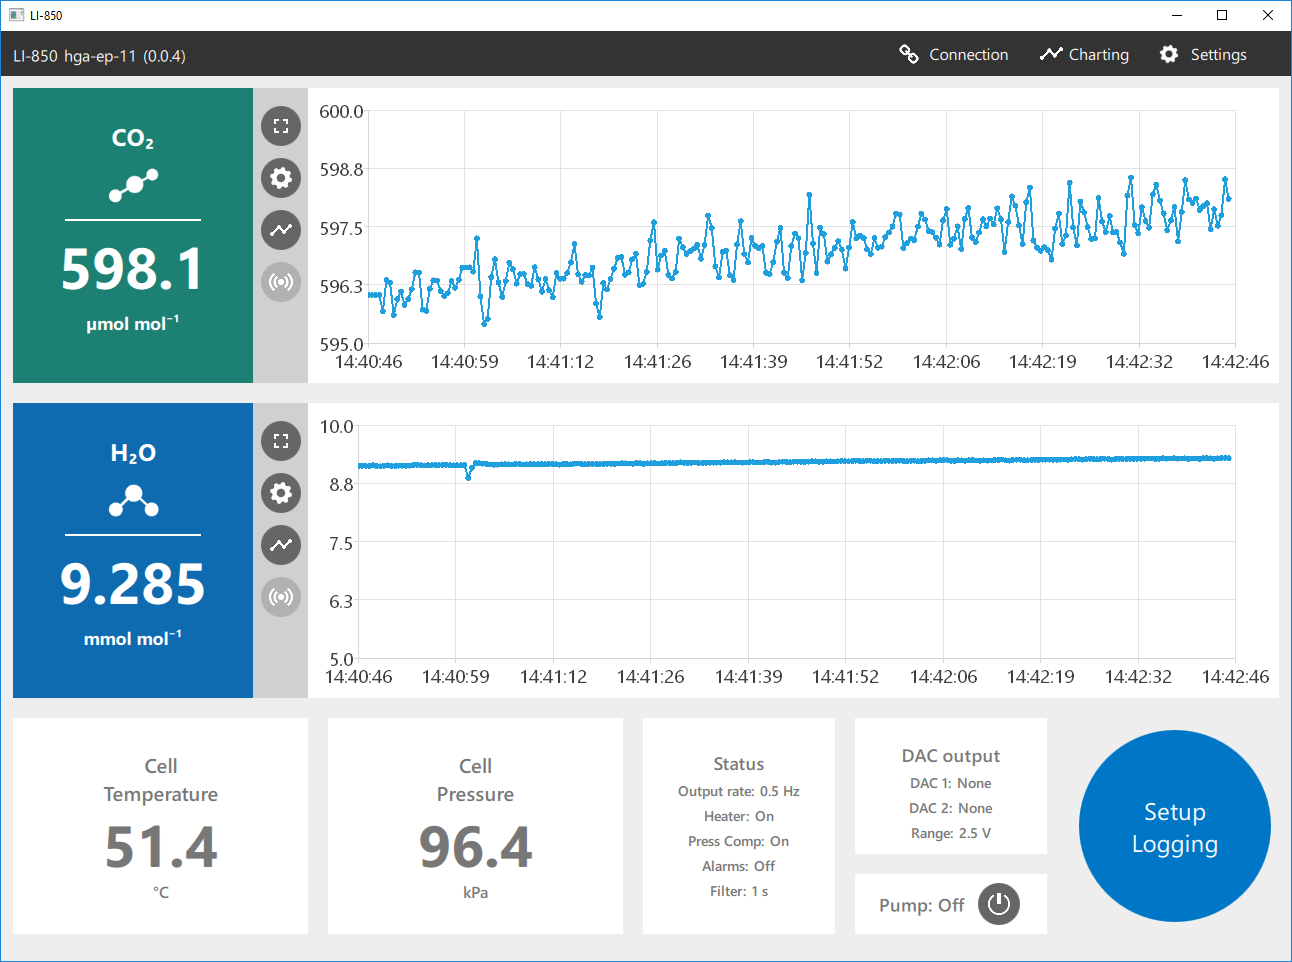
After connecting, the software presents you with live data and graphs. With the LI-830, you'll have CO2; with the LI-850, you'll have both CO2 and H2O.
Configuring graphs
The software will always display a graph on the main page (two with the LI-850), and you can configure the graphs by clicking the Charting button or any of the Chart Settings buttons beside a particular chart. The options available are the same, regardless of how you get to them.
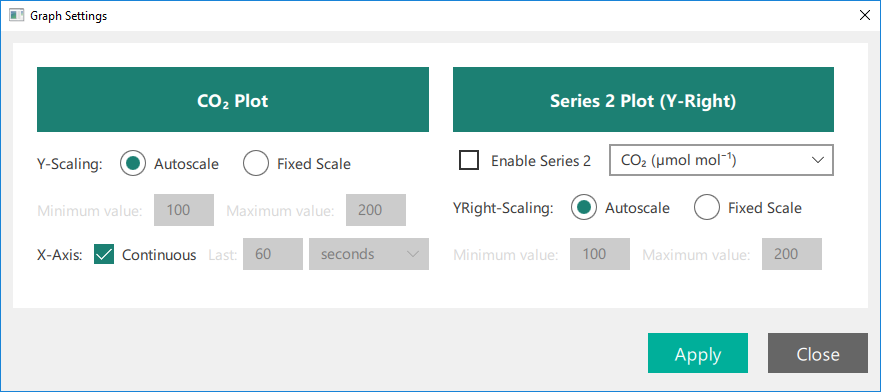
The graphs display a fixed variable: CO2 and H2O with the LI-850. You can configure the settings for each graph and add a second variable. The options are:
Y-Scaling: Choose Autoscale or Fixed Scale. With Fixed Scale, you can set the minimum and maximum value for each variable displayed.
X-Axis: With Continuous checked, the graph will display all of the data from the time you connect to the instrument, rescaling the x-axis when needed. With Continuous cleared, the graph can be configured to display the most recent data for a time period.
Series 2 is an option to plot a second variable on the graph with scaling on the right axis. When checked, you can choose from CO2 concentration, cell temperature, cell pressure, CO2 absorption, or input voltage. With the LI-850, the H2O concentration, H2O dewpoint, and H2O absorption will also be available.
Logging data to a PC
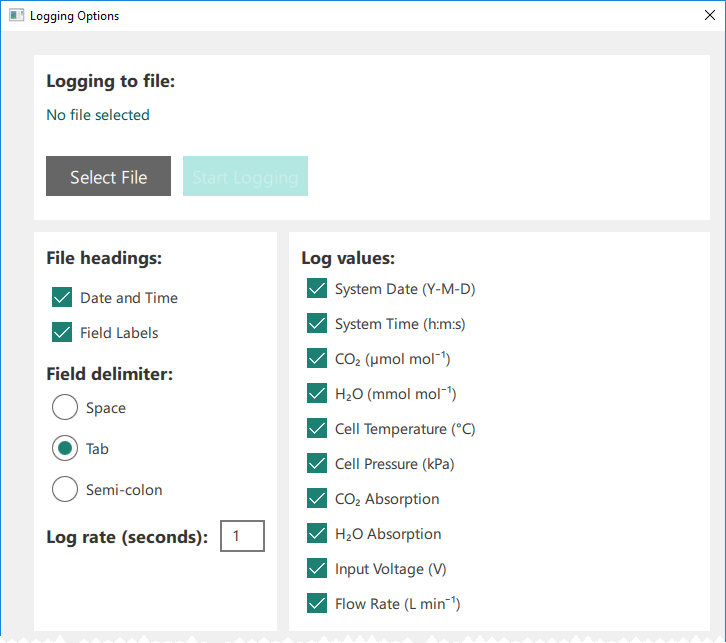
The instrument can log data as a text file, which will be stored to the connected computer. Configure the log file under Settings > Logging Options. To log data:
- Create a file.
- Click Select File, then choose the directory where you want to store the file, and name the file.
- Configure the log parameters.
-
- File headings: When checked, the Date and Time and Field Labels for data columns will be included in the data file header.
- Field delimiter: Choose between a space, tab, or semi-colon delimited text file.
- Log rate (seconds): How often a value is recorded. This can be one measurement per 0.5, 1, 2, 3, 4, 5, 10, or 20 seconds. It is independent of the Filter setting (described in Other options).
- Log values: Select the values you want in the log file.
- Click Start logging.
The instrument will create a text file according to the parameters you set. You can open the logged data in a text editor or most spreadsheet programs.
Instrument settings
Under Instrument > Settings, you'll find the DAC (digital-to-analog) Outputs (0 to 2.5 V, which also enables the 4 to 20 mA output, and 0 to 5 V, which disables the 4 to 20 mA output), and Other Options, including the heater controls, pressure compensation control, pump control, and the digital signal filter. The 4 to 20 mA output is enabled only when the 0 to 2.5 V range is selected.
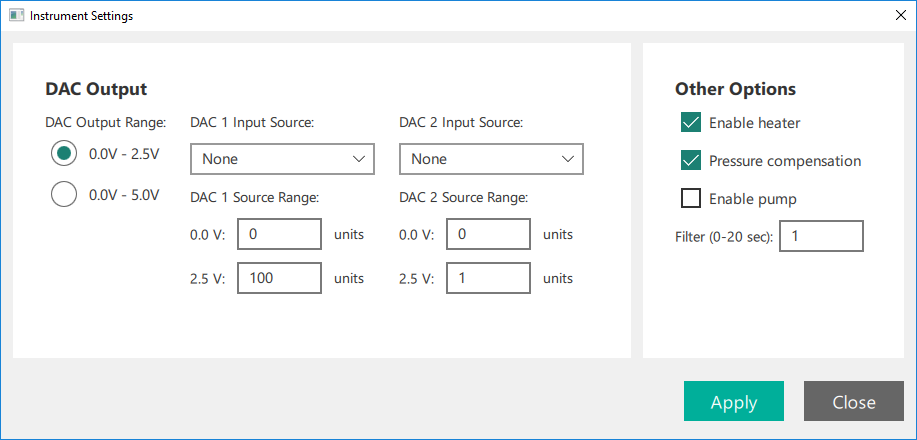
Configuring the DAC outputs
This section describes how to configure the voltage and current outputs. Both voltage and current outputs are configured at the same time, in the same place:
- DAC 1 configures V Out 1 (pin 9) and 4-20 mA 1 (pin 13; only when the 0 to 2.5 V range is selected) on the terminal strip
- DAC 2 configures V Out 2 (pin 7) and 4-20 mA 2 (pin 11; only when the 0 to 2.5 V range is selected) on the terminal strip
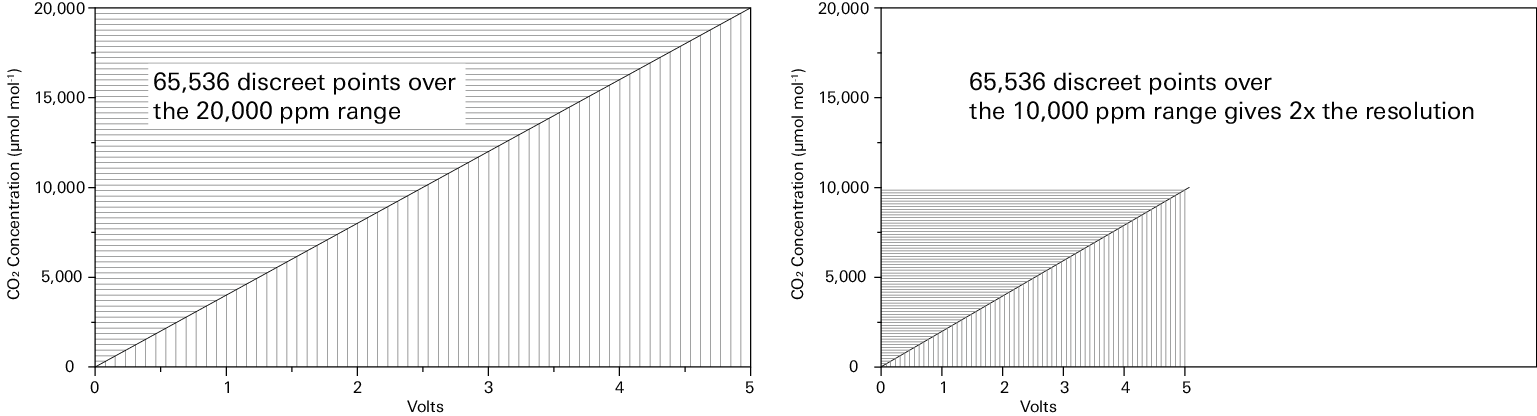
Optimizing the DAC resolution
When configuring the analog outputs, keep in mind that the selected ppm range will affect the resolution of data that is sent over the analog outputs.
Think of it like this: The 16-bit DACs can output a fixed number of values (65,536 to be exact). If a DAC is configured to output 0 to 5000 mV, you will have resolution of 0.076 mV per count.
3‑1

With the 0 to 5 volt output range corresponding with a 0 to 20,000 ppm CO2 concentration range, the finest change in concentration that can be resolved is equal to 0.31 ppm.
3‑2

If you are measuring concentrations between 0 and 10,000 ppm, the range is 10,000 ppm. By configuring the DAC range for 0 V = 0 ppm CO2 and 5 V = 10,000 ppm, the DAC output will have twice the resolution as it would in the previous configuration.
3‑3

Also keep in mind that the instrument will not output meaningful information over the DACs if the measured value is outside of the configured output range.
Computing readings from the DAC output
Here we give some example computations.
Example 1: Computing CO2 from a voltage output; 0 to 500 ppm range
The CO2 concentration is calculated from the DAC output. In this example, let's configure the output range for 0 V = 0 ppm and 5 V = 500 ppm. The concentration is computed from:
3‑4

If the output voltage is 2.9 V, then
3‑5

Example 2: Computing CO2 from a voltage output; 300 to 500 ppm range
In this example, let's configure the output range for 0 V = 300 ppm and 5 V = 500 ppm, so the full range is 200 ppm, and notably, 0 V is no longer 0 ppm.
3‑6

CO2max is the reading that corresponds with the high voltage output (500 ppm in this case), and CO2min is the reading that corresponds with the low voltage output (300 ppm in this case). With an output voltage of 2.9, the concentration is:
3‑7

Example 3: Computing CO2 from a current output; 0 to 500 ppm range
Unlike the voltage outputs, which are 0 to 2.5 or 0 to 5 V, the current outputs are from 4 to 20 mA (the 4 to 20 mA output is only available when the 0 to 2.5 V range is selected). Therefore, the range is always 16 (20 - 4), and the offset is always 4. Electrical current is indicated with I. In this example, let's configure the output range for 4 mA = 0 ppm and 20 mA = 500 ppm. The concentration is computed from:
3‑8

If the current is 16.25 mA, then
3‑9

Example 4: Computing CO2 from a current output; 300 to 500 ppm range
In this example, let's configure the output range so that 4 mA = 300 ppm and 20 mA = 500 ppm (the 4 to 20 mA output is only available when the 0 to 2.5 V range is selected). Now, we need an offset that corresponds with the minimum CO2 reading (300 ppm).
3‑10

If the current is 16.25 mA, then
3‑11

Example 5: Computing cell temperature from a voltage output
Cell temperature (T in °C) is calculated from the DAC output with the following:
3‑12

where XF is the full scale temperature value that corresponds to the high voltage, XZ is the temperature value that corresponds to the low voltage, V is the voltage reading, and Vmax is the output range (either 2.5 V or 5 V).
Example 6: Computing cell pressure from a voltage output
Cell pressure (kPa) can be computed from a voltage output with the following:
3‑13

where XF is the full scale pressure value that corresponds to the high voltage, XZ is the pressure value that corresponds to the low voltage, V is the voltage reading, and Vmax is the output range (either 2.5 V or 5 V).
Other options
Enable heater: The heater should be enabled to maintain the optical bench temperature. Normally the optical bench will be about 51.4 °C. If you disable the heater, the instrument will not perform as specified.
Pressure compensation: Pressure compensation should be applied to ensure that the instrument compensates for changes in pressure. Disabling pressure compensation will lead to less accurate measurements.
Enable pump: If your instrument is equipped with a pump, this box will be interactive. Check it to turn the pump on. Clear it to turn the pump off.
Filter: The digital filter instructs the instrument to average the readings. A value of 0 means no averaging, whereas a value of 20 instructs the instrument to average the previous 20 seconds of measurements. Increasing the averaging time will decrease the variation in each reported value, but will also reduce the instrument response time.
Using the pump
For instruments that are equipped with the LI-COR-installed pump, the pump is activated through the interface.
Note: The pump will not run until the optical cell has reached the operating temperature of about 50 °C, regardless of the setting. If the cell temperature drops below 50 °C, the instrument will disable the pump temporarily until the cell warms back up.
To turn on the pump from the main window, click the pump button so it reads Pump: On. Or, click Settings > Instrument and check Enable pump.
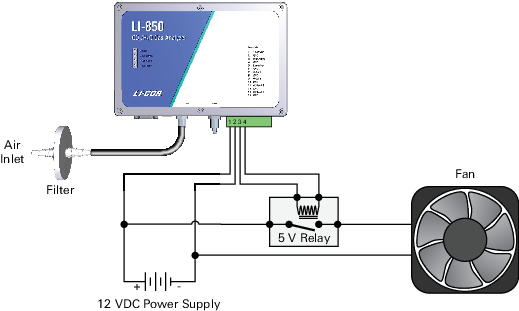
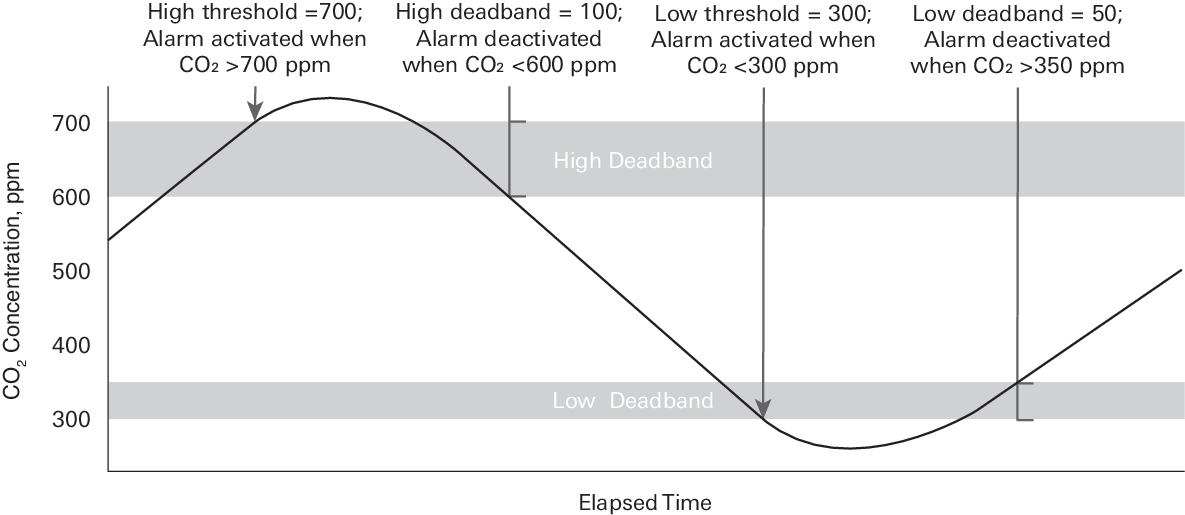
Using alarms
The alarms can be set for CO2 or H2O (in the LI-850). Each alarm features an activation level and a deadband. The high alarm is activated if the measured concentration exceeds a high threshold. The high deadband is the range below the threshold that the alarm remains activated. The low alarm is activated if the measured concentration drops below a low threshold. The low deadband is the range above the low threshold that the alarm remains activated.
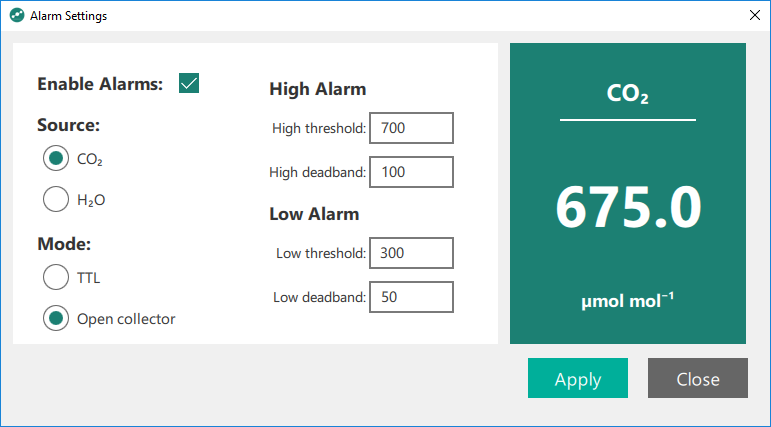
In TTL mode (transistor-to-transistor logic), the instrument sends a +5 V signal when the alarm is off and a 0 V signal when it is on. The alarm can be used to activate a relay switch or send a digital signal, for example. In Open collector mode, the alarm works like a switch. There is infinite resistance when the alarm is off and low resistance when the alarm is on, allowing current to flow between the pins.
Alarms are configured under Settings > Alarm Thresholds. To configure the alarms:
- Check Enable Alarms.
- Select whether the alarm should be for CO2 or H2O (with the LI-850). Alarms can be set for one or the other, not both.
- Configure the High Alarms.
-
- The High threshold is the high level at which the alarm is activated.
- The High deadband is the range below the high threshold that the alarm remains activated.
- Configure the Low Alarms.
-
- The Low threshold is the low level at which the alarm is activated.
- The Low deadband the range above the low threshold that the alarm remains activated.
- Click Apply when you are done.