Complementary Leaf Physiology Measurements: The LI-600 and LI-6800
Printable PDF: Complementary Leaf Physiology Measurements: The LI-600 and LI-6800
(600-6800_Complementary-Measurements_19769.pdf)
Download this content as a pdf.
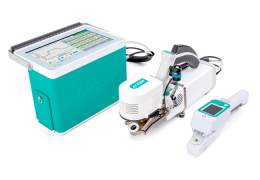
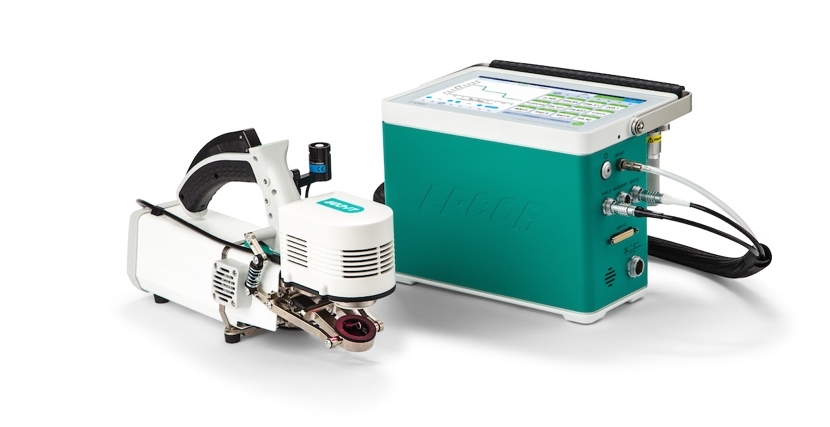
The LI-600 Porometer/Fluorometer is designed for high-speed sampling. It quickly measures stomatal conductance and chlorophyll a fluorescence from leaves. In contrast, the LI-6800 Portable Photosynthesis System is designed to provide highly detailed data. It measures parameters that take more time than porometry alone, such as CO2 assimilation. Although the LI-600 and LI-6800 have distinct purposes, the data they provide is highly complementary. When used together, they can improve the efficiency of data collection in laboratories, greenhouses, and plant breeding programs.
In this document, we discuss how these instruments can be used together to collect larger data sets and explore physiological traits in more detail while taking less time. To illustrate the concept, we review a case study in which wild pepper varieties were screened for sensitivity to water stress using the LI-600 and measured in detail with the LI-6800. Over 500 individual leaves were measured in a single day using one LI-600. Data from the high-volume survey were used to identify individuals that were evaluated in detail using the LI-6800.
Gas exchange and photosynthesis
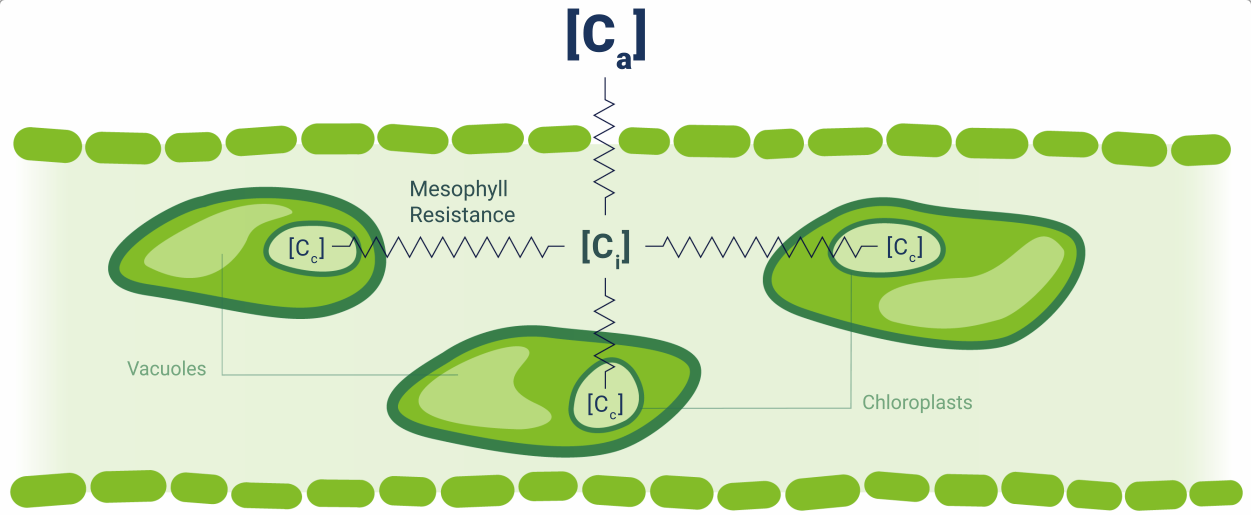
Leaves perform many complex physiological processes, but often of particular interest is how they exchange carbon dioxide (CO2) and water (H2O) between the leaf interior and the atmosphere (summarized in Figure 1‑2). These represent the two major processes, assimilation (CO2) and transpiration (H2O), and the movement of these gases into and out of the leaf is typically facilitated by the stomates. The stomates are able to open or close in response to stimuli or stress in order to control the rate of exchange.
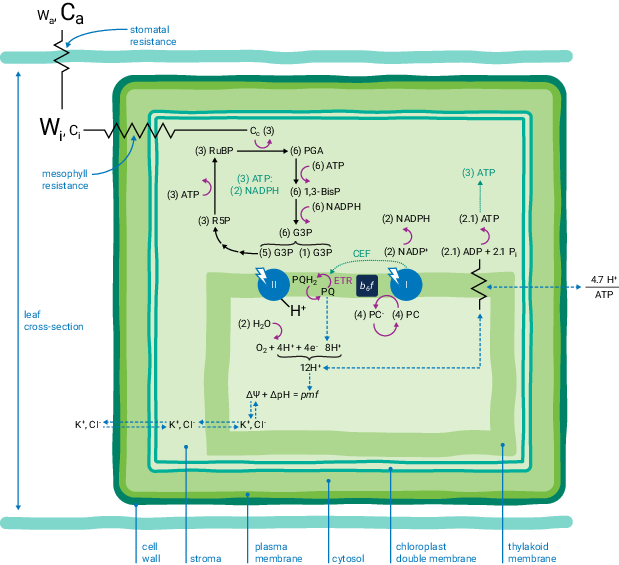
Along with the diffusion of gases into and out of the leaf, we have the photosynthetic apparatus within the chloroplasts. Here, energy from captured photons facilitates the conjugation of CO2 into sugars. This process consists of the light-independent reactions or Calvin-Benson cycle occurring in the stroma and the light-dependant reactions occurring in the thylakoid membranes.
The LI-600 Porometer/Fluorometer
The key purpose of a porometer is to provide quantification of the water exchange between the leaf and the environment. This exchange can be limited either by the supply of water from the soil via the roots or regulated by the stomates. With this in mind, the LI-600 is designed to provide accurate and extremely rapid quantification of this exchange under ambient conditions.
The open-chamber design of the LI-600 ensures that measurements are an accurate representation of the leaf in its current environment. When care is taken not to shade the leaf surface or modify its angle, then we can rapidly survey very large numbers of leaves without needing to wait for them to equilibrate to chamber conditions. The built-in barcode scanner also allows us to achieve high throughput – automatically capturing data labels and eliminating the need to manually type information into the system.
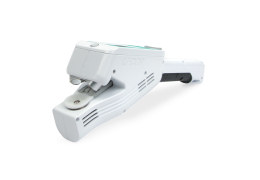
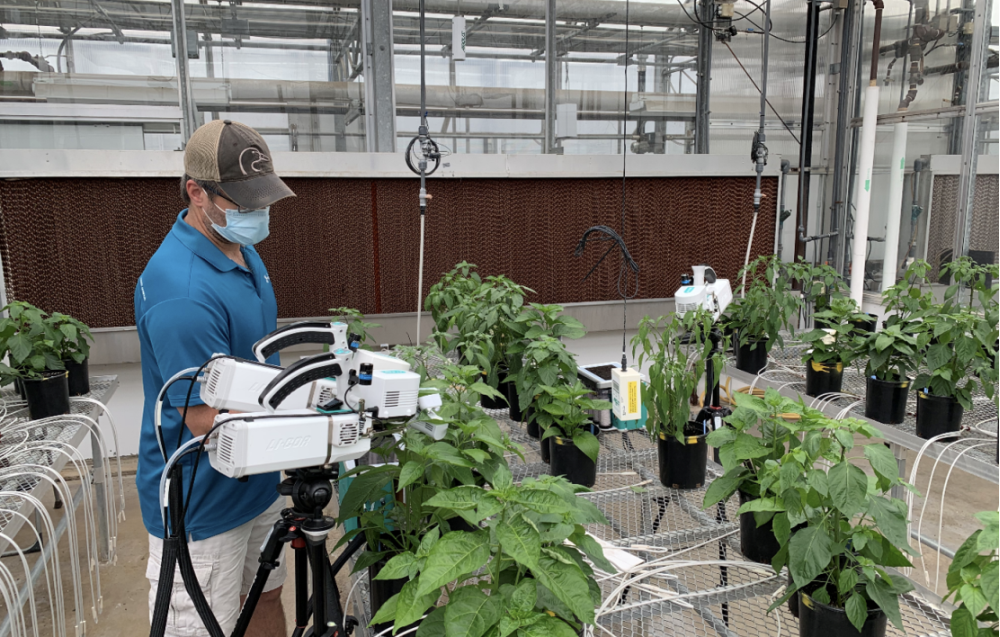
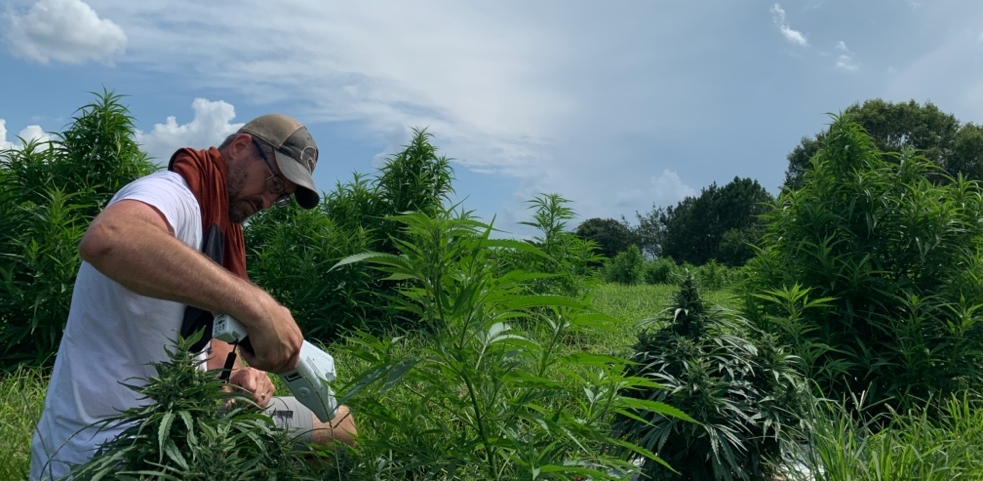
The small, lightweight form factor of the LI-600 allows for one-handed operation in the field and allows easy access to leaves (Figure 1‑3).
Humidity is measured with two relative humidity sensors. These measure the air before and after interacting with the leaf. Leaf temperature is measured using a non-contact infrared thermocouple (IRT). A micropump provides airflow for the system. This moving air and flow meter uniquely allows the LI-600 to separate total conductance into boundary and stomatal conductance, as well as facilitating the rapid measurement time.
The optional, user installable LI-600 fluorometer attachment allows us to make non-invasive measurement of photosystem II (PSII). The open design allows for measurement in ambient actinic light and allows investigation of PSII photochemistry.
The LI-6800 Photosynthesis System
The LI-6800 provides a complete solution for quantifying photosynthesis. It employs two infrared gas analyzers (IRGAs) to quantify both CO2 and H2O flux. The leaf (or whole plant) is completely enclosed within a chamber and the environment (CO2, H2O, temperature, air turbulence, light intensity, and light spectrum) can be controlled by the user.
Control of the leaf chamber ensures that conditions can be kept constant throughout experiments and ensure that measurements are directly comparable. It also allows the user to impose changes in environment and to quantify how the leaf responds to those changes such as light (AQ curve) or CO2 concentration (A/Ci). However, such measurements are typically time consuming, and the greater the change from ambient to chamber conditions, the longer the leaf will take to acclimate. This typically gives the LI-6800 a reduced throughput compared to the LI-600.
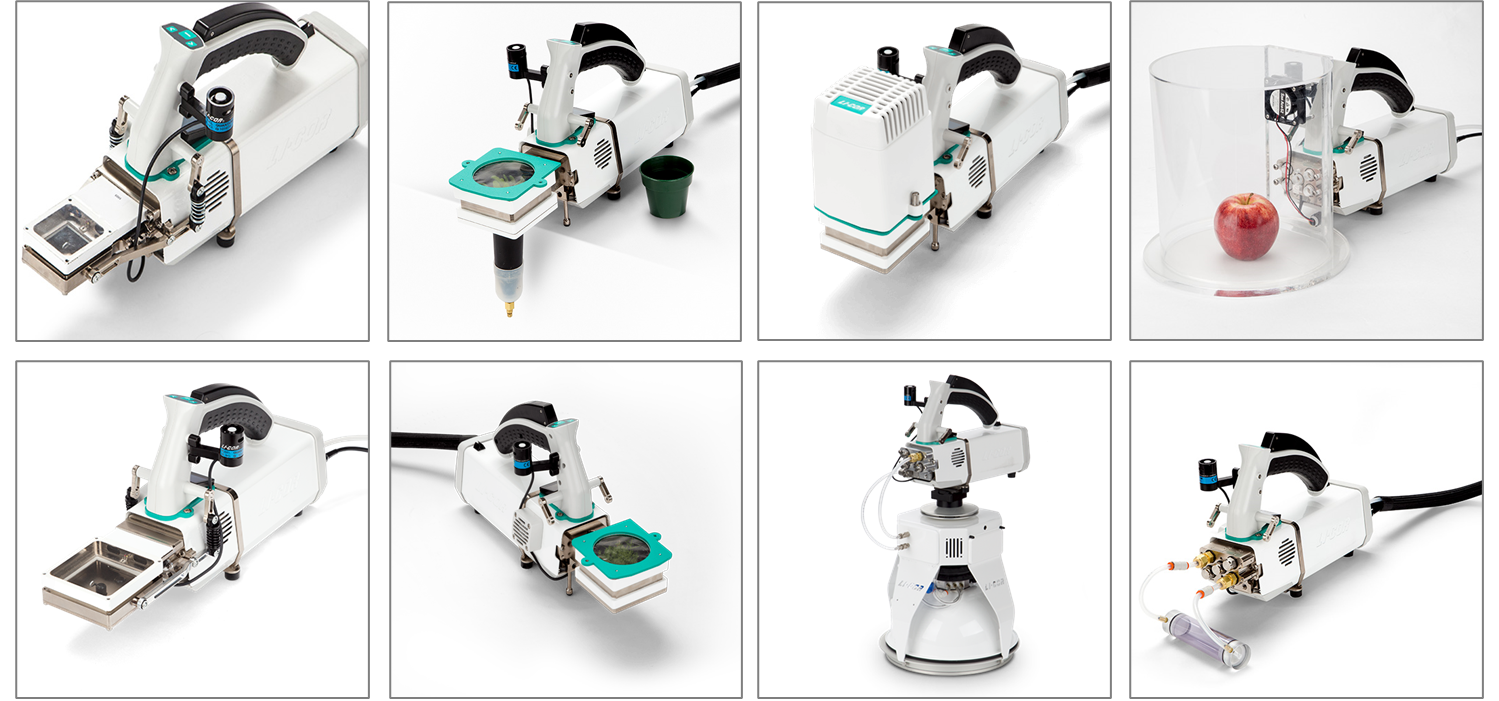
The LI-6800 is highly versatile. A variety of different chambers can be used for different applications, such as measuring soil CO2 flux, whole plant gas exchange, algal suspensions, or invertebrates (Figure 1‑5).
System comparison
| Feature | LI-600 | LI-6800 |
|---|---|---|
| Portability | Lightweight, designed for one-handed operation | Two handed operation and heavier total system weight |
| Batteries and power | Typical 8 hour battery life; Can be charged in the field from power bank | Typical 6 to 8 hour battery life; Batteries hot swappable; Can be powered from mains |
| Cuvette design | Fixed small leaf area optimized for high throughput – between 120 and 200 samples per hour | Flexible design to evaluate a broad range of subject materials from small leaf areas and conifer needles to large area (36 cm2) leaves, algae, and aquatic samples |
| Sample environment | Evaluations in ambient conditions | Evaluations in controlled conditions |
| Environmental control | Rapid measurement of light, H2O and temperature, but not CO2 and without any control | Accurate, precise and fast measurement AND control of the important environmental drivers including light, CO2, temperature and H2O. |
| Optimal applications | Optimized for rapidly capturing a snapshot of leaf stomatal and biochemical status under ambient conditions | Ideally suited for sophisticated experiments mapping the response to environmental drivers |
| Ease of use | Simple operation without special training | Sophisticated experiments accounting for multiple parameters |
| Control over CO2 in the cuvette | No | Yes |
| Control over H2O in the cuvette | No | Yes |
| Measures carbon assimilation | No | Yes |
| Leaf surface measured | Single-sided measurement | Both sides measured simultaneously |
| Chlorophyll fluorescence | Yes with 600-01F fluorometer | Yes with 6800-01A fluorometer chamber |
| High frequency fluorescence data for induction kinetics | No | Yes |
| Measures PPFD at the leaf | Yes | Yes |
| Controls PPFD at the leaf | No | Yes |
Parameters measured
We have already looked at some of the differences in operation and measurement technique between the LI-600 and LI-6800. Here we look at the data generated by each instrument and what it can be used for. Though there is some overlap, the LI-600 and LI-6800 each have their own parameter set, which means that the choice of instrument may be heavily influenced by the aims of each particular experiment.
Measured by both the LI-600 and LI-6800
The following can be measured using either the LI-600 or LI-6800 fluorometer.
- Stomatal conductance to water vapor (gsw): The capacity for water transport through the stomata. The inverse of the diffusive resistance imposed by the stomata to water leaving the leaf. Physiologically it provides a relative measure of how open or closed the stomata are.
- Reported as a transport rate per unit time per unit leaf area (moles of H2O m-2 s-1). Note that gsw is measured for one side of the leaf in the LI-600, whereas both sides of the leaf are summed together in the LI-6800 unless a one-sided kit is used (part number 9968-313). To measure total gsw with the LI-600 measurements of both sides of the leaf can be taken and summed together. gsw can be a sensitive indicator of stress and is a real-time output of the LI-600 and LI-6800.
- Quantum yield of PSII (ΦPSII): The proportion of light absorbed by chlorophyll at Photosystem II (PSII) and used for photochemistry. The operating quantum efficiency at the current light intensity.
- This value will typically be lower than Fv/Fm due to accumulation of light induced non-photochemical quenching processes and photo-damage to the leaf. The quantum yield of PSII is closely coupled to carbon assimilation and the ratio of ΦPSII times absorbed light to Agross (Anet + Rd) has a theoretical minimum of eight photons per carbon in C3 plants. In non-stressed plant material, deviations from this are often ascribed to alternative energy sinks; e.g., photorespiration, nitrogen or sulfur metabolism. It is reported as a dimensionless ratio derived from measurements of chlorophyll fluorescence on light adapted leaves, and is a direct output of the LI-600 or LI-6800 fluorometer.
- Maximum quantum efficiency (Fv/Fm): The maximum, or intrinsic, efficiency for the capture of light energy by chlorophyll at Photosystem II (PSII) and its use in photochemistry.
- A highly conserved, and widely cited, parameter that is sensitive to stress induced impacts to the PSII reaction centers. For healthy plant material Fv/Fm is about 0.8 and decreases with stresses that impact energy capture or conversion. It is reported as a dimensionless ratio derived from measurements of chlorophyll fluorescence on dark adapted leaves, and is a direct output of the LI-600 or LI-6800 fluorometer. As the LI-600 fluorometer is open to ambient conditions, care must be taken if measuring Fv/Fm in day conditions not to expose the leaf to light.
- Electron transport rate (ETR): The rate of electrons moving linearly through the electron transport chain.
- Reported as a rate (µmol of electrons m-2 s-1) and derived from measurements of chlorophyll fluorescence. The ratio of ETR to Agross (Anet + Rd) has a theoretical minimum of four electrons per carbon in C3 plants. Deviations from this minimum are often attributed to alternative electron sinks; e.g., photorespiration, nitrogen or sulfur metabolism. ETR is derived from measurements of chlorophyll fluorescence on light adapted leaves, and is a direct output of the LI-600 or LI-6800 fluorometer. It requires an unimpeded measurement of photosynthetically active radiation (PAR) from the LI-600 or LI-6800 PAR sensor.
- Non-photochemical quenching (NPQ): The efficiency of energy dissipation from Photosystem II (PSII) through non-photochemical means. The current efficiency of heat dissipation relative to the leaf in a dark-adapted state.
- NPQ can be thought of as representing excess light energy beyond what the leaf can use for photochemistry. An increase in NPQ in the absence of an increase in light intensity therefore represents a decrease in photochemistry and/or its efficiency. It is reported as a dimensionless ratio and is derived from measurements of chlorophyll fluorescence on leaves in a dark adapted and light adapted state. Where maximum fluorescence in the dark is known (via a prior measurement) NPQ is a direct output from the LI-6800 fluorometer and can be calculated manually from LI-600 fluorescence data.
Measured by the LI-6800 only
- Net assimilation (Anet): The balance between carbon uptake by carboxylation and carbon loss due to photorespiration and other respiratory processes. Carbon assimilation to support plant growth and metabolism.
- Reported as the rate of CO2 uptake per unit time per unit leaf area (µmol of CO2 m-2 s-1) and is a real-time output of the LI-6800. Anet is commonly measured with conditions inside the measurement chamber set to mimic the growth environment of the plant.
- Light saturated assimilation (Asat): Net assimilation when light is not limiting photochemistry; net assimilation at a saturating light intensity. The light intensity at which Asat is reached represents the maximum usable light intensity by the leaf.
- Reported as the rate of CO2 uptake per unit time per unit leaf area (µmol of CO2 m-2 s-1) and can either come from a point measurement of Anet made at saturating light intensity or be derived from a light response (AQ) curve.
- Maximum assimilation rate (Amax): Net assimilation when neither light nor CO2 are limiting photochemistry, net assimilation at a saturating light intensity and a saturating CO2 concentration. Amax represents the maximum capacity of the leaf for carbon assimilation.
- Reported as the rate of CO2 uptake per unit time per unit leaf area (µmol of CO2 m-2 s-1) and can either come from a point measurement Anet made at saturating conditions or be derived from a CO2 response (A/Ci) curve.
- Respiration rate (Rx): The rate of carbon loss from the leaf due to mitochondrial respiration.
- Reported as the rate of CO2 release per unit time per unit leaf area (µmol of CO2 m-2 s-1). In C3 plants, several methods exist to estimate mitochondrial respiration: Respiration in the light, Rd, can be estimated from nesting CO2 response measurements within light response (A/Ci nested with in AQ) curves. Respiration in the dark, Rn, can be estimated from a measure of Anet in the dark or from the y-intercept of a light response (AQ) curve.
- Photorespiration (RPR): The result of the oxygenase activity of Rubisco. Where Rubisco oxygenates rather than carboxylates. Photorespiration is a competing process to photosynthetic carbon assimilation and ultimately leads to the release of previously fixed carbon.
- Reported as a rate of CO2 release per unit time per unit leaf area (µmol of CO2 m-2 s-1). Multiple methods exist to estimate RPR, including CO2 response (A/Ci) curves coupled with chlorophyll fluorescence and assimilation measured under a low O2 concentration.
- Total conductance to carbon dioxide (gtc): The capacity for CO2 transport through the stomata and boundary layer. The inverse of the diffusive resistance imposed by the stomata CO2 entering the leaf. Physiologically it provides a relative measure of how open or closed the stomata are along with the effect of the boundary layer resistance.
- Reported as a transport rate per unit time per unit leaf area (moles of CO2 m-2 s-1). Stomatal conductance to water vapor (gsw) is the more widely cited conductance parameter.
- Intrinsic water use efficiency (WUEg): The ratio of net carbon assimilation (Anet) to stomatal conductance to water vapor (gsw); a metric that describes the potential water cost of carbon assimilation.
- Intrinsic water use efficiency measured by gas exchange follows from the same physical process as water use efficiency derived from the stable carbon isotope ratio of plant tissue, only integrated over a much shorter time scale. It is related to instantaneous water use efficiency (WUEi) by evaporative demand. WUEg can be calculated from Anet and gsw, but is not calculated by default by the LI-6800.
- Stomatal limitation (l): The inherent limitation to photosynthesis imposed by the diffusive resistance of the stomata. The proportion of assimilation at growth conditions relative to that when the leaf’s internal CO2 concentration is equal to that of growth conditions.
- Stomatal limitation is typically derived from a CO2 response (A/Ci) curve.
- Maximum velocity of carboxylation (Vc,max): The first of the three rate-limiting processes used to describe the response of assimilation to CO2 concentration (A/Ci curve). Vc max represents the maximum velocity of carbon fixation by Rubisco.
- It is derived from fitting a function to the initial portion of the A/Ci curve where the availability of CO2 limits the rate of carboxylation.
- Maximum electron transport rate (Jmax): The second of the three rate-limiting processes used to describe the response of assimilation to CO2 concentration (A/Ci curve). Jmax represents the maximum rate of electron transport through the electron transport chain (µmol of electrons m-2 s-1).
- Its derived from fitting the portion of the A/Ci curve where the production of ATP and NADPH by the light reactions limits the rate of carboxylation.
- Velocity of triose phosphate utilization (VTPU): The last of the three rate-limiting processes used to describe the response of assimilation to CO2 concentration (A/Ci curve). Triose phosphate utilization is an assessment of the rate of export of photosynthetic carbon assimilation products (triose phosphates), their utilization in sucrose synthesis, and the return of the phosphate to the chloroplast.
- It is reported as a rate (µmol of triose phosphate m-2 s-1) and is derived from fitting the portion of the A/Ci curve at Amax.
As we can see in the Case study 1: Water use in wild peppers, the LI-600 offers significant benefits in terms of speed, ease of measurement, and portability compared with the LI-6800. But these benefits come with the trade-off of not measuring as many parameters. The appropriate instrument for any given study may be dictated by the parameters required – for example if we wish to measure CO2 assimilation or the response to some imposed change in environment, then we must use a photosynthesis system and not a porometer.
For this reason, it is important to carefully consider what parameters are needed by a given study and consider which is the correct tool for that specific job. If the study aims to quantify a change in gsw under ambient conditions in response to stress, then the LI-600 will provide a fast and robust measurement that is easy for the user to perform. If we wish to quantify assimilation under the same conditions, we can do this with the LI-6800, but the measurement will be slower. With the option of both instruments, we can ensure that we optimize each study to make best use of each instrument’s strengths whilst maintaining a broad range of capabilities. Here we present two case studies that describe how the LI-600 and LI-6800 were used in tandem.
Case study 1: Water use in wild peppers
In this study, a wide variety of wild pepper accessions were collected and screened for agronomic traits. Both water use and sensitivity to drought stress were of particular interest.
- A single operator collected 535 samples of stomatal conductance in a day using one LI-600—with time to spare.
- Measured detailed parameters of plants that showed sensitivity to water stress with the LI-6800, as determined with the LI-600.
- Fast screening enabled faster decision making about breeding priorities.
For the experiment, 30 accessions were grown in triplicate alongside a commercial control variety (18 control replicates). Plants were produced in 2-liter pots and grown under glasshouse conditions. Plants were initially kept well-watered until the beginning of the study. At this point irrigation was suspended and water stress was allowed to begin. Using historical data, a representative example of a drought sensitive and a drought insensitive accession were pre-selected for more detailed characterization.
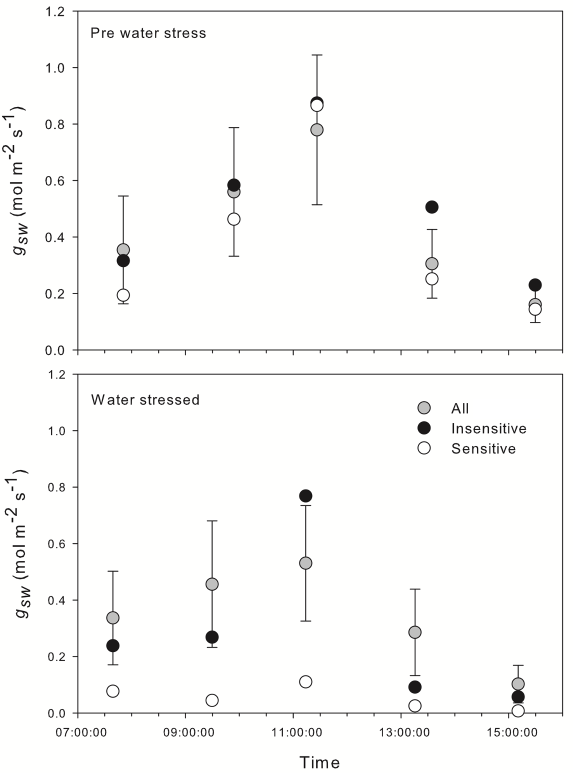
At the start of the study and prior to the establishment of water stress, stomatal conductance (gsw) was assessed for the entire population of 107 individual plants at five different time points. A single, well-lit leaf was selected from each plant for measurement, and care was taken to ensure that leaf angle and light intensity at the leaf surface were not affected. The LI-600 was used to rapidly survey a large population of plants in a narrow time window. It provided high sample throughput and allowed each data point to be collected on schedule.
Stomatal conductance followed an expected diurnal pattern – demonstrating a low conductance in the early morning but increasing with time as stomates began to open in the increasing light. Conductance peaked before midday and decreased into the afternoon as temperature became higher (Figure 1‑7). We saw no difference in conductance between the drought sensitive accession and the general population under well-watered conditions; however a slightly smaller afternoon reduction in gsw in the insensitive accession was observed.
Two days after the cessation of watering the soil had significantly dried and stomatal conductance was characterized again for the entire population (Figure 1‑7). At this point the drought-sensitive accession appeared visually wilted and displayed a significant reduction in conductance at all observation points compared to the total population. In contrast the insensitive accession was able to maintain a stomatal conductance around the population mean at all time points.
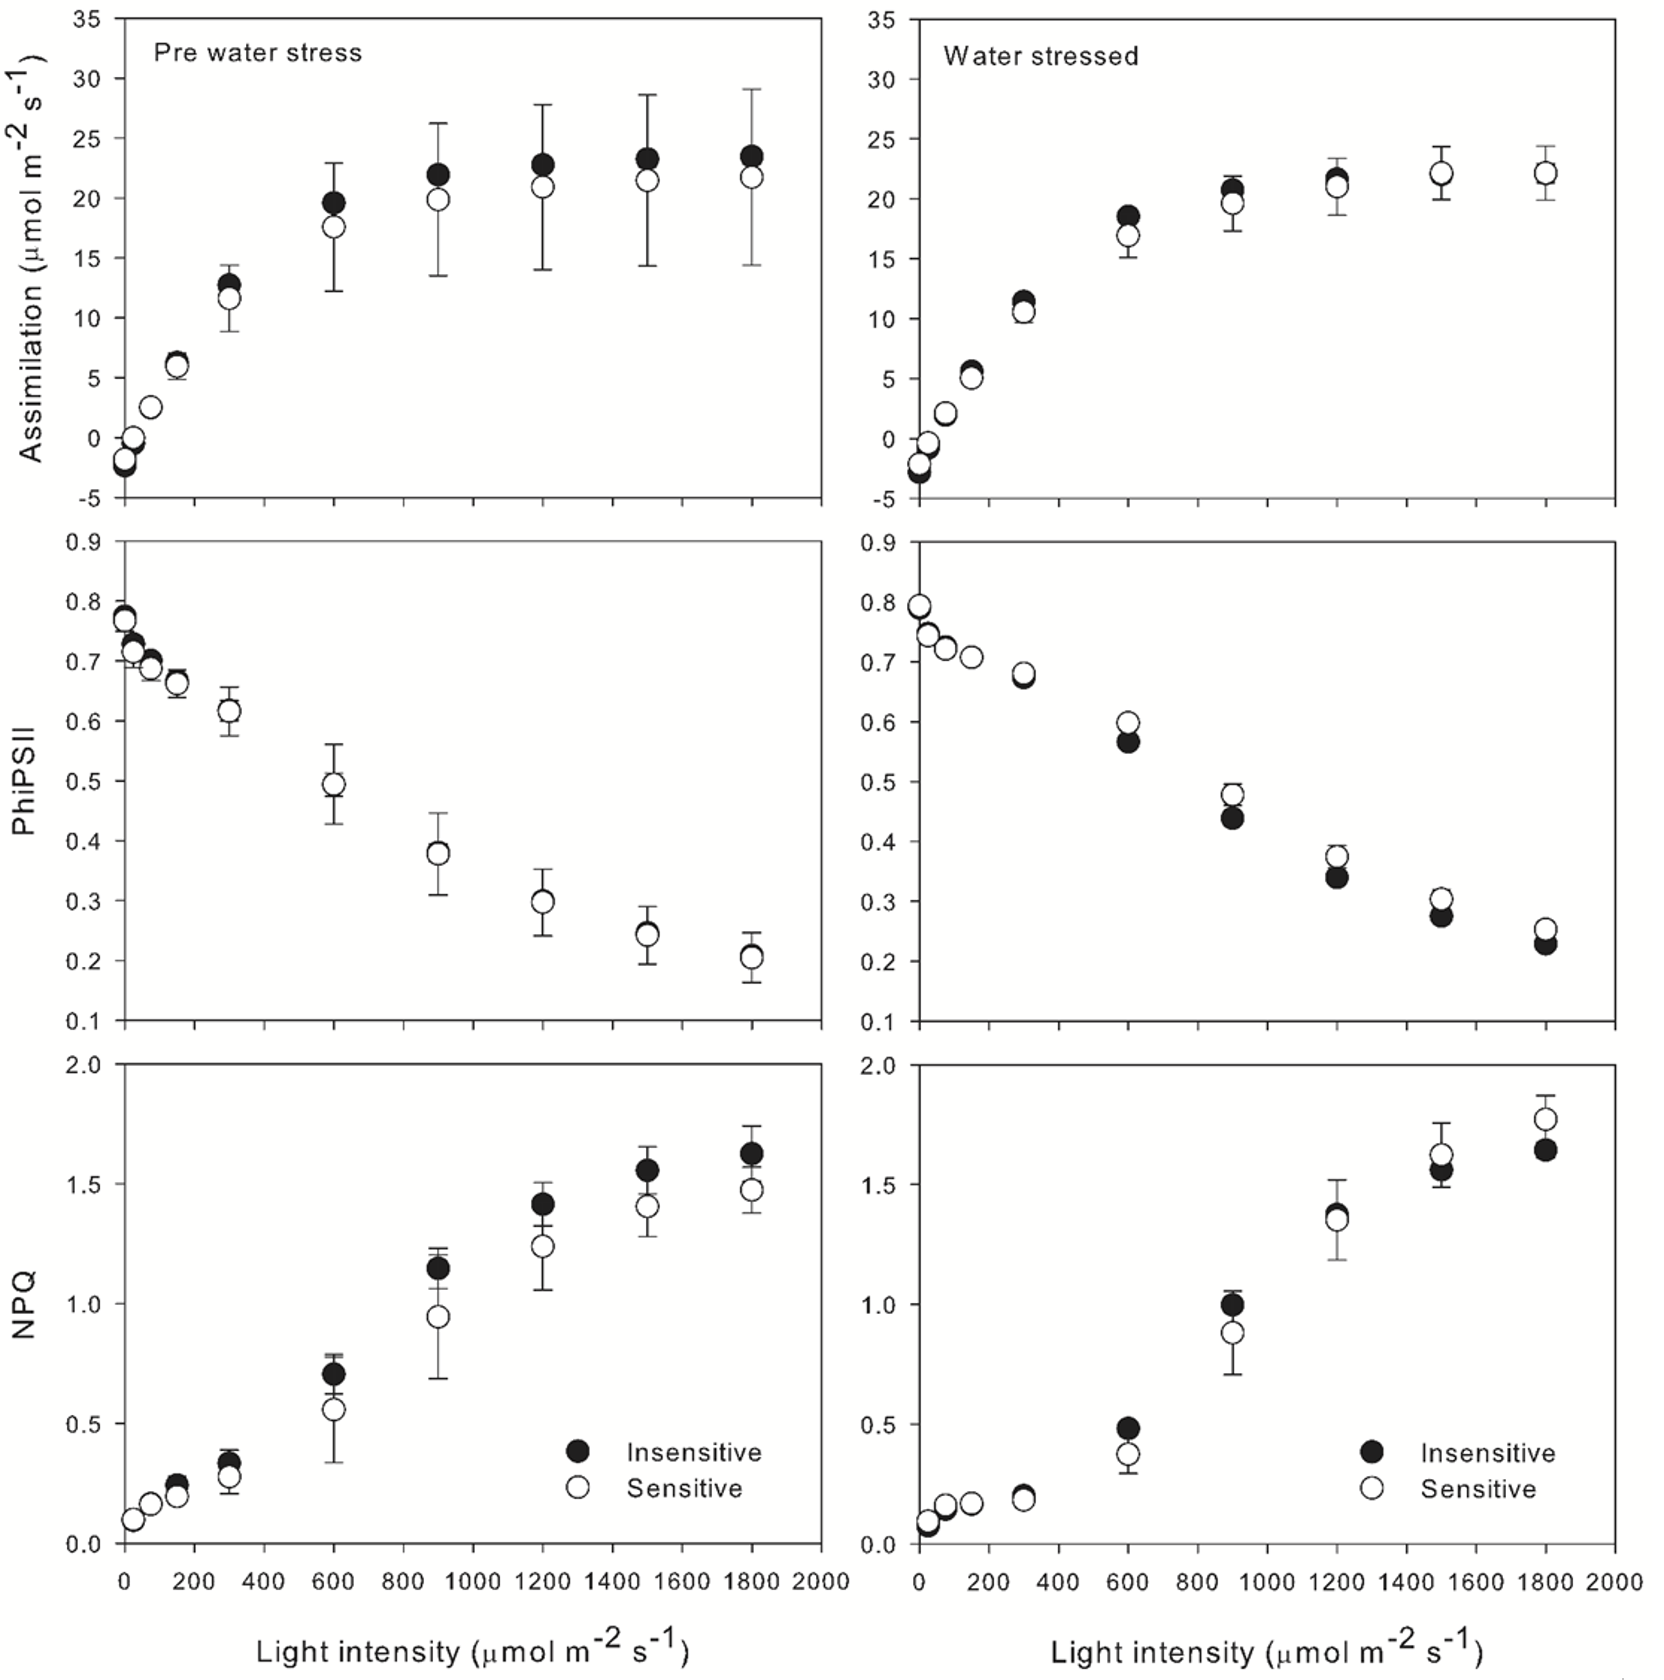
After the onset of drought, the sensitive and insensitive lines also underwent additional characterization using the LI-6800 photosynthesis system. In this case light response curves were performed, looking at CO2 assimilation, stomatal conductance and chlorophyll fluorescence at 10 different light intensities ranging from 0 – 1800 µmol m-2 s-1. Sample CO2 concentration was maintained at 400 ppm, chamber VPD was 1.5 kPa and leaf temperature was 30 °C. Similar performance of both the drought sensitive and drought insensitive accession was observed in the light response experiments (Figure 1‑8).
A/Ci curves were carried out using the Dynamic Assimilation Technique (DAT). Leaves were acclimated at 1500 µmol m-2 s-1 light (90% red, 10% blue), 30 °C leaf temperature, 1.5 kPa VPD and a reference CO2 concentration of 1,800 ppm prior to commencing the ramp.
The A/Ci response curve showed that the drought sensitive accession was still able to maintain a high rate of net assimilation, reaching a maximum of around 40 µmol m-2 s-1. In contrast, net assimilation in the drought insensitive accession was much lower, reaching a maximum of around 25 µmol m‑2 s-1 (Figure 1‑9).
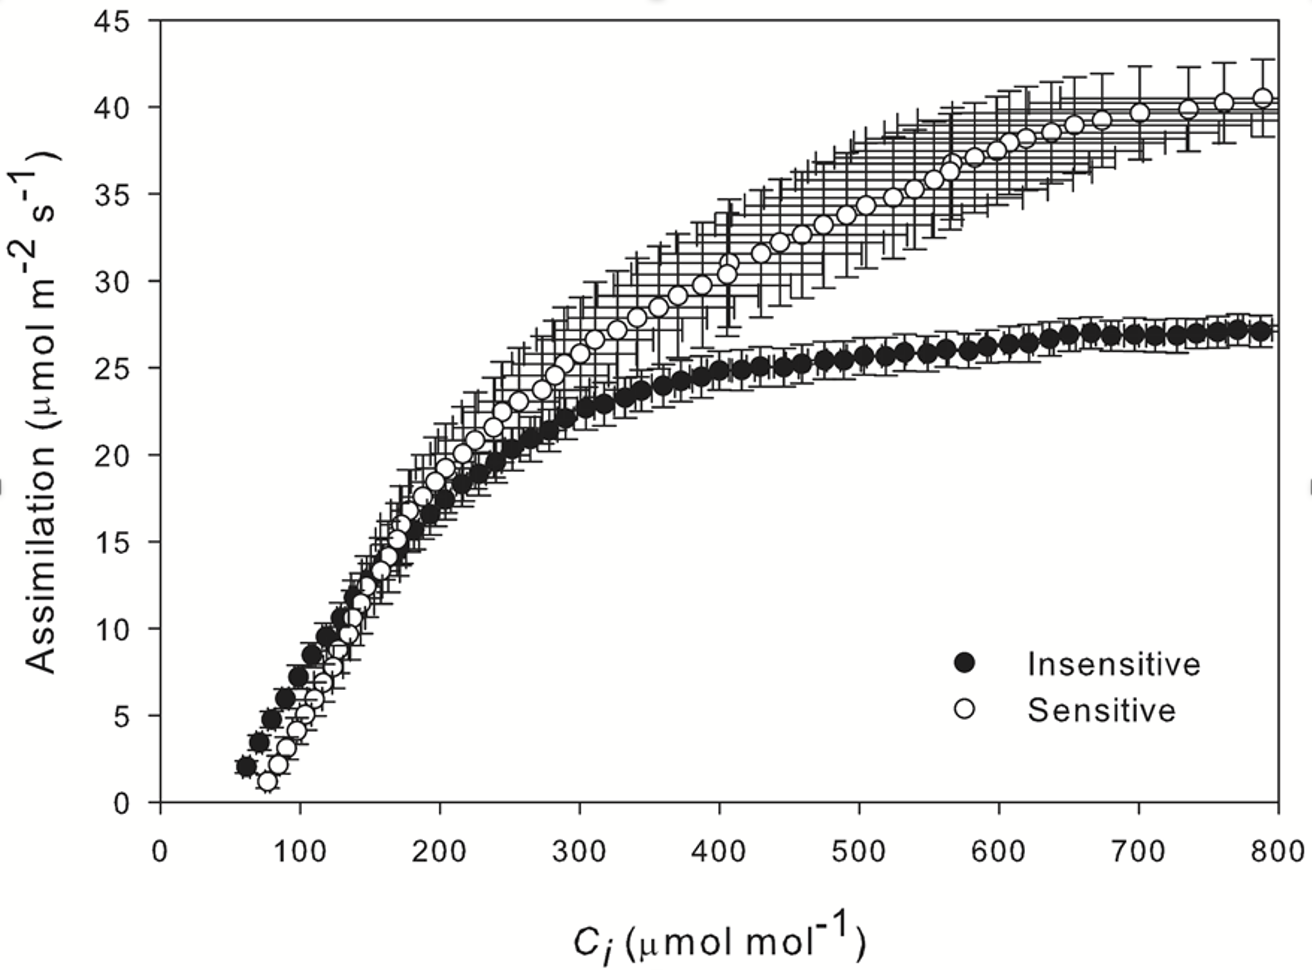
Parametrization of these curves reveals an increased stomatal limitation in the drought sensitive accession – 0.250 compared with 0.122 displayed by the insensitive accession.
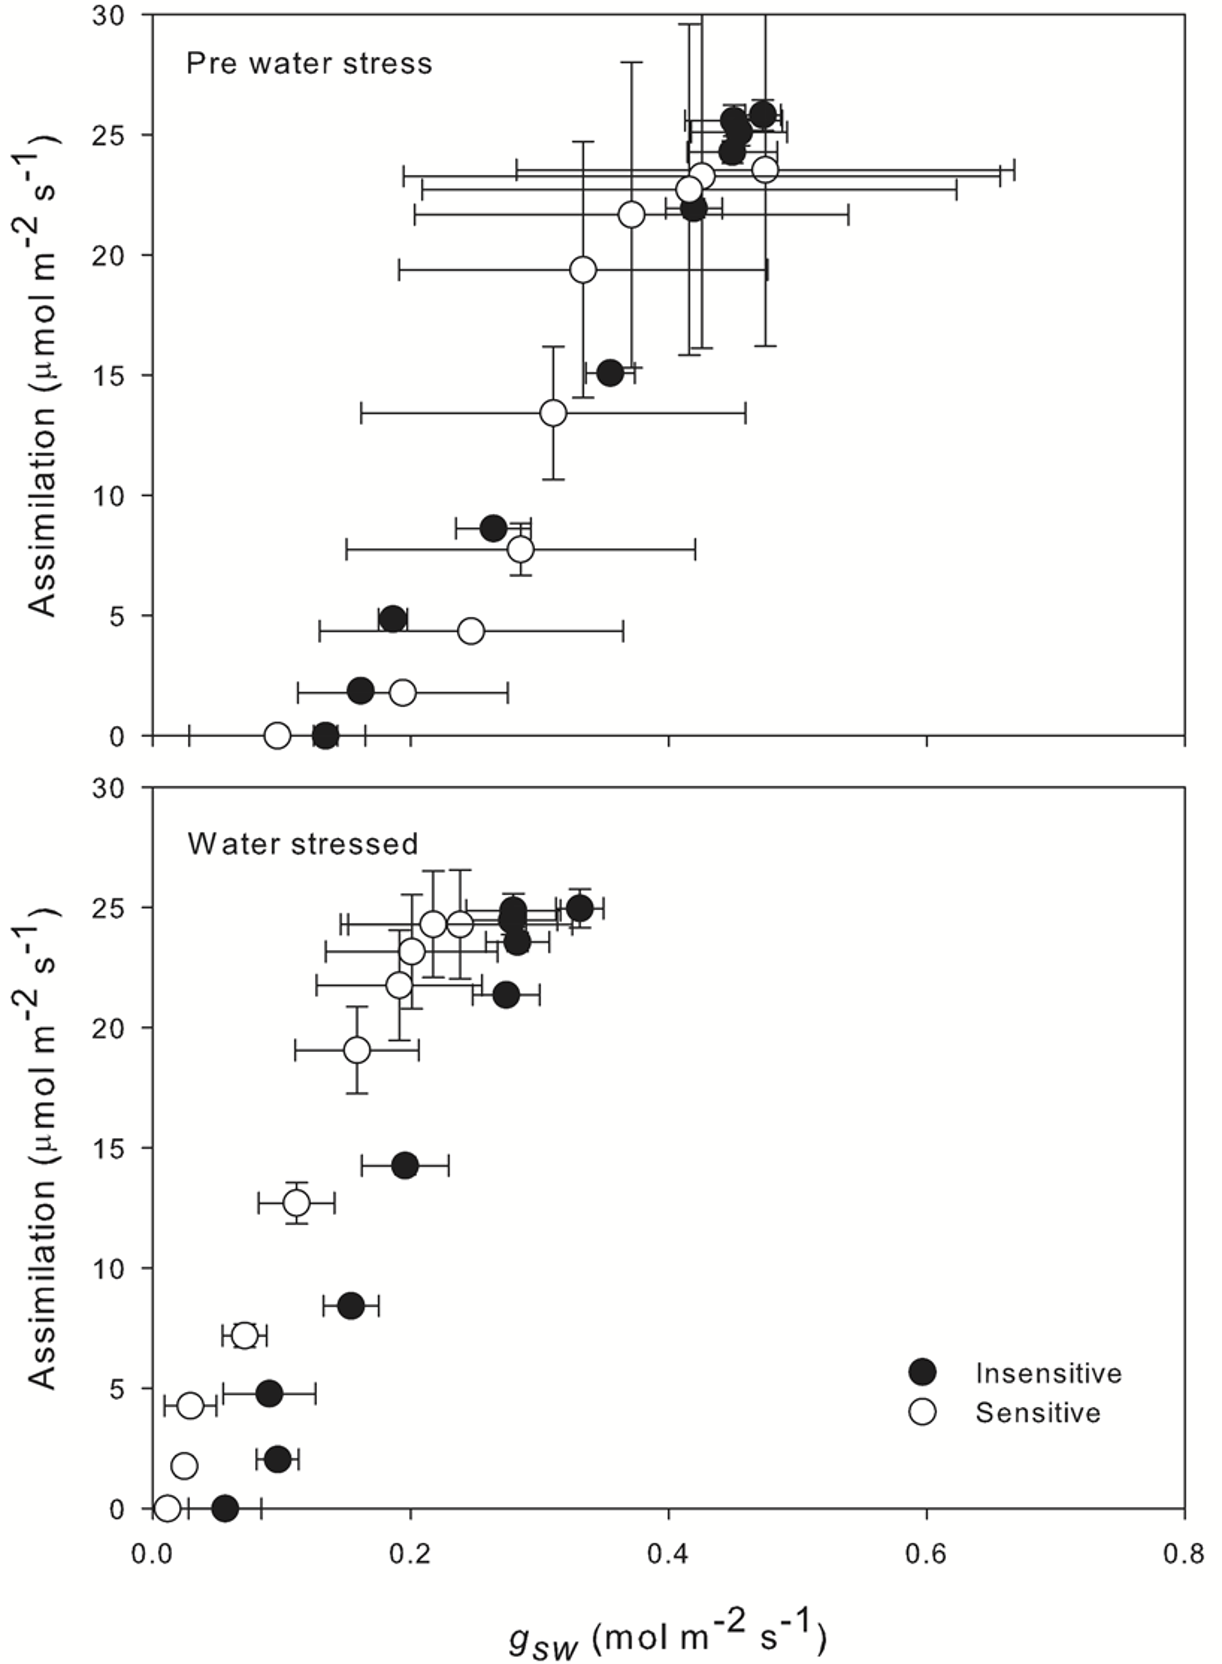
When looking at stomatal conductance (gsw) versus net assimilation (top of Figure 1‑10) we observed a strong, linear correlation between the two parameters. Prior to the establishment of water stress, no obvious difference between the drought sensitive and insensitive accessions was apparent, displaying a slope of 77.7 and 78.3 respectively. After the establishment of drought, the two populations began to diverge. Intrinsic water use efficiency increased in both accessions; however, we observed a greater slope in the insensitive accession (112.5) compared with the sensitive accession (102.4). Essentially WUE increased under stress and was under tighter control at low assimilation rates.
Conclusions of case study 1
Combining the LI-600 and LI-6800 allows us to probe different areas according to each of the instrument’s strengths.
- Due to the time required for each measurement, we were limited to six light response curves and six A/Ci curves per day using two LI-6800s.
- In contrast, the LI-600 was used to collect 107 measurements at five different time points, giving 535 observations per day in this study.
- By using both instruments we can create a far more complete picture than by using either instrument individually.
Figure 1‑10 highlights the strong linear relationship that is often observed between assimilation and conductance. Once relationships such as this have been established, we can use the LI-600 to rapidly collect large quantities of conductance data and infer the likely assimilation status of the leaf in large populations of plants. However, Figure 1‑10 (bottom) shows that this relationship can change over time and in response to changing environment, so regular concurrent characterization using the LI-6800 alongside the LI-600 is still beneficial in order to capture these changes.
Case study 2: Parameterizing stomatal ratio
Here we show use of the LI-600 to parameterize a key LI-6800 input, stomatal ratio. We demonstrate its impact on direct outputs of the LI-6800, as well as its impact on a secondarily derived parameter fit from CO2 response measurements (A/Ci).
- Many instruments, like the LI-600 and LI-6800, assume a number of default values for various, non-measured parameters that are required for computations. For the most accurate data, these parameters must be set by the user for their particular study material.
- The LI-6800 integrates gas exchange measurements across both surfaces of the leaf, and as such the boundary layer contribution at each leaf surface must be accounted for.
- The LI-600 measures a single leaf surface and can be used to rapidly access stomatal ratio in the field.
How stomatal conductance and Ci are calculated
In both the LI-600 and LI-6800, stomatal conductance to water vapor (gsw, in mol m-2 s-1) is not a direct measurement. It is derived from the total conductance to water vapor (gtw, also in mol m-2 s-1) between the leaf and atmosphere, which in turn is derived from the apparent transpiration rate (E, in mmol m-2 s-1) measured in the chamber:
1‑1

Where Ws is the water vapor mole fraction in the chamber and Wl is the water vapor mole fraction in the leaf intercellular air space, both in mmol mol-1. It is assumed that the intercellular air space is at saturation, and thus Wl is computed from atmospheric pressure and leaf temperature.
Stomatal conductance is separated from the total conductance by removing the boundary layer contribution (gbw). For a single leaf surface, analogous to the measurement made by the LI-600, gsw is given by:
1‑2

For measurements integrated across both leaf surfaces, as done by the LI-6800, this model is extended to account for the additional surface by an adjustment factor (kf) on the boundary layer:
1‑3

This adjustment factor is related to the distribution of stomatal conductance between each leaf surface, referred to as stomatal ratio (K).
1‑4

1‑5

It is important to note here that K is not the ratio of stomatal density, as would be derived by counting stomata from epidermal peels. It is the ratio of stomatal conductance between the two leaf surfaces. If it is assumed that the stomatal behavior is uniformly coordinated across the leaf surfaces, then K is related to the ratio of densities. However, for many plants, particularly those experiencing water stress, stomatal behavior is not uniform across the leaf, meaning that K may not be well coupled to the density ratio. This implies the need to be able to measure conductance from each leaf surface in isolation to make the best estimate of K.
In the LI-6800, K is also involved in the calculation of the intercellular CO2 concentration (Ci in µmol mol-1). Ci is derived from total conductance to CO2 (gtc), which is in turn derived from gsw, and the carbon assimilation rate (A, in µmol m-2 s-1):
1‑6

1‑7

Where Cs is the CO2 concentration in the chamber (µmol mol-1), and the factors 1.6 and 1.37 are ratios of diffusivity between CO2 and water vapor through the stomata and boundary layer, respectively.
A field study in hemp demonstrating the impact of stomatal ratio
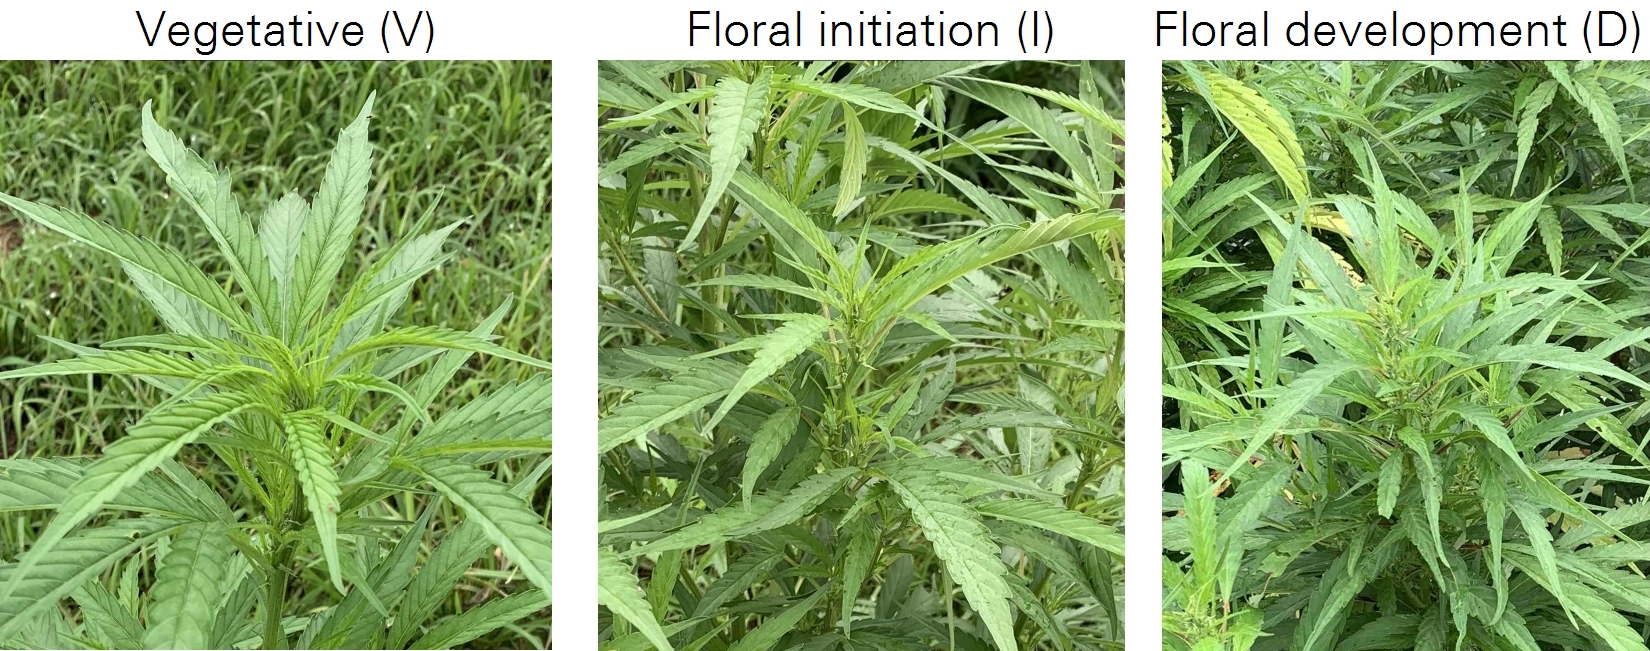
Data were collected from field grown clones of a single commercial hemp variety (Cannabis sativa “Janet’s G”). Sampled plants spanned a phenological gradient resulting from different planting dates: V – vegetative plants (29 days after planting) had not yet started to initiate any inflorescence development; I – plants showing early stages of floral development (43 days after planting), with early initiation of inflorescences; D – active floral development on well-developed inflorescences (51 days after planting).
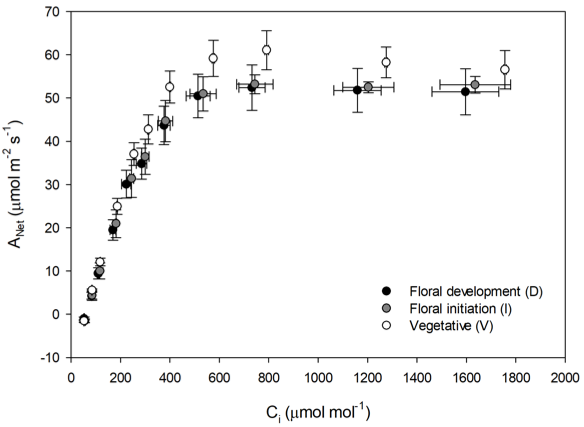
The LI-6800 was used to characterize response to CO2 (Figure 1‑12 and Figure 1‑13 for three of four study plants in each phenological stage. Response curves were measured using a steady state method, targeting the reference analyzer CO2 concentration: 425, 350, 250, 150, 100, 50, 425, 425, 550, 750, 1000, 1500, and 2000 µmol mol-1. Chamber conditions were 2000 µmol m-2 s-1 PPFD, 30 °C leaf temperature, 65% sample chamber humidity and a flow rate of 500 µmol s-1. Measurements were made on the first fully developed center leaflet back from the terminal meristem wide enough to completely fill the 2 cm2 aperture of the 6800-01A fluorometer.
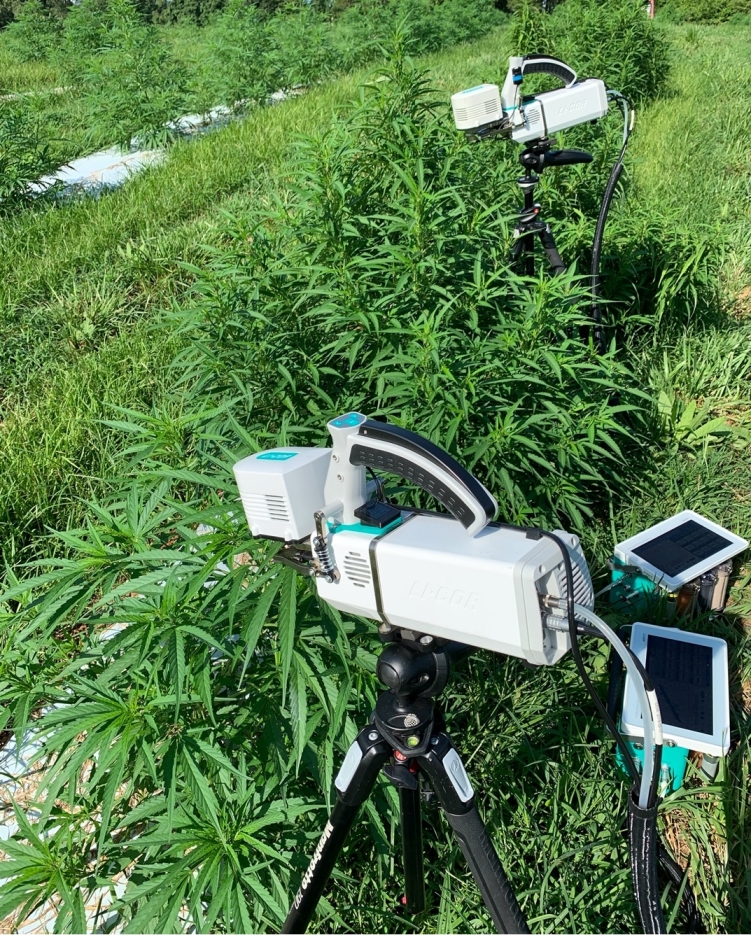
Stomatal ratio was determined with the LI-600 (Figure 1‑14) for all four study plants in each phenological stage. Measurements were made mid-day, on leaflets meeting the same criteria as used for the LI-6800 measurements. Stomatal conductance was measured first on the lower leaflet surface. Then the leaflet was inverted, and stomatal conductance was measured on a different spot on the leaflet that had not previously been clamped in the LI-600.
Stomatal ratio was found to vary with phenological stage: D = 0.048 ±0.017, I = 0.070 ± 0.010, and V = 0.113 ±0.010 (mean ± standard error). Ratios for all stages were dramatically different from the default stomatal ratio used in the LI-6800. By default, the LI-6800 assumes twice as much stomatal conductance from one leaf surface relative to the other (K=0.5). For hemp, the data suggest the relative contributions to total conductance were between 10 and 20 times more from the lower surface than the upper surface, depending on phenological stage.
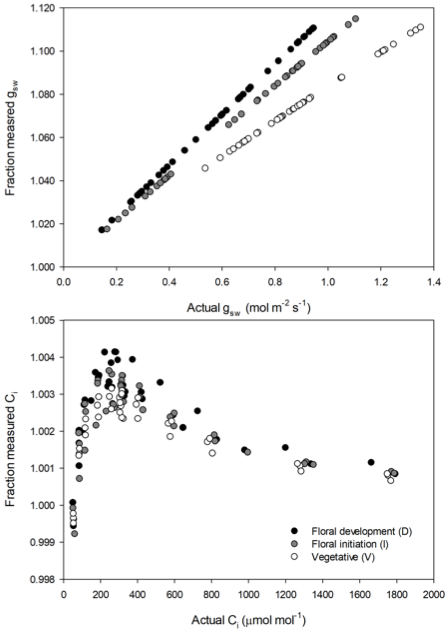
The measured stomatal ratios were used to recalculate gsw and Ci for the CO2 response data collected with the LI-6800 (Figure 1‑15). Errors in gsw resulting from using the incorrect stomatal ratio scale linearly as a function of gsw, increasing in magnitude both as gsw increases and as the real stomatal ratio deviates from the default value. For the data shown here maximum errors approached 12% at the highest gsw. While hemp shows higher conductance than many agronomic plants, errors over the range gsw typical of many agronomic plants were still on the order of 5 to 10%.
The effect of stomatal ratio on Ci is much less pronounced than it is for gsw, with typical errors here less than 0.5% (Figure 1‑15). However small, this error can still be important, as it propagates in to parameter estimates from CO2 response measurements, particularly Vc,max. Conductance is typically not constant during a CO2 response measurement and as such, neither is the error in Ci. In the case of the data shown here, the effect of the changing error on Vc,max estimates from the individual response curves ranged from 0.3% in the best case to 8% in the worst case.
Conclusions of case study 2
Instrument systems often use default values for parameters required to derive reported outputs from direct measurements. Where these parameters can be measured independently and provided to the instrument system, there will be an improvement in the accuracy of the reported outputs. One such required parameter is stomatal ratio, which the LI-6800 needs to derive stomatal conductance and the intercellular CO2 concentration.
- The LI-600 can be used to measure stomatal ratio quickly and easily.
- The stomatal ratio measured with the LI-600 can be used to improve the accuracy of data collected with the LI-6800, as well as parameters estimated from that data.
- Stomatal ratio is not necessarily a constant value for a given species or variety. For the data shown here, there was a clear dependence on phenological stage.