File Management bar
The File Management bar is where you can open, save, export, import, and create .kml files to view your data in Google Earth™ maps or other geospatial analysis tools. This bar also provides the cut, copy, paste, and delete buttons for observations.
Saving data
SoilFluxPro Software lets you save observations of your loaded File Group into a fresh archive of .82z files. Saving data will not overwrite existing files but makes a separate archive. The new archive includes the changes you have made in SoilFluxPro, including recomputed, transformed, repaired, and removed data.
To save data in SoilFluxPro, click Save in the File Management bar.

Select the observations you would like to save and click Save.
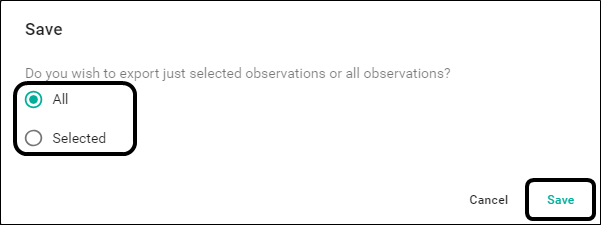
This will open a dialog box. Select the destination where you would like to save the archive, enter a name for the .zip archive, and click Save. You will receive a notification at the bottom of the page that the data was saved.
Exporting data
Exporting data from SoilFluxPro Software lets you take the summary data of your loaded File Group and export it as a .csv file to be opened in Microsoft Excel or statistical analysis software. You can export data using the variables you currently have loaded in the Summary view or you can select particular variables from a list of all variables.
To export a file in SoilFluxPro, click Export in the File Management bar.

Select the observations and columns you would like to export. Same as View will use the same variables you currently have loaded in the Summary view. Other will allow you to tailor which variables to export from a list of all variables. Click Export.
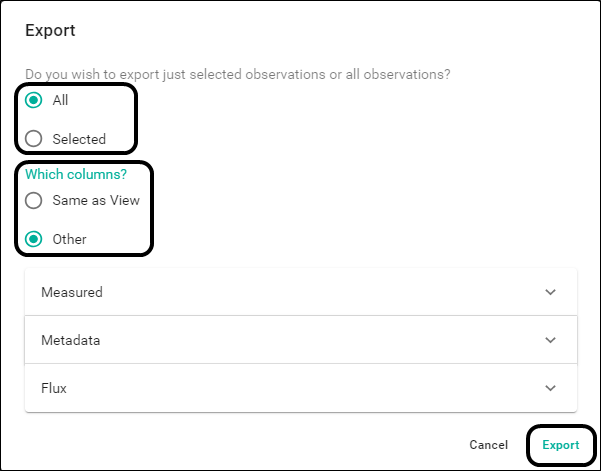
This will open a dialog box. Select the destination where you would like to export the summary data, enter a name for the .csv file, and click Save.
You will receive a notification at the bottom of the page that the data was exported.
Importing data
Importing data lets you import time series data from stand-alone LI-78xx Trace Gas Analyzers and third-party gas analyzers (when used with a LI-COR soil gas flux system) for use in SoilFluxPro.
Imported analyzer data is re-sampled to align its sampling time and frequency with the soil data where it will be imported. Alignment is accomplished by interpolation between the data points on either side of the record that are nearest in time.
Note: To import a file you must first have opened a .82z, .81x, or .json file that corresponds in time and was collected in parallel with the data to be imported.
The Import window can be broken down into three field sections: General, Metadata, and Date & Time.
General
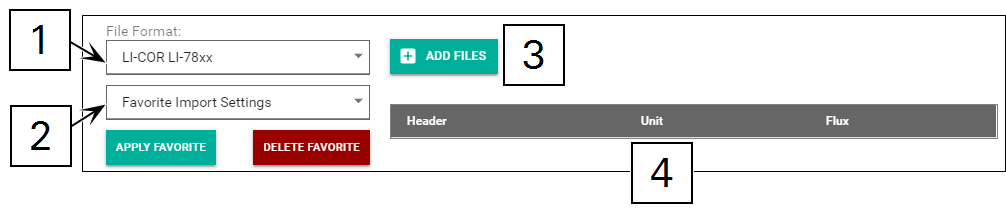
- File Format is based on the type of analyzer you will be importing data from.
- Available options are LI-78xx (for LI-COR Trace Gas Analyzers), General Purpose, LGR, Aerodyne, Gasmet, and Picarro.
- Favorite Import Settings keeps a list of favorite settings you have added so that you can apply them quickly.
- ADD FILES opens a file explorer where you can select your gas analyzer files from your computer or a storage device connected to your computer.
Note: If you have files stored in more than one directory, you will need to ADD FILES multiple times.
- The Variable Selection pane lets you choose which variables you would like to import into SoilFluxPro.
Note: Only numerical data may be imported.
Metadata
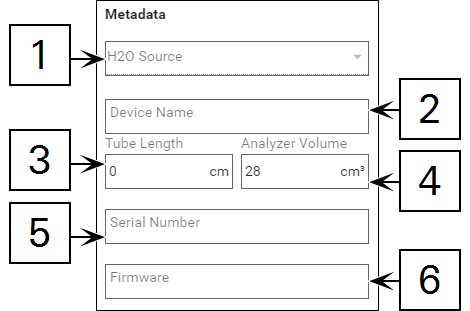
- H2O Source defines the instrument variable that should be referenced for the water vapor measurement used in the dilution correction.
- Device Name assigns the name under which all of the analyzer data will be grouped after importing.
- Tube Length is the length of the tubing that runs between the analyzer and the multiplexer, chamber, or other device. The Tube Length may be zero, but it usually is not.
- Analyzer Volume is the volume of the internal components of the analyzer and must be greater than zero.
- Serial Number (optional) sets the serial number of your analyzer.
- Firmware (optional) records the version of firmware your analyzer was running at the time of the measurements.
Note: For LI-COR LI-78xx Trace Gas Analyzers you will not need to provide the H2O Source, Device Name, Analyzer Volume, Serial Number, or Firmware as these are known.
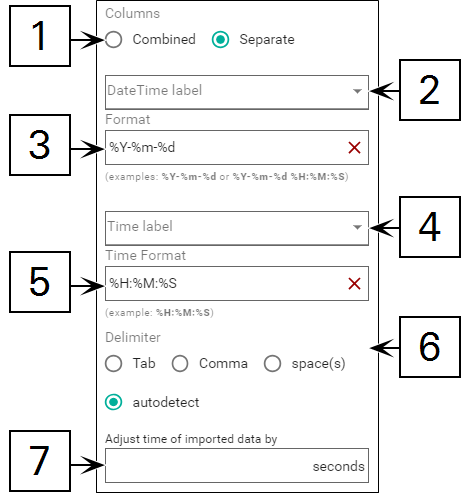
Date & Time
Note: Depending on your File Format, you may not be able change many of these fields because they are known.
- Columns determines whether the Date Time and Time labels described below will be Combined or Separate.
- DateTime label defines the label used to reference the date (and time if combined).
- Date Format provides the format used in the Date Time Label.
- Time label defines the label used to reference the time (if separated from date).
- Time Format provides the format used in the Time Label.
- Delimiter defines what delimiter is used when reading the file. SoilFluxPro can read files with tab, comma, or space delimiters.
- Adjust time of imported data by adjusts the time of imported data to coordinate it with data from .82z, .81x, or .json files. Enter a positive number to shift the imported data forward in time and a negative number shifts it back in time (a +1 second offset makes 10:00:00 in the imported file match up to 10:00:01 in the LI-COR file).
How to import
To import a file into SoilFluxPro:
- Open a .82z, .81x, or .json file (see Opening a file).
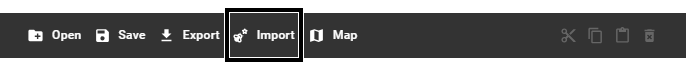
- Click Import in the File Management bar.
- Choose your File Format based on your analyzer.
- ADD FILES from your computer.
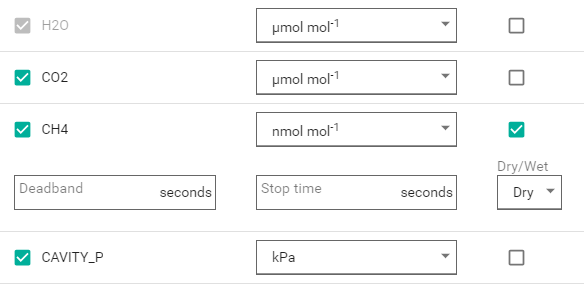
- Select which variables you would like to include and set the units as is appropriate for each variable.
- You can also select which variables you would like to receive a flux calculation for. Flux calculations can be added later if they are not done during Import, but the variables necessary to do so must be imported.
- Any variables with the Flux box checked will also need you to provide a Deadband, Stop time, and to choose whether the flux will be computed for a Wet gas or a Dry gas. The choice of a wet or dry gas determines how dilution is done on the flux calculation.
- A dry gas means the H2O Source will only be used to provide the H2O initial value.
- A wet gas means the H2O Source will be used for the H2O initial value and to convert each gas measurement to a dry mixing ratio.
- CO2, CH4, and N2O from LI-78xx Trace Gas Analyzers are dry gases.
- With LI-78xx Trace Gas Analyzers, many variables are preconfigured and do not need to be set.
- Set the H2O Source.
Note: H2O Source is linked to the variables in the Variable Selection pane. You must set the units for your H2O source to the correct mole fraction for the source to be used in the dilution correction.
- Provide a Device Name.
- Enter the Tube Length and Analyzer Volume.
- Provide the device Serial Number and Firmware.
- For most analyzers you will not need to provide a DateTime Label, Date Format, Time Label, Time Format, or Delimiter. However, if you are using a General Purpose analyzer, you will need to provide these fields.
- Set the number of seconds to Adjust time of imported data by if needed.
- Click Import.
Note: Before clicking Import, consider if this is an analyzer you will be using frequently. If so, it might be useful to save these setting with the ADD TO FAVORITES button to quickly apply these same settings later.
- Save the combined data set to a new set of .82z files (see Saving data).
Saving your favorite import settings
You can save the Import settings as a favorite so you can use them to import other datasets.
Adding a favorite
Adding a favorite takes just a few steps. Once you have entered your settings, click ADD TO FAVORITES at the bottom of the page and give the favorite a name.
You will receive a notification that your favorite has been added.
The name you provided will become the name of the favorite.
Applying a favorite
To apply a favorite that you have saved, click the Favorite Import Settings drop-down.
Select the favorite you would like to apply and click APPLY FAVORITE.
Note: To delete a favorite, select the favorite from the Favorite Import Settings drop-down and click DELETE FAVORITE.
Mapping data
If GPS data is contained in an observation, a .kml file can be created for visualization using Google Earth™ mapping service. The Map tool uses summary data and associates a geographic location to it using location data from the file.
Creating a .kml file
To map your data to a .kml file:
- Decide which observations you would like to map from the Summary view.
- You can select observations individually by clicking on them, or you can use Ctrl + click to select multiple individual observations or Shift + click to select all observations in a range. If you would like to map all observations, press Ctrl + A to select all observations in the Summary view.
- Click Map in the File Management bar.

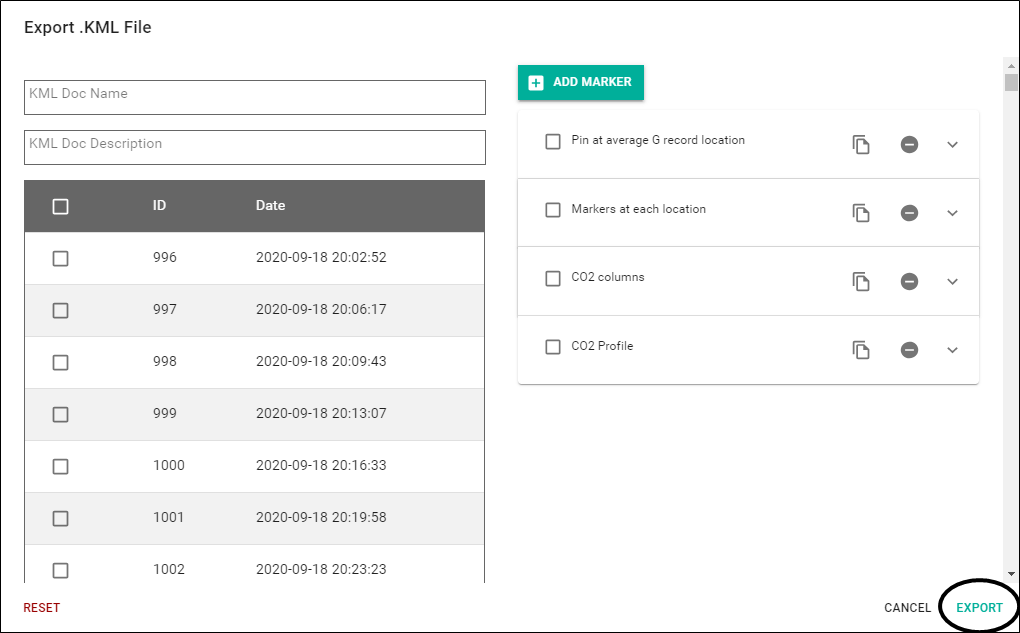
- Give the file a KML Doc Name and KML Doc Description.
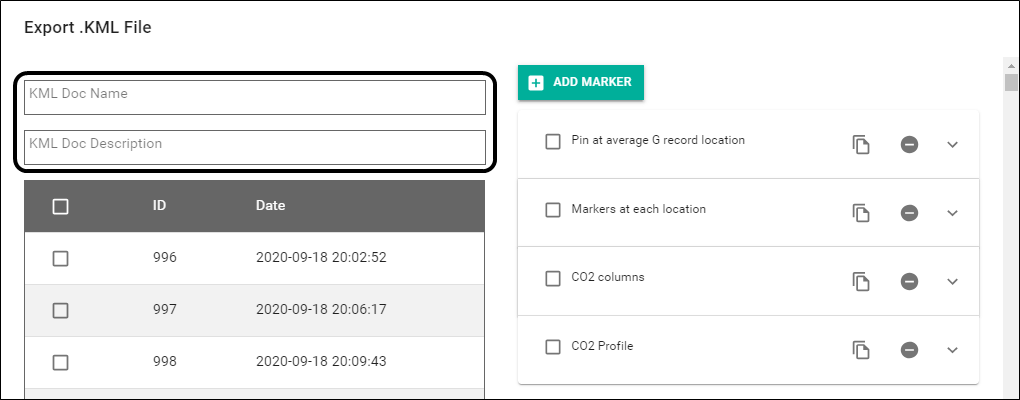
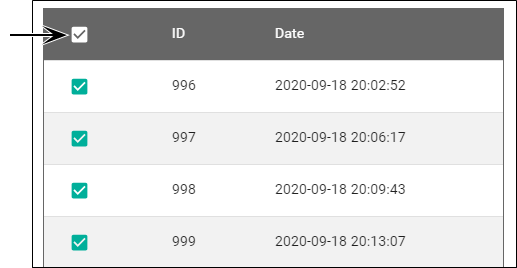
- Select the observation ID to be included in the .kml file.
- You can select observations individually using the checkbox next to them or select them all with the global checkbox at the top.
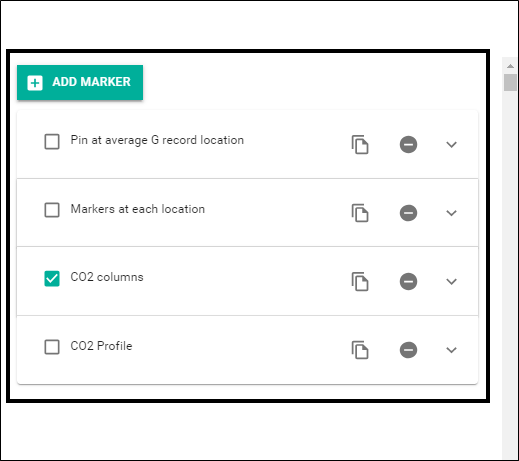
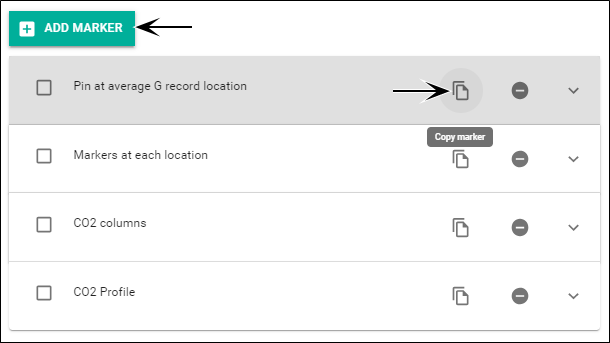
- Choose which markers will be included in your .kml file.
- Several predefined markers are included. You can edit the predefined markers according to your needs. You can also create a new marker by copying one of the existing markers or by clicking ADD MARKER. See Adding or editing a marker for more information.
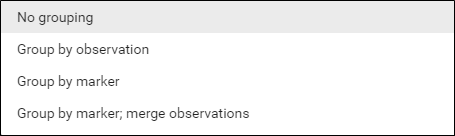
- Select how you would like data grouped under the Group By drop-down.
- If you have many observations, you may need to scroll down to find this menu.
- Click EXPORT.
This will open a dialog box. Select the destination where you would like to export to, enter a name for the .kml file, and click Save. You will receive a notification at the bottom of the page that the KML file was saved.
Adding or editing a marker
You may need to add or edit markers according to your goals. SoilFluxPro Software allows you to edit markers or create new markers.
Adding a marker
You can add a marker by clicking the ADD MARKER button or by clicking the Copy Marker icon of the marker you would like to copy.
Copying a marker will create a new marker of the same name and you can adjust the settings as you need to. ADD MARKER will provide you with an incomplete marker and you will need to enter settings from scratch. We will use an incomplete marker as an example.
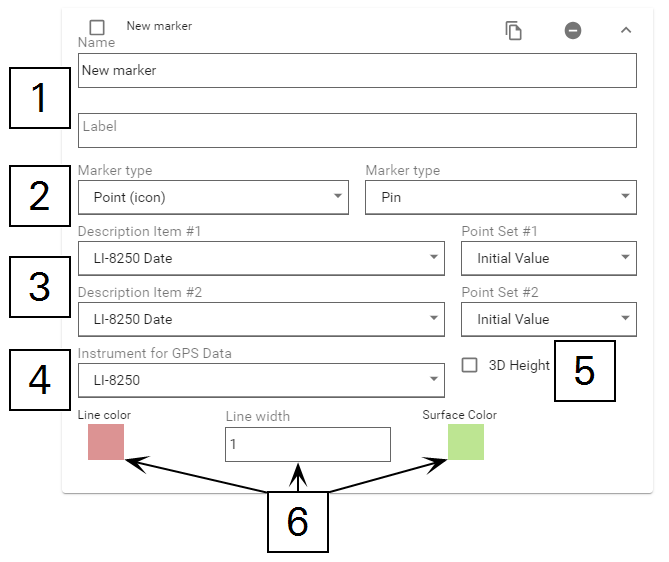
- Give the marker a Name and Label to identify it.
- Choose a Marker type from the drop-down.
- There are several to choose from and some have an additional drop-down to further distinguish the marker.
- Point (icon) will tag locations using a point marker. This type requires you to select another Marker type. Pin will use a green pushpin to mark locations. A and B will mark locations with an inverted teardop marker labeled A or B.
- Point (column) will insert a 3D column (if you have checked 3D Height) proportional to the flux at the location. This type requires you to select Marker column size.
- Path lets you view the path of the measurement. With 3D Height checked, the path also provides a height that is computed from the soil gas flux at each point.
- Polygon will map an area of interest using location data.
- Description Item #1 and Description Item #2 allow you to select which variable data you would like to have mapped, such as CO2 or CH4 flux.
- You will also provide a Point Set #1 or Point Set #2 for each of these variables as either the Initial Value, Mean, Range, or All.
- Choose an Instrument for GPS Data.
- This defaults to the LI-8250 Multiplexer but if you have entered a GPS location to your chambers, these locations can be used to provide a more diverse map.
- Toggle 3D Height.
- Some markers, such as columns, benefit from using a 3D Height proportional to the flux to provide a visualization of flux.
- Select a Line color, Line width, and Surface Color.
Editing a marker
To edit a marker, open the drop-down of the marker you would like to edit and change the settings as needed.
Viewing data on Google Earth™
To view your data using the Google Earth™ mapping service:
- Create a .kml file with your observation data using the steps in Creating a .kml file.
- In your browser, go to google.com/earth.
- Click Launch Earth.
- Open the Projects tab in the sidebar.
- Expand the Open drop-down and select Import KML file from computer.
- This will open a dialog box. Navigate to the .kml file you would like to open and select Open.
Google Earth™ will then load the .kml file and map your data.