The Importance of Water Vapor Measurements and Corrections
Printable PDF: The Importance of Water Vapor Measurements and Corrections
Download this document as a pdf.
Water vapor is known to influence the measurement of carbon dioxide by infrared gas analysis in several ways, which can lead to significant measurement errors. Spectral cross-sensitivity due to absorption band broadening, and inherent instrument cross sensitivity can both cause over estimations of CO2 mole fraction in samples containing water vapor when their effects are not accounted for. Dilution of samples by the addition of water vapor may not be important when measuring actual CO2 mole fractions, but can lead to significant errors in flux measurements. In this note we describe the basis of each of these three processes and discuss how each can affect the measurement of CO2.
Infrared Absorption by Gases and Absorption Band Broadening
At the sub-molecular scale the positions of atoms within molecules are not entirely fixed. As they move they stretch and bend their bonds, creating vibrations within the molecule. Energy differences between the possible vibrational states that result from this movement make it possible for the molecule to absorb infrared radiation. Changes in angular momentum as the molecule rotates about its axis can also cause infrared radiation to be absorbed. The energy differences resulting from changes in the vibrational and rotational states of the molecule cause fluctuations in its dipole moment. These oscillations interact with the alternating electrical field of electromagnetic radiation and if the frequencies of oscillation match, the radiation will be absorbed by the molecule.
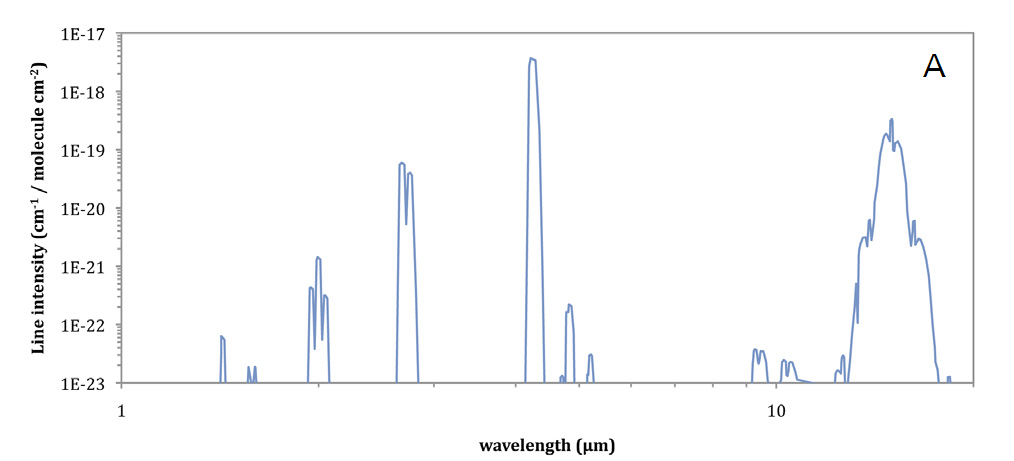
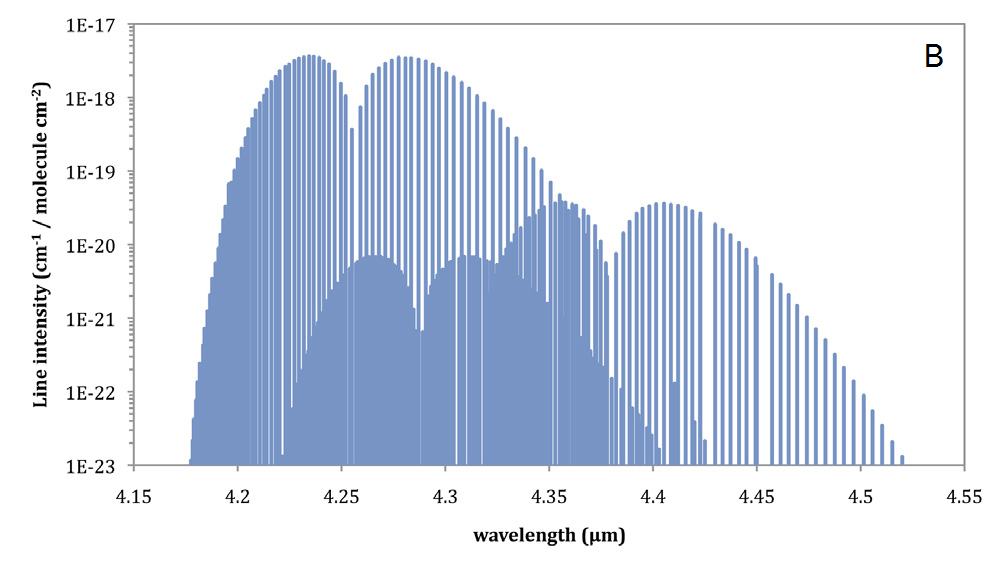
Since the frequency of oscillation for electromagnetic radiation (v) is the inverse of its wavelength (λ=1/v) and the various energy states that lead to its absorption by a molecule are the result of the molecule's structure, the absorption of infrared radiation is both wavelength and absorber species dependent. For a given molecular species, absorption of infrared radiation will occur in bands at various wavelengths across the infrared region of the spectrum (Figure 1, A). Each of these absorption bands is comprised of individual absorption lines (Figure 1, B) that result from rotational transitions, and have a generally Lorentzian line shape described by

where k(v) is the absorption coefficient k of radiation at frequency v, S is the line strength, (v-v0) is the change in frequency across the absorption line and α is the absorption line half width.
For infrared gas analysis with LI-COR gas analyzers, we are interested in measuring the total absorption of infrared light across a given waveband to determine absorber species concentration. The total absorption measured by the analyzer, A is in principle the result of integrating the absorption across the entire band as shown by
2

where A'(ν) is the absorption of infrared radiation at a given radiation frequency, and is given by Beer-Lambert's Law
3

where w is the absorber concentration and l is the optical path length (Burch and Williams 1964). These relationships form the basic principles behind the calibration functions employed in LI-COR gas analyzers, because they allow us to relate the measured absorption to the absorber concentration. Because the relationship between w and A'(v) is influenced by k(v), anything that influences k(v) will affect A and has to be accounted for in the calibration function.
Recalling from equation 1, the absorption coefficient k is a function of radiation frequency, and is a product of the line strength, S, and absorption line half width, α. For the range of conditions typically encountered in IRGA measurements, we can treat S as a constant for a given frequency (Burch et al. 1962). However, since individual absorption features are the product of changes in energy states anything that induces a change in energy state will influence α. From Kinetic Theory it can be shown that α is a function of intermolecular collision frequency:

where ρi is the number of molecules of type i in a given volume, Da,i is the sum of the optical collision diameters of the absorber molecule and a molecule of type i, and ma and mi are the masses of the absorber molecule and a molecule of type i, respectively. Equation 4 indicates that there are a handful of physical factors that influence the width of spectral lines, and shows the theoretical basis for band broadening (also referred to as collisional or pressure broadening) of spectral features.
The density of component i in a gas mixture, ρi is a product of both the pressure (P) and temperature (T) in the gas mixture as given by the Ideal Gas Law:
5

where R is the ideal gas constant. As a result the width of individual spectral lines changes with both T and P. However, the total absorption of an individual line does not change. As the lines become broader, tightly spaced lines comprising absorption bands overlap. This causes the total absorption of the band to increase, despite no change in the absorption of each of the individual absorption lines comprising the band.
Effective pressure: The terms Da,i, ma and mi in equation 4 vary depending on the species of absorber molecule and the interacting molecules in the gas mixture. Thus, not all molecular species are equally effective at broadening the absorption lines of another species and their total broadening effect is influenced by their abundance in the mixture. This leads to the concept of effective pressure, where the total broadening potential of a component in a gas mixture is a function of both its partial pressure (pi) and a weighting factor (ai) as given by
6

where PEi is the effective pressure of component i in the mixture. The weighting factor ai, is generally expressed relative to the broadening potential of nitrogen (aN2=1), and is larger for molecules similar to the absorber species (Table 1).
| Absorbing Gas | Band (cm-1) | Broadening Gas | ai |
|---|---|---|---|
| N2O | 2224 | O2 CH4 N2O |
0.83 1.08 1.12 |
| CO | 2143 | CH4 CO |
1.12 1.02 |
| CO2 | 2350 | CO2 | 1.3 |
| CH4 | 3020 | CO2 CH4 |
1.25 1.3 |
In a gas mixture, both the species of interest and all other species in the mixture can exert a broadening effect on the measurement. For measurements of CO2 in moist air the total effective pressure (PE) of the gas mixture can be written as

where pc is the partial pressure of CO2, ac is the self broadening coefficient for CO2, pw is the partial pressure of water vapor, aw is the broadening coefficient for water vapor on CO2, pa is the partial pressure of dry air and aa is the broadening coefficient for dry air on CO2. Over the range of partial pressures typically encountered in atmospheric measurements, the partial pressure of CO2 is so small that its self-broadening potential can be neglected. LI-COR calibrates all of its analyzers using mixtures of CO2 in air. If individual components in dry air are constant then aa can be taken as 1 and equation 7 rewritten as

Equation 8 is implemented in the calibration functions used by most LI-COR gas analyzers in a slightly different form. Given that the total pressure (P) of a gas mixture is the sum of the partial pressures of its components, neglecting CO2

By dividing by P, equation 9 can be rewritten in units of mole fraction
10

where Xa is the mole fraction of dry air and Xw is the mole fraction of water vapor. Substituting from equation (10), equation (8) can be rewritten in such a way that only the mole fraction of water vapor and the total pressure need to be known to correct the measured absorption for band broadening:


where the function  . Equation 11 gives the form of the band broadening correction applied in the calibration functions of most LI-COR gas analyzers. The exceptions are those analyzers which do not measure water vapor, such as the LI-830. The LI-6400/XT includes an additional broadening term based on user specified oxygen content of the sample gas. This makes possible accurate measurements of photosynthesis under non-photorespiratory conditions.
Theory suggests the value of aw should be constant and could be applied to all gas analyzers. In practice however, we find that when aw is empirically derived from measurements made by a gas analyzer, its value is unique to that type of gas analyzer. This discrepancy results from differences in the optics employed in the different analyzers, and is a property of their spectral band width and transmittance. A summary of the band broadening coefficients employed in LI-COR gas analyzers is given in the appendix. It should be noted that these values are different from values of aw published in the literature, both because they are analyzer specific and because they use dry air rather than nitrogen as a reference.
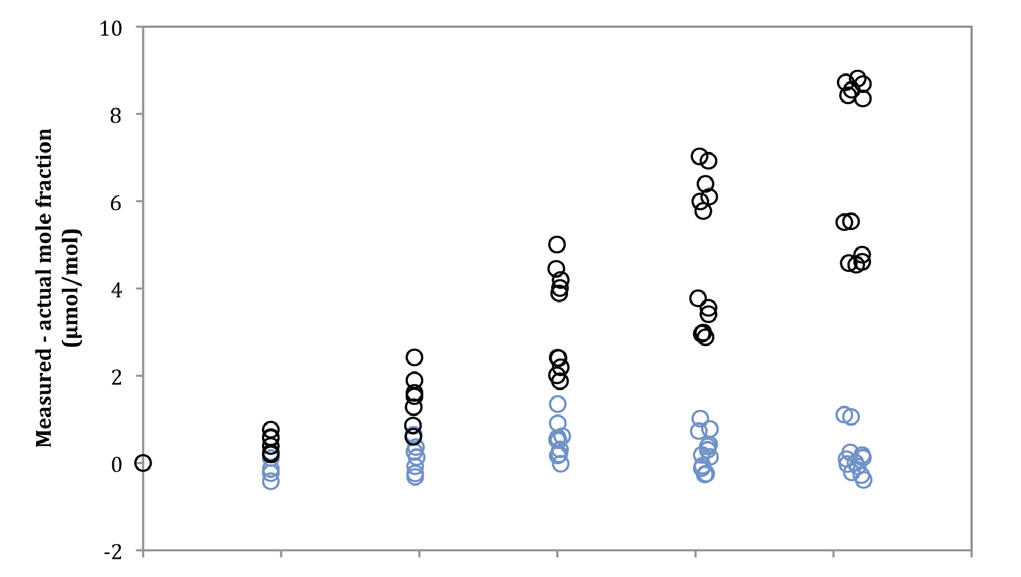
The effect of band broadening on the measurement is relatively small, but is still significant. Band broadening causes an increase in the apparent CO2 mole fraction, as shown by the uncorrected data in Figure 2. This occurs because a gas mixture containing water vapor will always have a larger value for PE as compared to P. While the errors in Figure 2 are only on the order of one percent, they can still be reduced significantly by applying a band broadening correction.
Instrument Cross-sensitivity
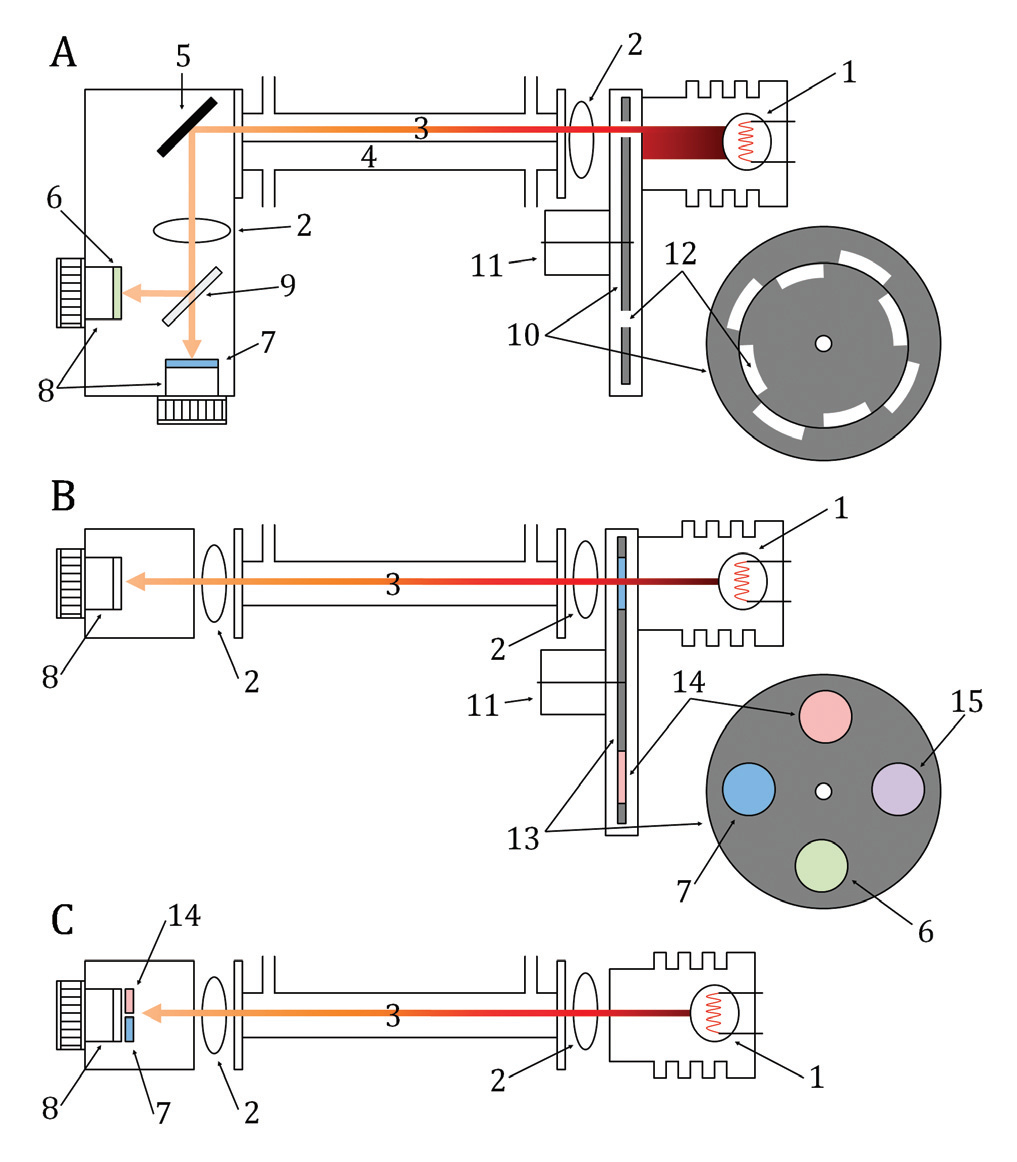
Cross-sensitivity due to direct absorption: In its simplest form the optical bench of an infrared gas analyzer (IRGA) consists of a source of infrared radiation and means of detecting radiant power, with a gas sample positioned in between the two. In practice however, the optical bench of an IRGA (Figure 3) designed to measure CO2 and water vapor is more complicated because both species absorb infrared radiation in the same general region of the spectrum. Instruments employing broad band sources, such as the heated filaments used in most LI-COR gas analyzers, use optical filters to isolate absorption bands specific to the absorber species of interest. If absorption features from other gases fall in the transmission band of these filters, the instrument will show a cross sensitivity to those gases. Additionally, while these optical filters have a defined bandwidth of peak transmittance, they can show some slight out of band transmission. When this out of band transmission corresponds to a region of absorption for another gas species the instrument can show cross-sensitivity to that gas species.
The effect of cross-sensitivity due to direct absorption is an over estimation of the absorber species concentration when the interfering gas is present in the sample. For instruments that show this type of cross-sensitivity it can be corrected for in the instruments' calibration function.
Electrical cross-sensitivity: Since absorption is not directly measurable, it is calculated from the transmittance of radiation through the sample as
12

where Φi is the transmitted radiant power in the presence of the absorber species and Φo is the transmitted radiant power in the absence of the absorber species. The terms Φi and Φo can be determined from measurements at two different wavebands, one centered on an absorption band of the target species (in-band) and one centered in a region of no absorption by the target species (out-of-band), or by comparing measurements between two separate gas samples. This leads to two basic approaches to the instrument design, utilizing either a mechanical or optical differential to determine Φi and Φo (Figure 3).
In instruments using an optical differential approach, the in and out-of-band filters maybe mounted on a spinning filter wheel that moves them sequentially in line with the detector (Figure 3B). The timing of the wheel is precisely controlled such that when the appropriate filter is in line the instrument makes a measurement of Φi or Φo for either CO2 or water vapor. In this scheme the time response of the detector can cause an additional form of cross-sensitivity. The detectors used in IRGAs capture radiant energy and convert it to an electrical current. These detectors can show a small lag in the signal rise and decay from the start and stop of the radiation (i.e. the time period between when a filter comes in and out of line with the detector). While the time span of this lag is extremely small, when the detector output is sampled at high frequency the decay lag from one filter can overlap the next filter. In this situation the instrument can show a cross-sensitivity between the CO2 and H2O measurements. However, because the overlapping signal is small the magnitude of this cross-sensitivity is also small.
Some LI-COR gas analyzers are known to show a slight cross-sensitivity in their measurements between CO2 and water vapor. Those that do include a cross-sensitivity term in their calibration functions, which corrects for this effect. Because the processes leading to the cross-sensitivity are due to component-specific properties, each analyzer is individually characterized for cross-sensitivity during the calibration procedure. A summary of which LI-COR analyzers include a cross-sensitivity correction is included in the appendix. For these analyzers the cross-sensitivity correction is significantly smaller than that for band broadening.
Dilution by Foreign Gases
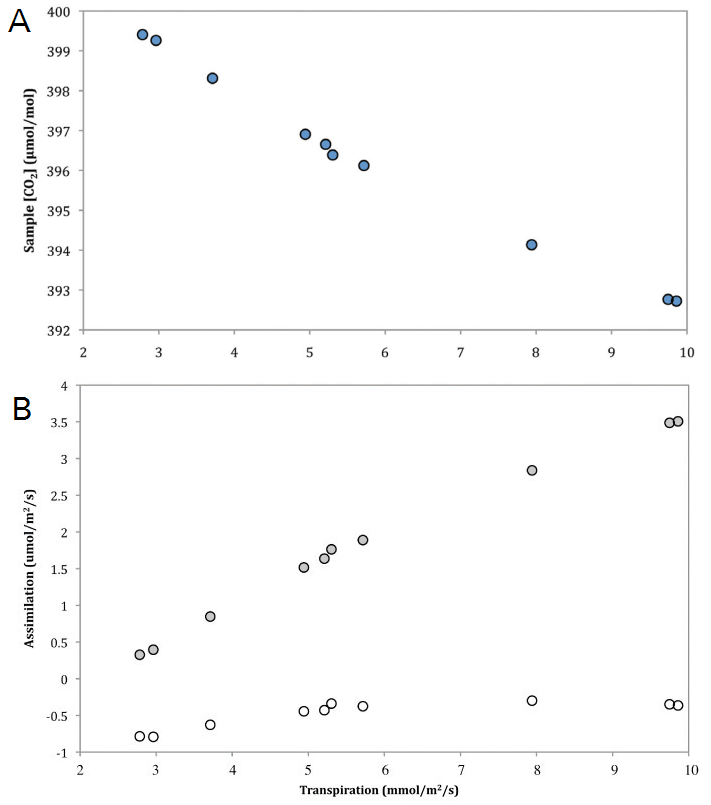
Unlike the broadening of spectral lines by foreign gases or instrument cross-sensitivity, dilution of samples by foreign gases does not cause errors in the actual measurement of the absorber gas. Rather the correction of concentration data for dilution effects yields a theoretical concentration of a component in a gas mixture assuming some concentration of the diluting gas. As such, adjusting for dilution effects is not important in all measurements. For measurements where the goal is simply to know the CO2 content of a given gas sample, a dilution correction may not be needed. However, in situations where comparisons are to be made between mole fractions of one component in varying gas mixtures, correcting for the dilution effect can be very important (Penning et al. 1984). A common example is when calculating carbon fluxes from measurements of CO2 mole fractions in air. If the system used to make the flux measurements operates under constant pressure and the sample is not dried before reaching the IRGA, the influx of water vapor to the system due to transpiration and/or evaporation will cause a proportionate decrease in the sample CO2 concentration (Figure 4, A). Without applying a dilution correction, under these conditions carbon uptake will be overestimated and carbon losses will be underestimated. Figure 4, B shows corresponding flux calculations for both diluted measurements and dilution corrected measurements. It is clear that the uncorrected measurements indicated a sizable carbon uptake, even though the sample material was inert.
In practice we are often interested in knowing the mole fraction of CO2 in the absence of water vapor, or standardizing two CO2 measurements to the same water vapor content. In the first case, equation 20 can be written in standard units of measurement for the two gases as

where c is the mole fraction of CO2 (μmol/mol) in dry air, c' is the measured CO2 mole fraction (μmol/mol) of wet air, and w is the measured water vapor mole fraction (mmol/ mol). In the latter case, correcting one measurement to the water vapor concentration in another is done by multiplying one of the measured CO2 mole fractions by the ratio of the bracketed term in equation (17) for the two measurements, as shown by

where  is the mole fraction of CO2 in the sample (μmol/mol) corrected to the water vapor content of the reference measurement wr (mmol/mol),
  is the mole fraction of CO2 measured in the sample (μmol/mol), and ws is the water vapor content in the sample (mmol/mol).
For flux measurements, equation (13) or (14) may be applied to raw concentration data or a dilution correction may be embedded within the flux equation. Figure 5 provides examples of some common flux measurements and how a dilution correction is applied in each. The appendix includes a summary of which LI-COR gas analyzers apply dilution corrections and how the correction is implemented.
Deriving the Dilution Correction
For any gas mixture at constant temperature and pressure, an increase in the quantity of one of its components will result in an equivalent decrease in the quantity of the remaining components. This occurs because, as shown by the Ideal Gas Law at any given temperature and pressure, only a certain number of molecules (N) can occupy a given volume (V)
15

If N represents the total number of molecules in a multicomponent gas mixture, then N is equal to the sum of the quantities of its components (ni), in moles

If some quantity of a diluting gas (nd) is added to this mixture, while pressure and temperature remain constant, then the sum of ni must be reduced by an equivalent amount as shown by


where n’i is the diluted molar quantity of component i in the mixture. The term in brackets in equation (17) represents the proportion of the total number of moles in the mixture comprised by all components excluding the diluting gas. Substituting for N from equation (16) yields

which is solvable for the number of moles of all components if the diluting gas were not present. Equation (18) can be rewritten in terms of mole fraction by dividing by N to yield
19

where the mole fraction of component i, Xi, is equal to ni/N. This can be written for a single component of the gas mixture as

to give the mole fraction of component i in the absence of the diluting gas.
| Flux Equation | Dilution Term | ||
|---|---|---|---|
| Open System | 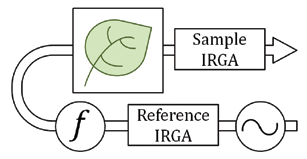
|

|

|
| Eddy Covariance; Open Path Analyzer | 
|

|

|
| Closed System | 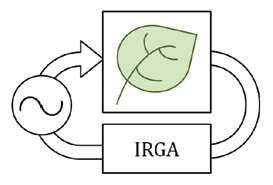
|

|

|
| Eddy Covariance; Closed Path Analyzer | 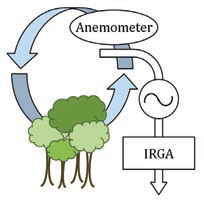
|

|

|
| Fc is flux of CO2; f is flow; X’cr is reference cell CO2 mole fraction; X’cs is sample cell CO2 mole fraction; Xwr is reference cell water vapor mole fraction; Xws is sample cell water vapor mole fraction; s is area; Xcswr is dilution corrected sample cell CO2 mole fraction; dXc/dt is change in dilution corrected CO2 mole fraction with time; Xc is dilution corrected CO2 mole fraction; X’c is measured CO2 mole fraction; Xw is water vapor mole fraction; w' is fluctuation in mean vertical wind speed; ρ’c is fluctuation in mean CO2 density; μ is ratio of molecular weights of dry air and water vapor; ρc is mean CO2 density, ρa is mean dry air density; ρv is mean water vapor density; T' is fluctuation in mean air temperature; T is mean air temperature | |||
Summary of water vapor corrections applied in LI-COR gas analyzers
| Instrument | Species Detected | Band Broadening Coefficient (aw) | Cross Sensitivity |
Dilution Correction |
Implementation |
|---|---|---|---|---|---|
| LI-800, LI-820, LI-830 | CO2 | None | No | ||
| LI-840/A, LI-850, LI-870 | CO2 and H2O | 1.451 | H2O on CO2 | No | |
| LI-62002 | CO2 | None | Yes | Carbon dioxide mole fraction is not dilution corrected, but a transpiration correction is applied in the photosynthesis equation. | |
| LI-6251 | CO2 | 1.57 | No | Band broadening and dilution corrections are not applied by the instrument. They can be applied to the data post collection following the instructions in the user manual. | |
| LI-6252 | CO2 | 1.57 | Yes (optional) | Band broadening and dilution corrections can be applied if the water vapor concentration is supplied to the instrument via an external sensor. The dilution correction is the same as applied in the LI‑6262. | |
| LI-6262 | CO2 and H2O | 1.57 | Yes | Using FCT 76 a dilution correction can be applied, which adjusts the sample CO2 mole fraction to the same water vapor content as that in the reference cell. | |
| LI-6400/XT | CO2 and H2O | 1.5 | Yes | A dilution correction is applied in the photosynthesis equation. When configured as a closed system, the instrument calculates the CO2 mole fraction relative to dry air. | |
| LI-6800 | CO2 and H2O | 1.4 | Yes | ||
| LI-7000 | CO2 and H2O | 1.57 | No | ||
| LI-7200/RS | CO2 and H2O | 1.15 | CO2 on H2O H2O on CO2 |
Yes | Calculates CO2 and water vapor mole fractions relative to dry air. |
| LI‑7500/A/RS/DS | CO2 and H2O | 1.15 | CO2 on H2O H2O on CO2 |
No | |
| LI-8100A | CO2 and H2O | 1.15 | CO2 on H2O H2O on CO2 |
Yes | Calculates the CO2 mole fraction relative to dry air for use in flux calculations. |
References
| 1 | Burch, D.E. and D. Williams. 1964. Test of theoretical band model approximations. Applied Optics 3:55-61 |
| 2 | Burch, D.E., E.B. Singleton and D. Williams. 1962. Absorption line broadening in the infrared. Applied Optics 1:359-363 |
| 3 | McDermitt, D.K., J.M. Welles and R.D. Eckles. 1993. Effects of temperature, pressure and water vapor on gas phase infrared absorption by CO2. LI-COR, Inc. |
| 4 | Parkinson, K.J. 1971. Carbon dioxide infra-red gas analysis. Journal of Experimental Botany 22:169-176 |
| 5 | Penning de Vries, F. W. T., J. W. J. Akkersdijk and J. L. P. van Oorschot. 1984. An error in measuring respiration and photosynthesis due to transpiration. Photosynthetica 18:146-149 |
| 6 | Rothman, W.C., C.P. Rinsland, et al. 1998. The HITRAN molecular spectroscopic database and HAWKS (HITRAN Atmospheric Workstation). 1996 ed. Journal of Quantitative Spectroscopy & Radiative Transfer 60:665-710 |
| 7 | Webb, E.K., G.I. Pearman, and R. Leuning. 1980. Correction of flux measurements for density effects due to heat and water vapor transfer. Quarterly Journal of the Royal Meteorological Society 106:85-100 |
| 8 | Welles, J.M. and D.K. McDermitt. 2005. Measuring carbon dioxide in the atmosphere. Micrometeorology in agricultural systems, Agronomy Monograph no. 47:287-320 |