LI-Integrator - Software for Small Volume Measurements
Printable PDF: LI-Integrator - Software for Small Volume Measurements
(TechTip_LI-Integrator-Application_19710)
Download this content as a pdf that can be saved to your computer or printed.
Small volume measurements are required in scenarios where the sample of air available is too little to flow through the analyzer. Under such conditions a calibration curve is first built by injecting gases of known concentration and volume into a carrier gas flowing through the analyzer. This can be done either in a closed loop (using the concentration changes pre- and post- injection) or an open loop (using the area under the curve or peak values from an injection curve). Multiple application notes are available describing this procedure for various LI-COR gas analyzers. Those technical notes are at the links below.
- Trace Gas Analyzers (e.g., LI-7810): licor.com/support/Trace-Gas-Analyzers/topics/measuring-small-gas-samples.html
- LI-8100A: licor.com/support/LI-8100A/topics/acu124-small-volume.html
- LI-6200: licor.app.boxenterprise.net/s/aiudjojuhdna58iqvfha
The goal of this tech tip is to introduce and provide an easy-to-use software to collect small volume injection data from these gas analyzers. The software provides option to start data collection, collect the raw data, and calculate and provide a table view of the area under the curve/peak values or change in concentration. The collected data can be saved as a file along with the option to collect the raw data.
- For 32-bit Windows computers: licor.app.boxenterprise.net/s/wi1a8qbaba0ow5cn2kfpt9muq61n1dhr
- For 64-bit Windows computers: licor.app.boxenterprise.net/s/1p65n1nhxgqbq19s6ryxiglv3m35vret
Overview
The LI-Integrator is python based executable program which can be used for small volume injection studies to estimation concentration of unknown sample of gas. The methodology usually involves injecting the sample of gas of unknown concentration into a carrier gas which in most cases is a zero gas. The peak concentration or area under the curve observed after injection is used to determine the concentration of the sample gas by comparing it to a calibration curve generated from a range of known samples. This methodology is usually used when the gas analyzer is plumbed in an open loop. This type of measurement can also be done in closed loop with an analyzer and when a closed loop is used, the change in concentration before and after the injection can be used to estimate the concentration of the unknown gas using a calibration curve.
What it does?
This software will work with the LI-8xx series and the LI-78xx series of analyzers to collect the data and estimate the peak or area under the curve in the open loop methodology or to calculate the change in concentration before and after the injection via the closed loop methodology. The software can only connect to one analyzer at a time. The raw data during the injection procedure can be save and the results also can be saved to a predetermined location in your computer. This is in a directory in the user folder of the computer (C:\Users\User.Name\LI-Integrator\). This does not automatically build a calibration curve or estimate the concentration of the unknown gas, but all the data required to make the curve and estimate the concentration of the unknown gas is provided. This program has a feature to estimate the baseline and remove that from the calculation. There is also a feature to account for trends in the data that may occur when closed loop observations are made.
The software provides the option to log the raw data to a data file which is named based on the current day. If you are doing multiple runs, the raw data collected when the start button is pressed will be appended to that single file with a time stamp. Newer files are created for different days. The results displayed in the table can be saved to a file and this can be done anytime during the experiment and multiple files can be created as you click the button multiple times and the files are named with the current date and time information. There is also option to copy the results table to the clip board, so that you can paste it to programs like Microsoft excel. These buttons only get enabled when data starts accumulating in the table.
If the check box to integrate CH4/N2O is clicked, the integration and peak detection will be done on CH4/N2O. The close buttons are independent for LI-8xx analyzers and for the LI-78xx analyzers. The close button for the LI-8xx analyzers and LI-78xx analyzers closes the application completely.
Methodology
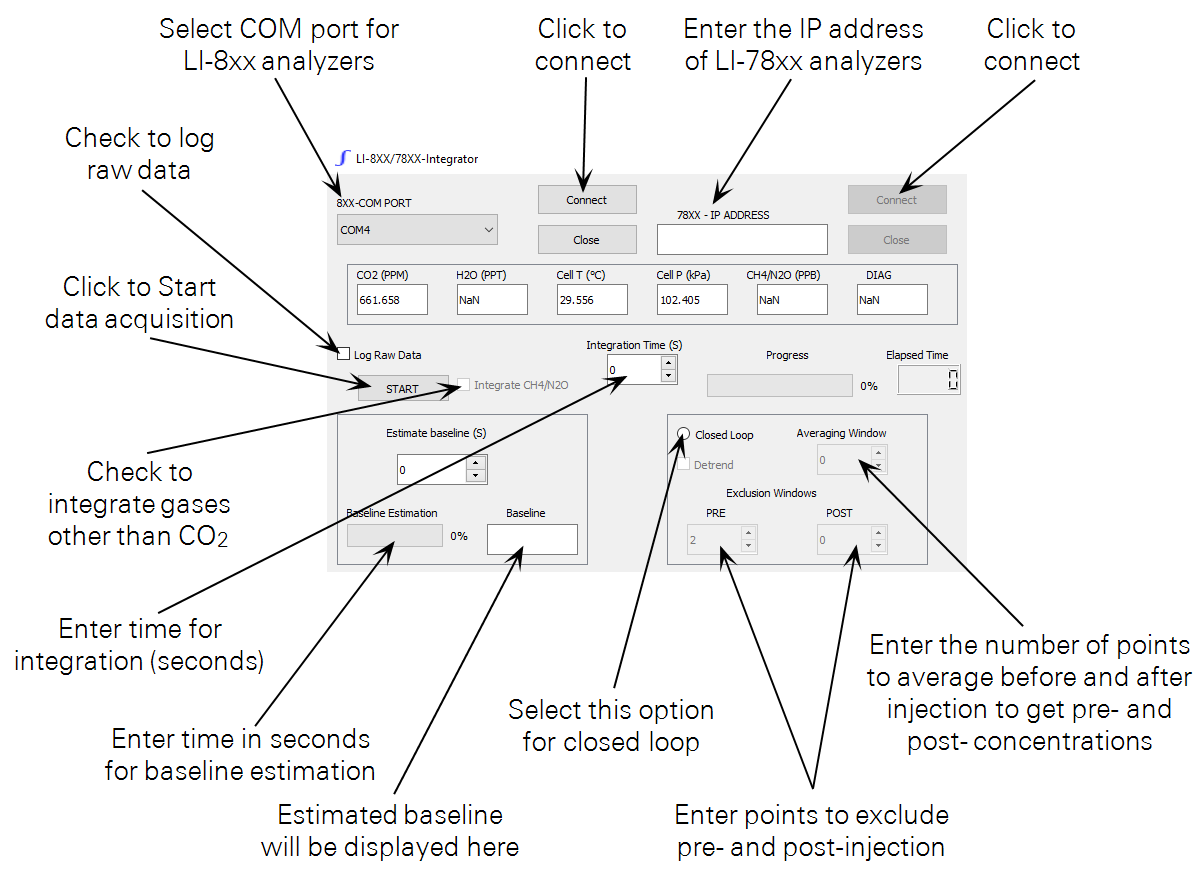
The user must provide an integration time in seconds, and this is the time from right before the injection to the time when the injected sample leaves the system. This must be estimated based on trials and it depends upon the amount of sample used for injection and how it is injected into the system. For open loop systems you only must provide the integration time and the peak concentration and area under the curve is estimated using the data collected during the integration period which starts right after the start button is pressed. The area under the curve is calculated using the trapezoidal integration method. If baseline concentration estimation is needed, a predetermined time interval in seconds should be entered into the Estimate baseline box. Once the start button is pressed, the baseline concentration is estimated by averaging the data collected for the interval entered in the baseline box. The progress of the baseline estimation will be displayed for convenience and you will have to inject the sample immediately after this is done. The baseline estimation time is not part of the integration time.
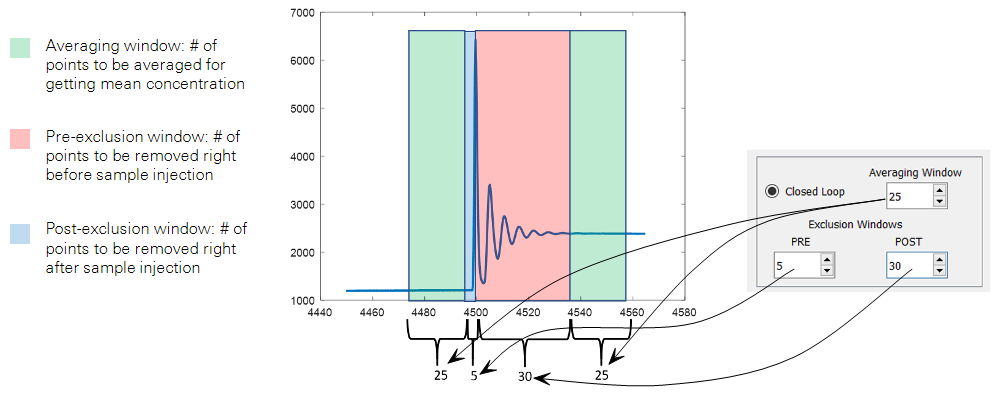
For closed loop systems, an averaging windows and exclusions windows should be provided. The exclusion windows are used to remove the data points before and after the injection when the system became unstable as the sample gas in injected. The averaging window is the number of points to be averaged to estimate the pre-injection and post injection concentration which is used to determine the delta concentration. The pre-exclusion window is usually much smaller than the post exclusion window as the system goes through a gas injection event. The same number of points are averaged to get the mean pre- and post- concentration using the input in the averaging window. For closed loop systems, the total integration time should be more than twice the averaging window + pre- and post- exclusion windows.
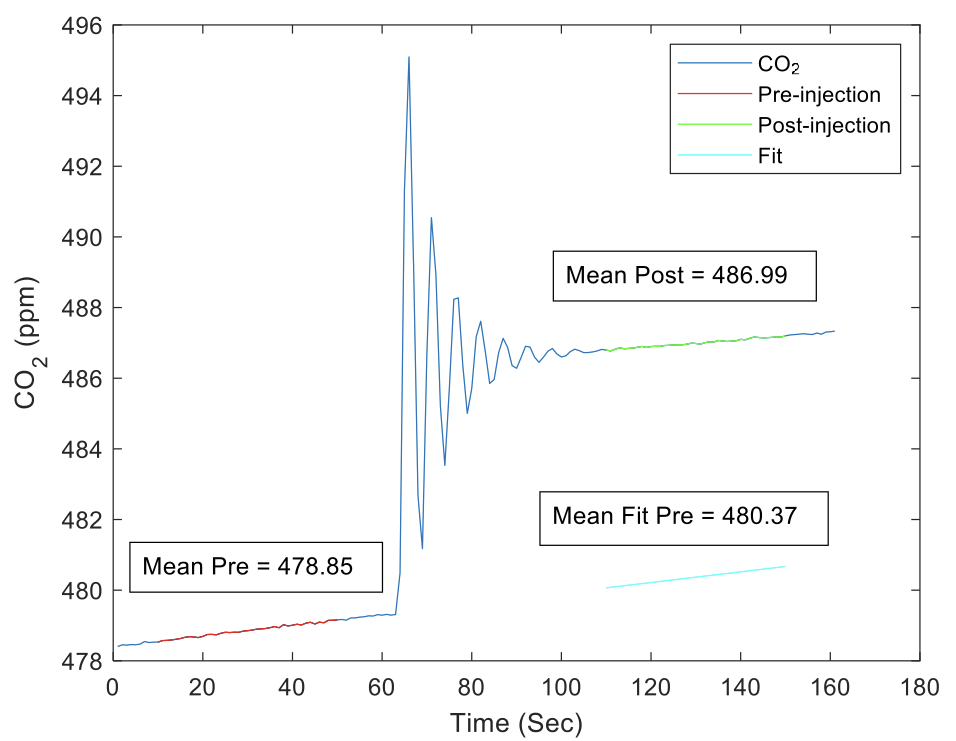
If linear trends are expected in the data stream (in some closed loop systems), the detrend option can be selected to extrapolate pre-injection concentration to the post inject time. With this option selected, a linear fit is done on the pre-inject gas time series and then the linear fit is evaluated on the time sequence of the post injection so that a new pre-injection concentration time series is generated which will account for the trend in the pre-injection time series if there was no injection event. In the example depicted below, the delta without accounting for trend is 8.14 ppm and with accounting for trend is 6.62 ppm.
The program expects the data to be coming in at 1 Hz. This is always true for the LI-78xx series analyzers, but for the LI-8xx series analyzers, you can have the system output at 0.5 Hz. So, for the LI-8xx analyzers, it is essential that you use the windows interface software, set the output rate to 1 Hz, disconnect from it and then use the LI-Integrator software to collect data from it.
The steps to collect the data using this software are:
- Make sure the device is working and outputting data using the instrument software and then close the instrument software.
- Set up the instrumentation and the injection setup and connect with the software
- Make sure data is streaming properly through the software and stable conditions are achieved.
- Click the start button and proceed with the injection of sample. In case of baseline estimation is required, wait for baseline calculations to be over and proceed with injection of sample right afterward.
- For closed loop systems, wait for enough time to enable calculation of pre-injection concentration, followed by the injection.
- Ensure that the injection event is completed within the set integration time.
Software Buttons

|
The connect button is used to connect to the device after the COM port or the IP address is provided to connect to the gas analyzer |

|
The close button closes the connection to the gas analyzer and then closes the software. A confirmation message will pop up as the software is closing. |

|
This button starts the integration process. |

|
Copies the results table to a text file which is stored in the home directory of the user. |

|
Copies the result table to the clipboard so that it can be pasted to any other software |

|
This can reset the table and all the data will be removed. This button can also be used to switch from an open loop to a closed loop setting with an actively connected instrument. |
Description of the Data Table
The data collected in the result table is the results generated by the software. The contents of this table can vary based on the nature of the experiment. For peak or area under the curve type experiments, the result table will contain the following outputs as shown below.
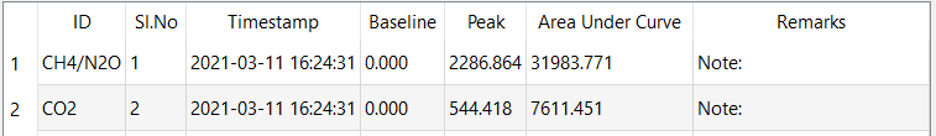
Here ID refers to the gas type and this can be either CH4/N2O or CO2. If you are using a LI-78xx series analyzer which outputs CO2 concentration along with another trace gas such as CH4, the CO2 calculations are done automatically, and the results are displayed in the table directly below the main trace gas.
In the case of a closed loop experiment, the result table headers vary and are displayed as shown below.
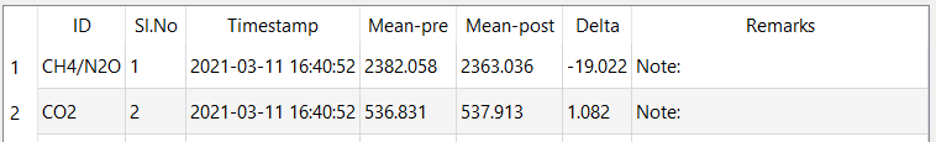
The Remarks field is editable and notes written into the field will be saved along with the data.
System Requirements
Operating System: Windows 10; 32-bit or 64-bit architecture
Screen Resolution: 1920 × 10801 px
Space Required: 500 MB