
Dashboards
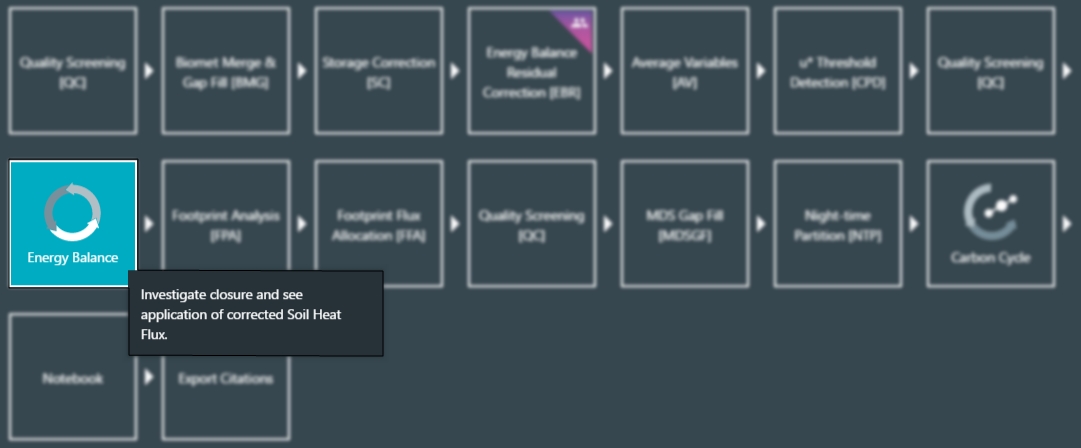
You can choose an analysis period and plot the regression of incoming and outgoing energy to determine how balanced the system is. This is done under Dashboards > Energy Balance.

In terms of workflow, the Energy balance tool is used after some initial quality screening is completed.
Energy balance overview
The following description is excerpted from Burba, 2013, Eddy Covariance Method for Scientific, Industrial, Agricultural, and Regulatory Applications.
One way to validate fluxes measured with the eddy covariance method is to construct an energy budget for the study site. Two traditional examples (daytime and nighttime) with key components of the energy budget are shown in Figure 3‑1 and described by equation 3‑1. Rn is net radiation; LE is latent heat flux; H is sensible heat flux, and G is the sum of soil heat flux and soil heat storage.
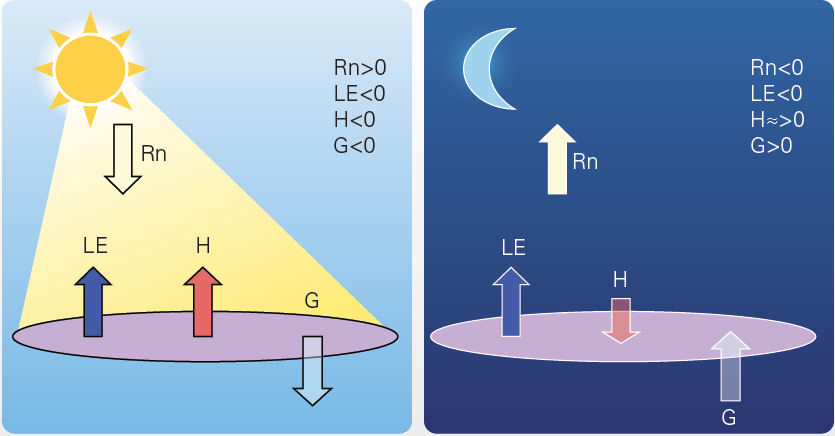

These examples illustrate a simplified four-component equation for an energy budget, where net radiation is usually measured with a net radiometer, or with other radiation sensor, soil heat flux is usually calculated from heat flux plates and soil temperature, and latent and sensible heat fluxes come from eddy covariance measurements. (In reality, there are additional terms in the energy budget equation that describe other sources and sinks of energy, such as energy stored as heat by the vegetation, energy used for photosynthesis, and so on.)
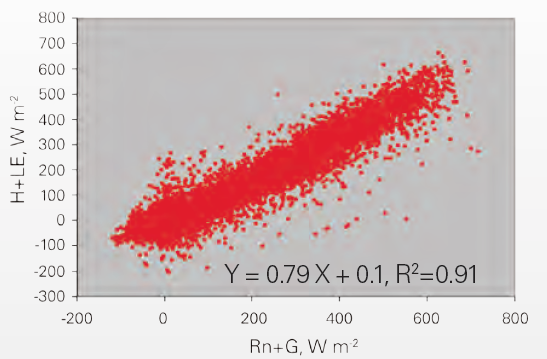
The idea of validating an energy budget is simply the following: if all of the key components sum up to zero as required by conservation of energy, then all energy transfers have been successfully accounted for, and sensible and latent heat fluxes were measured correctly. Since the latter was measured correctly by eddy covariance, the CO2 and other trace gas fluxes were likely measured correctly as well.
A challenge in using the energy budget to validate closure is that a good measurement of latent heat flux does not necessarily mean a good measurement of the trace gas, because transfer for water and for the gas of interest may differ, especially if gases are reactive (such as volatile organic compounds) or have significantly different sources and sinks as compared to water vapor.
Another challenge in using the energy budget is often related to the difficulty in measuring soil heat flux, especially in soils with relatively rapid changes in water content, and also in non-uniform and patchy soils or terrains. In spite of these difficulties, and with proper precautions, surface energy budget remains one of the most convincing ways to assess the quality of eddy covariance results, and is widely used in the flux community.
Important: A good (closed) energy budget will not necessarily indicate good measurements of the trace gas flux, while a “non-closing” energy budget will almost certainly indicate a problem when measuring the flux.
Another caveat in energy budget validation of eddy covariance fluxes is that minor components may be missed in the short energy budget, even if all four key components were measured properly.
Computing the energy balance
To use the energy balance tool:
- Under Dashboards > Energy Balance, select variables from your data to be used for H, LE, Rn, and G.
- Constrain the date range, if desired.
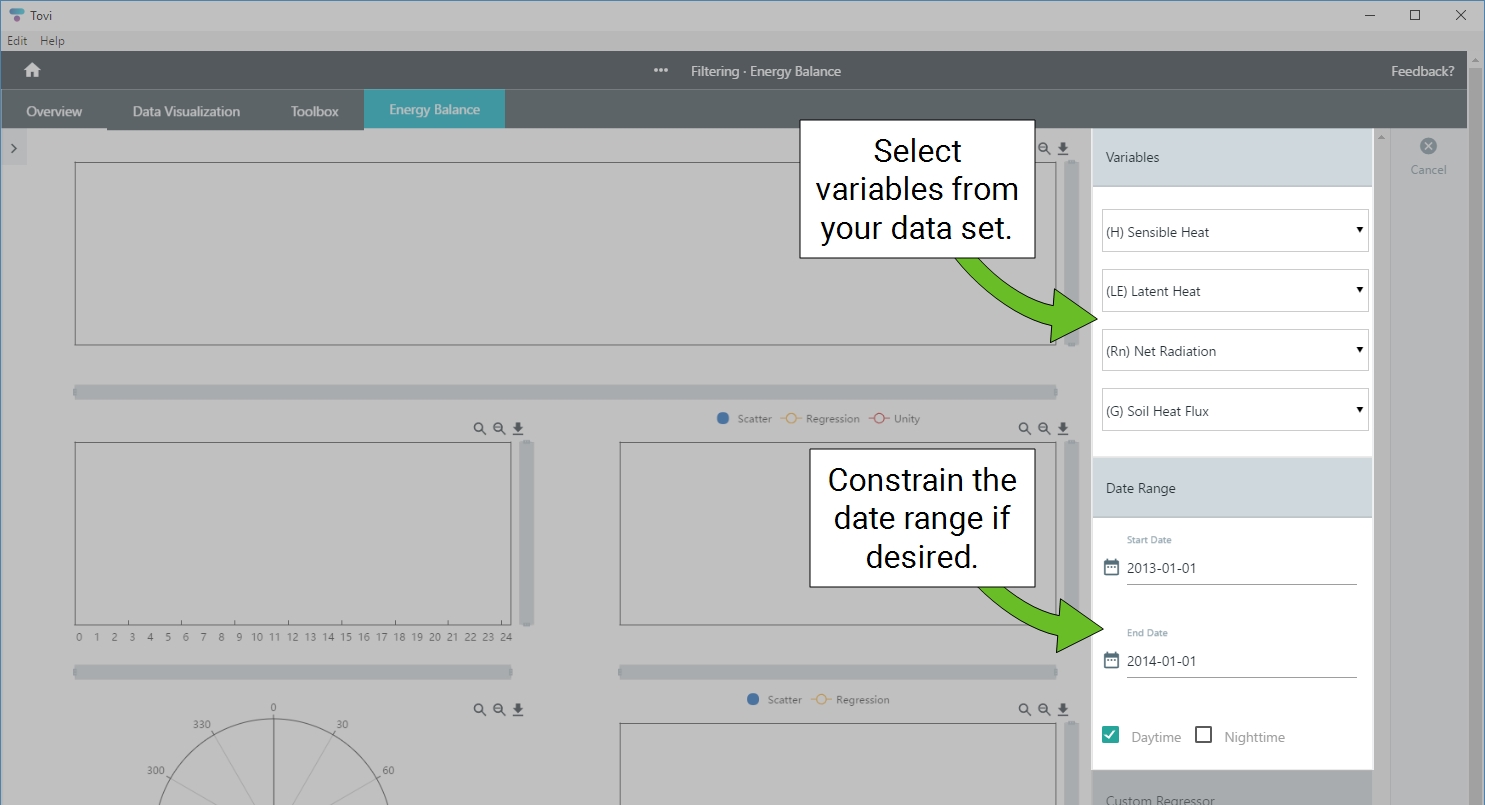
- After selecting a data source for all four variables, Tovi will compute and display the energy balance.
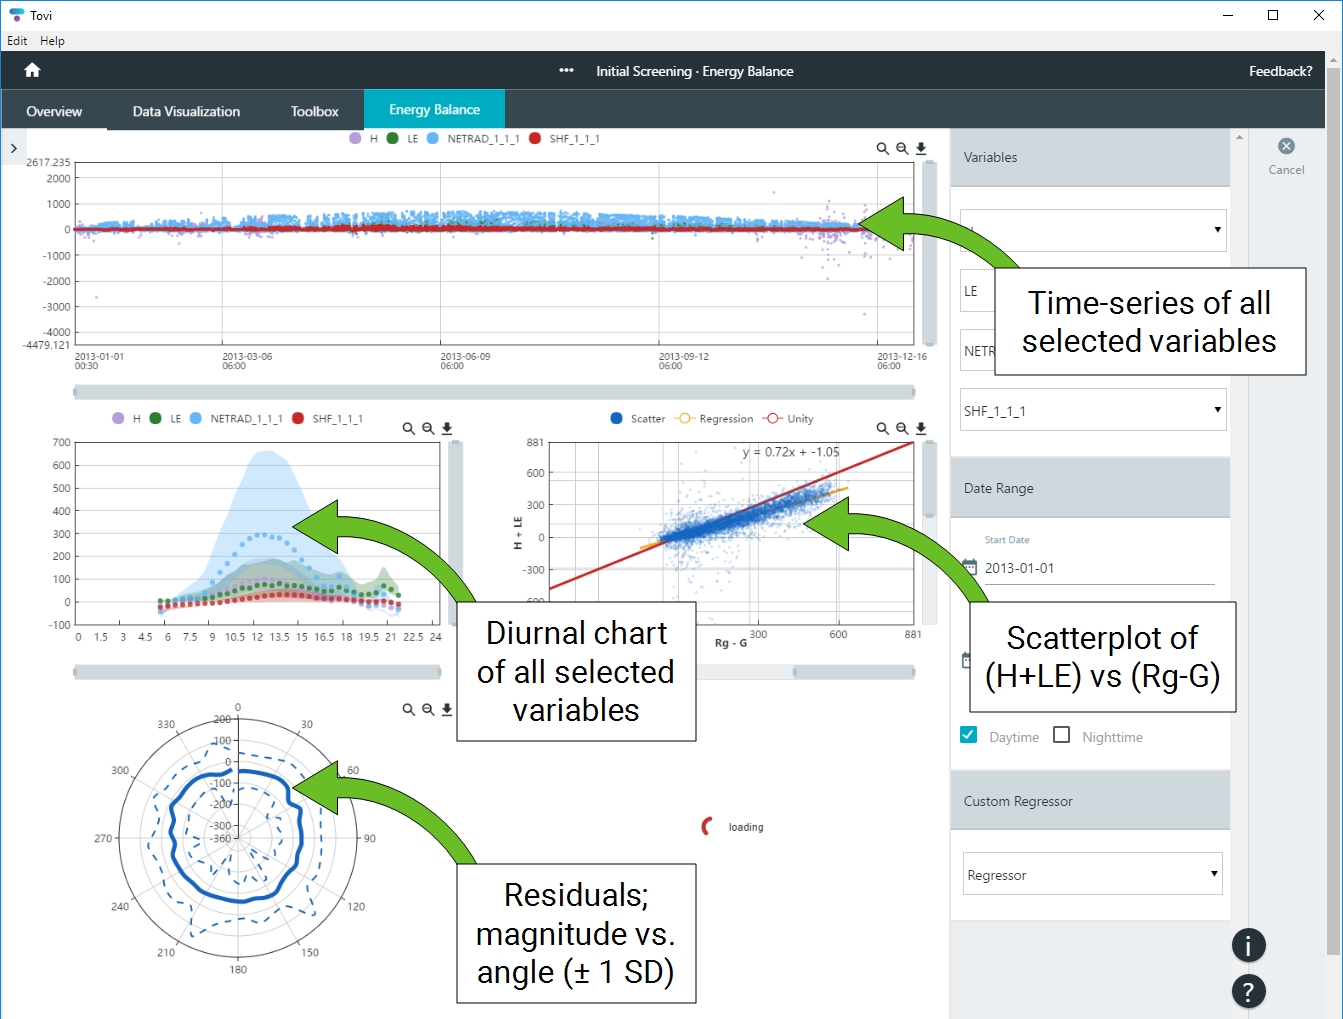
- For the selected variables, Tovi will show the full time series, ensemble averages (diurnal courses), a regression of H + LE against Rg - G and a polar of residuals plotted against wind direction (the outer dashed circle is +1 standard deviation, the inner dashed circle is -1 standard deviation). You can zoom in to the graphs to see the details.
- Select a Custom Regressor to explore whether there is a dependency between the residuals of the energy balance (i.e., its "lack of closure") and any available variable.
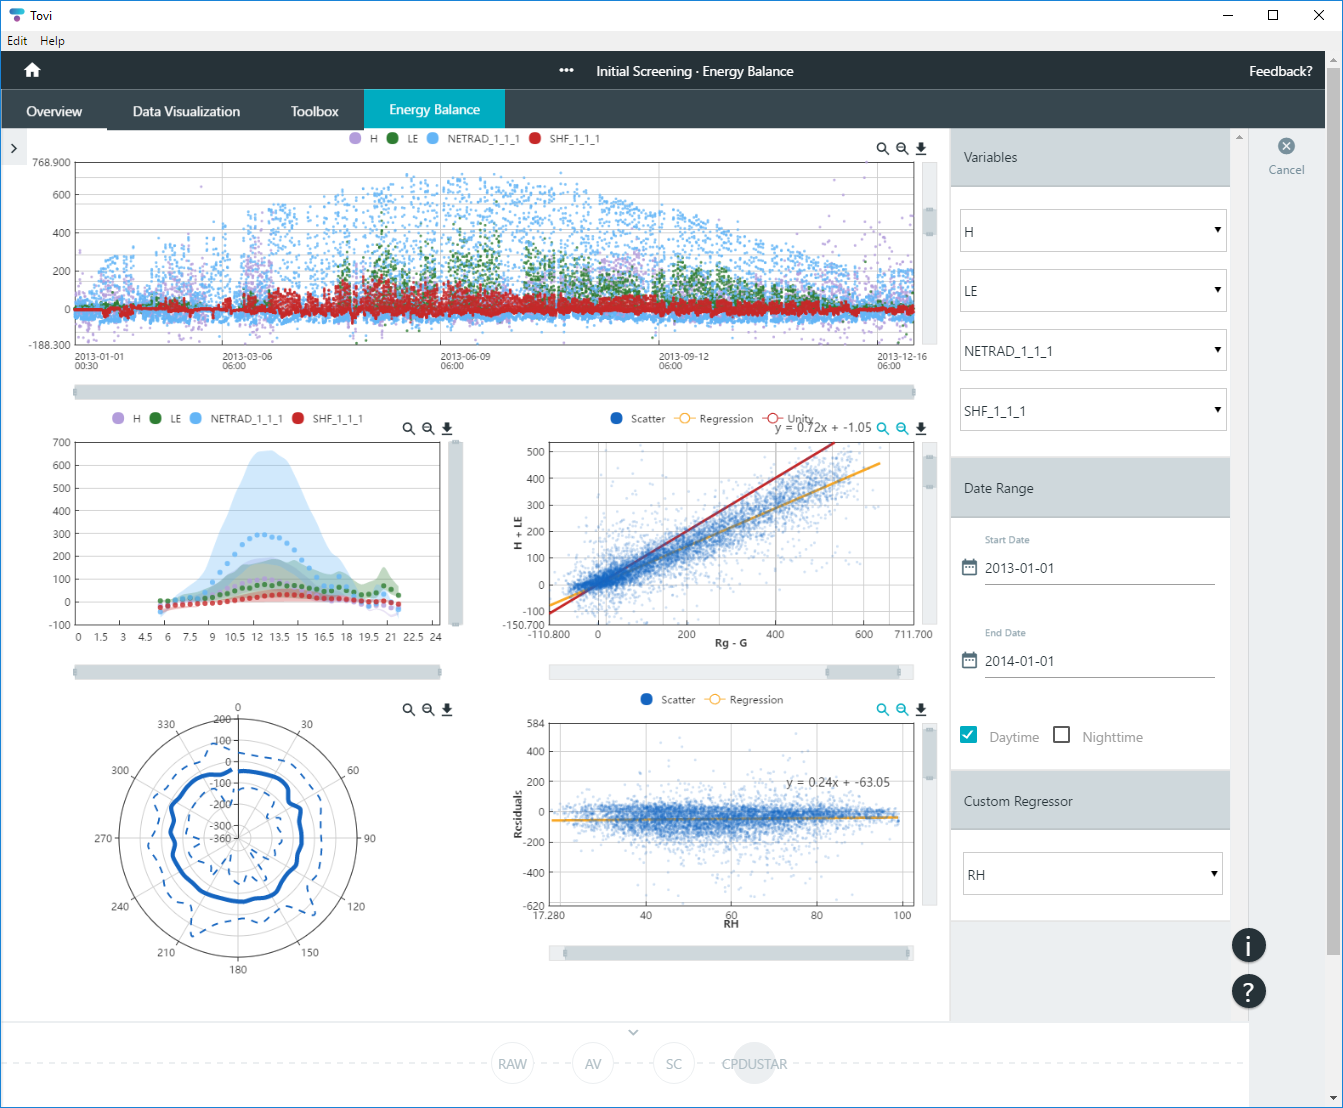
You can examine the graphs—zoom and scroll to explore the details of the energy balance.
Carbon cycle overview

The carbon cycle dashboard helps visualize the accumulation of carbon in the ecosystem. The carbon cycle can be viewed at any time after data are loaded. However ecosystem respiration (RECO) and gross primary productivity (GPP) are computed by the night time partition tool, so the tool is more informative when used at the end of your analysis in Tovi.
In terms of workflow, the carbon cycle tool is most informative when the dataset has been fully processed. The Workflow View presents carbon cycle as the final step.
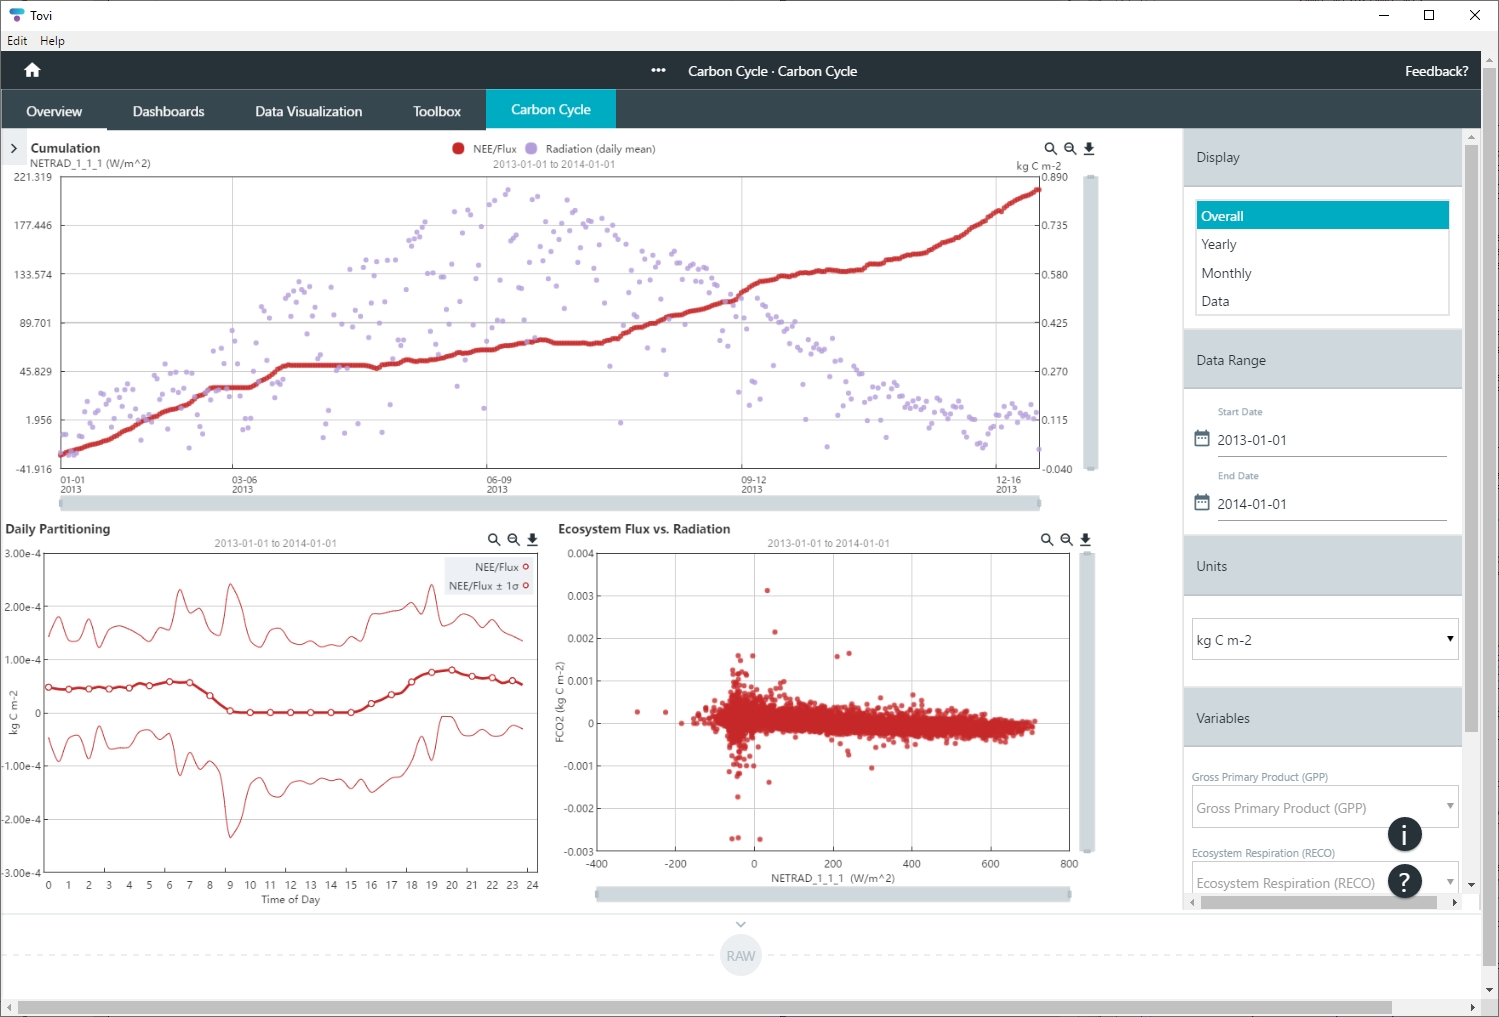
On the left, Tovi displays graphs. The primary graph shows variables that are selected on the right. This graph will display carbon accumulation and light. Below that, Tovi gives the daily partitioning ensemble average (median and ±1σ) and ecosystem flux vs. radiation. To the right, you can set the view options including switching to yearly and monthly plots and a tabular view of the data.
Display
The display option presents options for the figures on the left. Select Overall to view the total for your entire data set. Select Yearly to parse the data by year and show accumulation by year. Select Monthly to parse the data by month and show accumulation for each month, and Data to see the data values being plotted.
Data Range
Select a date range to consider in the view. Only data within this range will be displayed.
Units
Select your preferred units to display the carbon accumulation. The options are:
- Mass: g (grams) or kg (kilograms)
- Molecule: C (carbon) or CO2 (carbon dioxide)
- Area: m2
Variables
Gross Primary Productivity (GPP) and Ecosystem Respiration (RECO) are always selected. Depending on what is available in your data set, you may be able to select a variable fro ecosystem flux (NEE/Flux) and Radiation (daily means).
When you are done viewing data, you can select any other tool to proceed with analysis.