Tovi® Software is a suite of tools for analyzing eddy covariance flux and meteorological datasets that have been processed with EddyPro Software, either on a desktop computer or on the SmartFlux System. Tovi is designed to bring together analysis tools, developed by or with the scientific community, into a unique, interactive and intuitive environment, to facilitate and streamline typical processes such as quality control, flux gap filling and flux partitioning, as well as to enable novel analysis such as footprint-based flux allocation.
Workflows
Typically you'll work through Tovi in a linear progression, creating a new Site, adding data files to the library, adding those files to a Timeline, and then beginning the Analysis. You can have multiple sites in Tovi, one library for each site (with lots of data files in the library), multiple timelines for each library, and multiple analyses for each timeline.
After creating a site, (adding data files, creating at least one timeline, and an analysis), you can proceed with quality control (QC) screening, meteorological gap filling, computing storage corrections, averaging duplicate variables, u* threshold detection, and filtering.
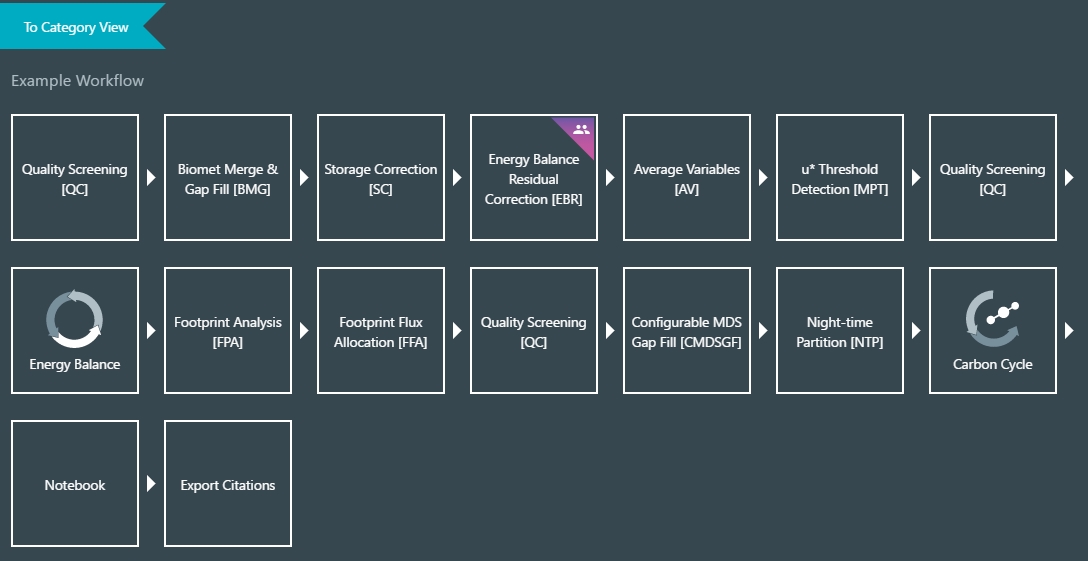
Following these initial steps, you can complete any or all of the subsequent data analysis steps, including, computing gross primary productivity, footprint analysis, energy budget, flux partitioning, and more.
Tips and tricks
As you work through Tovi, you'll encounter visual tools that serve to facilitate the evaluation and processing of data. These are described below.
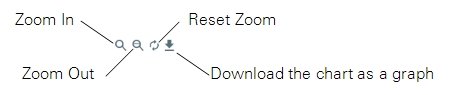
Charting Tools: Most charts support zooming in and out. You can save any chart as an image to your computer. In some cases, you can view the numerical data that are displayed on the chart.
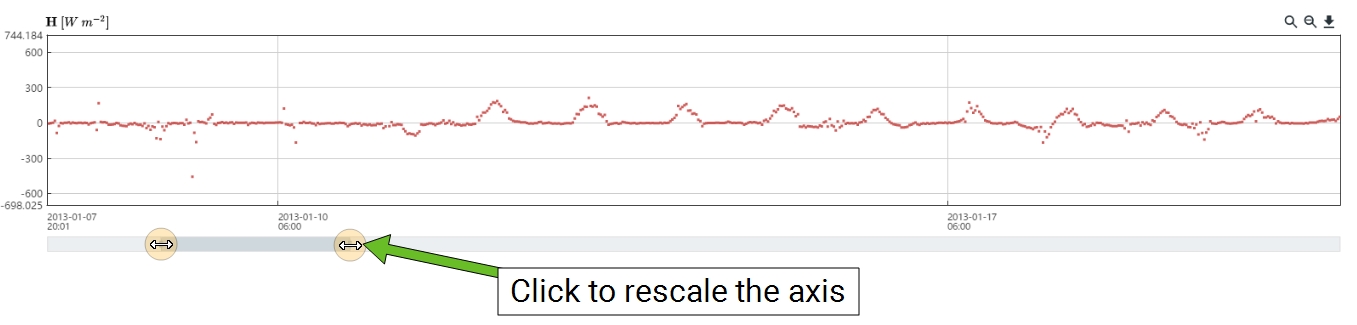
Zoom and Scroll: Many charts can be zoomed with the scroll bars on both the horizontal and vertical axes. Click the end of a scroll bar to zoom in or out. After zooming in, you can scroll the view.
Hide and Show: In some charts and timelines, you can hide or show a variable by clicking the colored dot.

The science behind Tovi
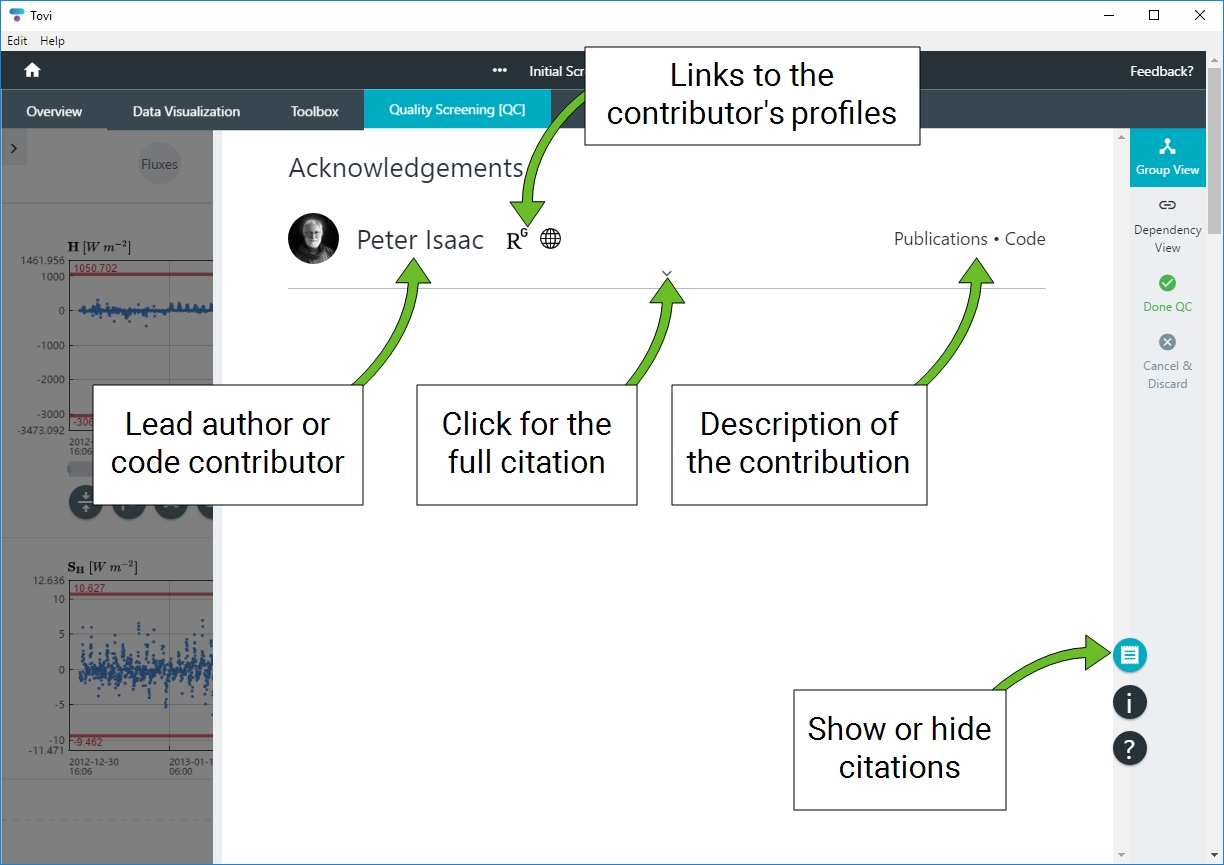
While using the tools in Tovi, you can readily see the acknowledgments for the tool. Contributing researchers and code developers are credited directly in the app, and if you'd like to read the original research or find citations, you can do so while using Tovi. To access the Acknowledgments page, you need to open a tool from the Toolbox. Then click the Acknowledgments button ( ). Citations and code contributors will be given for the selected tool.
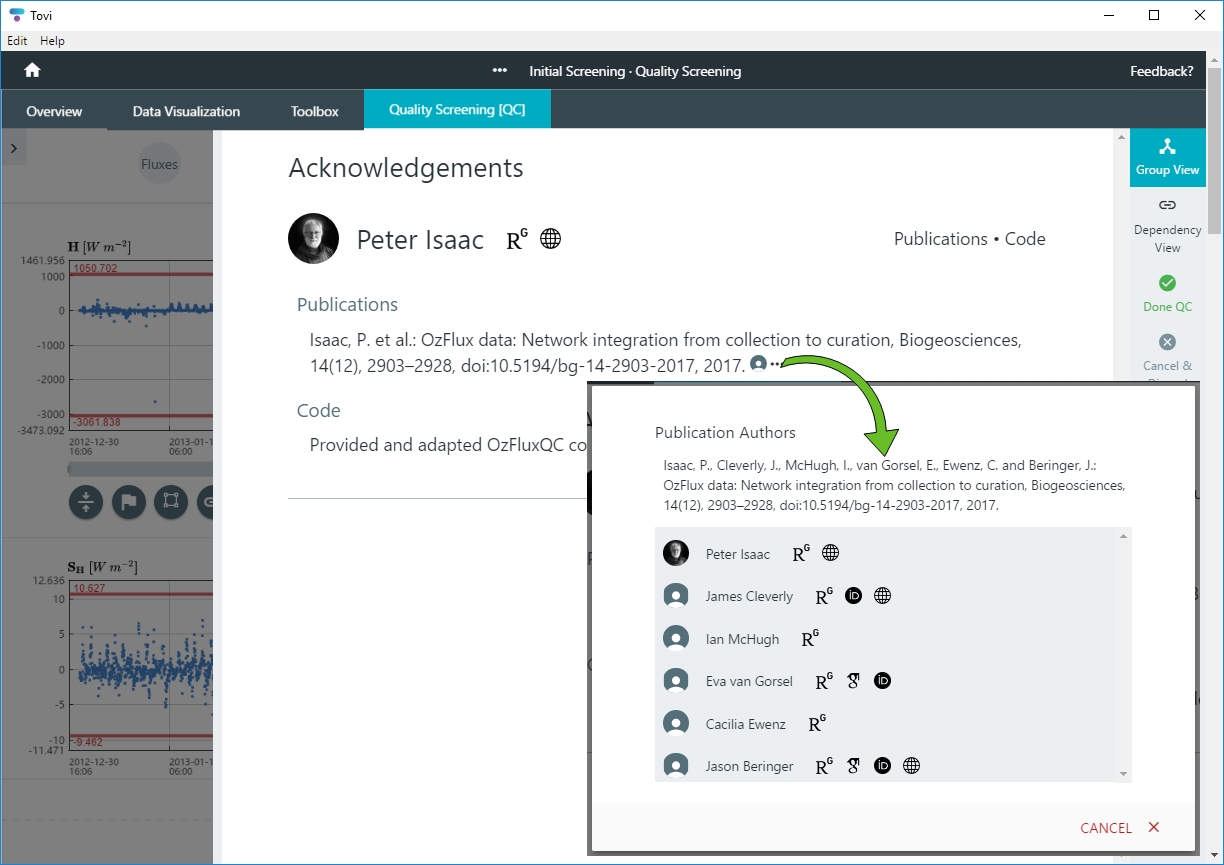
When you are done processing your data, you can request a list of citations for all of the steps that were applied, and Tovi will generate a citations list in your preferred format.
For each individual listed in the Acknowledgments section, you can view profiles on ResearchGate, ORCID (Open Researcher and Contributor ID), Google Scholar, or the individual's institutional affiliation.
You may see the following icons:
 Opens the contributor's ResearchGate profile.
 Opens the contributor's Google Scholar profile.
 Opens the contributor's ORCID profile.
 Opens the contributor's employer or professional institutional affiliation.
The interface
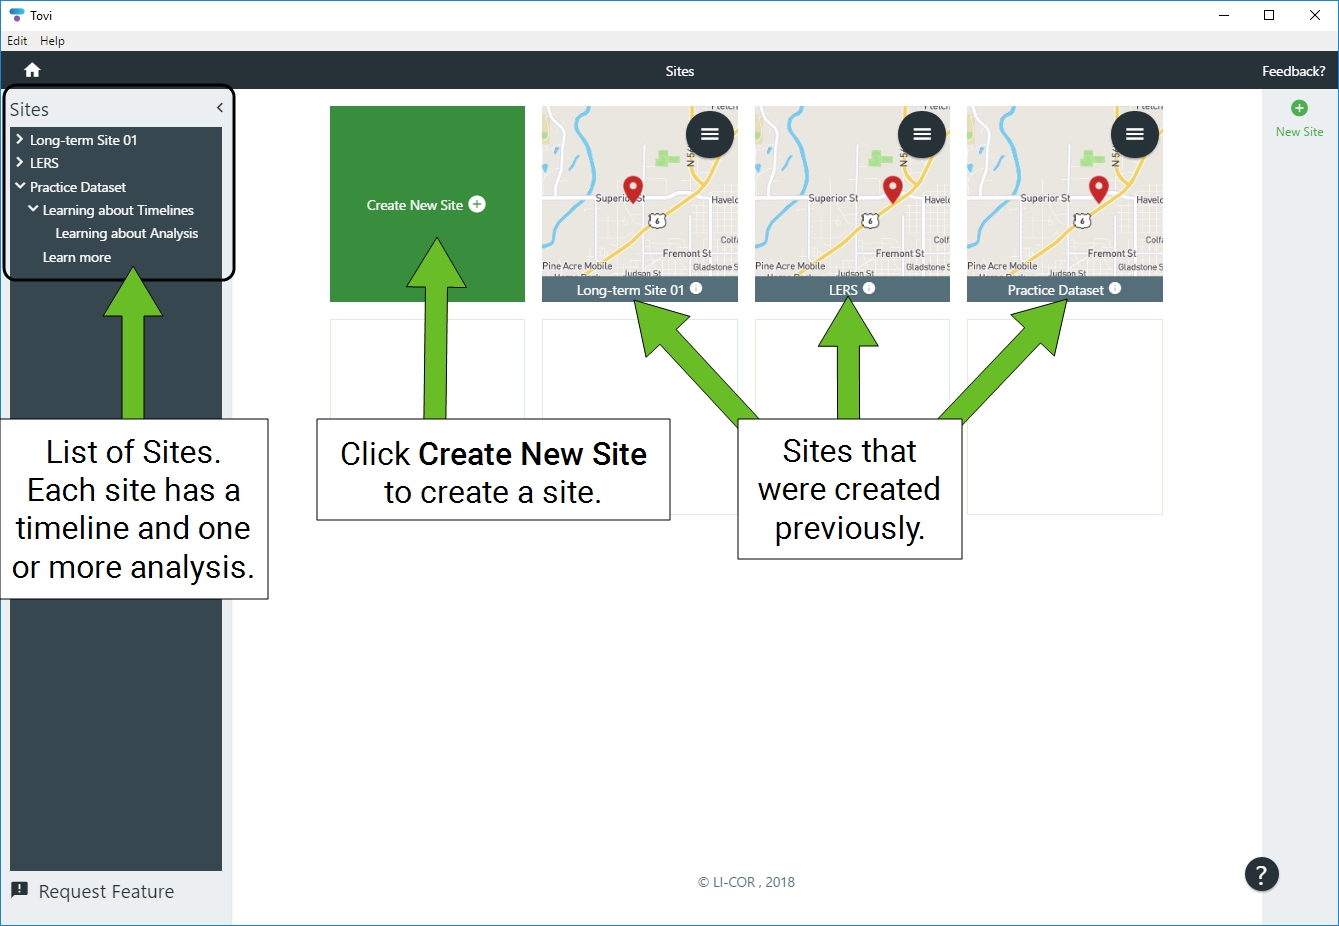
Here we review the organization of the software—some things we've already covered, and others that might be useful to know as you use Tovi. Tovi organizes all of the sites, timelines, and analyses on the left panel, where you can view each Site and its analyses in a hierarchical form (see Figure 1‑1). The main area shows sites that were created previously, and the right panel will display project properties and options that you can change in the course of the analysis.
Home page
The home page is where you start new site or open a project for an existing site. As you work through a site, you can always go back to an earlier part of the project, add more data files to the library, create new analyses, modify existing analyses, and so on.
Overview page
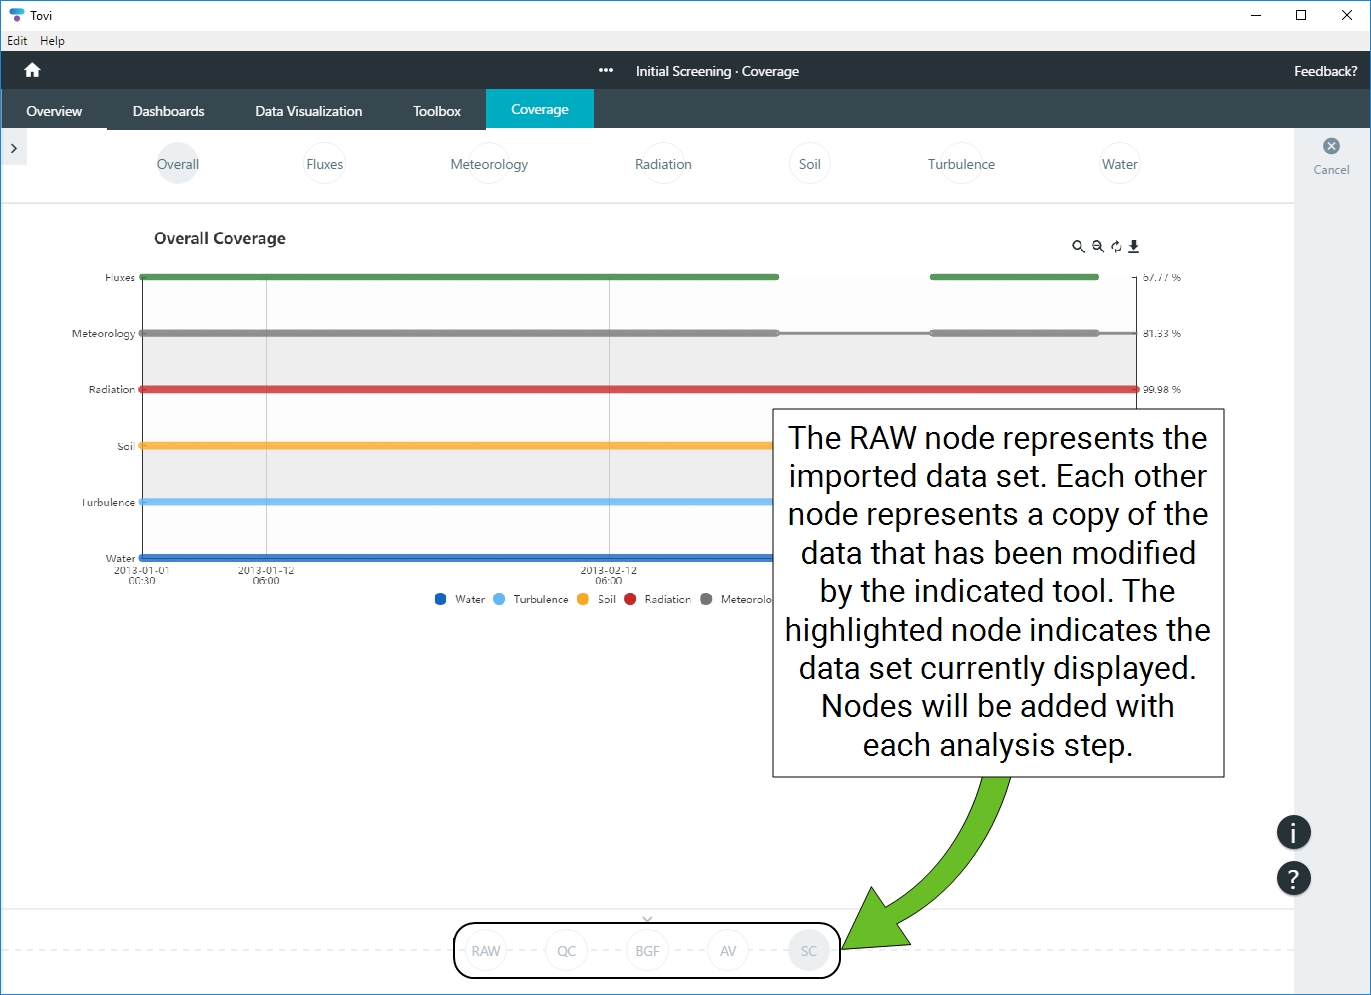
After you've started analyzing the datasets, you'll see the sequence of steps that have been taken, represented by nodes in the top of the Overview page. When you create a new site, only one node is present (called RAW), but a node will be added with each processing step. Each node represents a copy of your data set that has been modified according to the settings in that step.
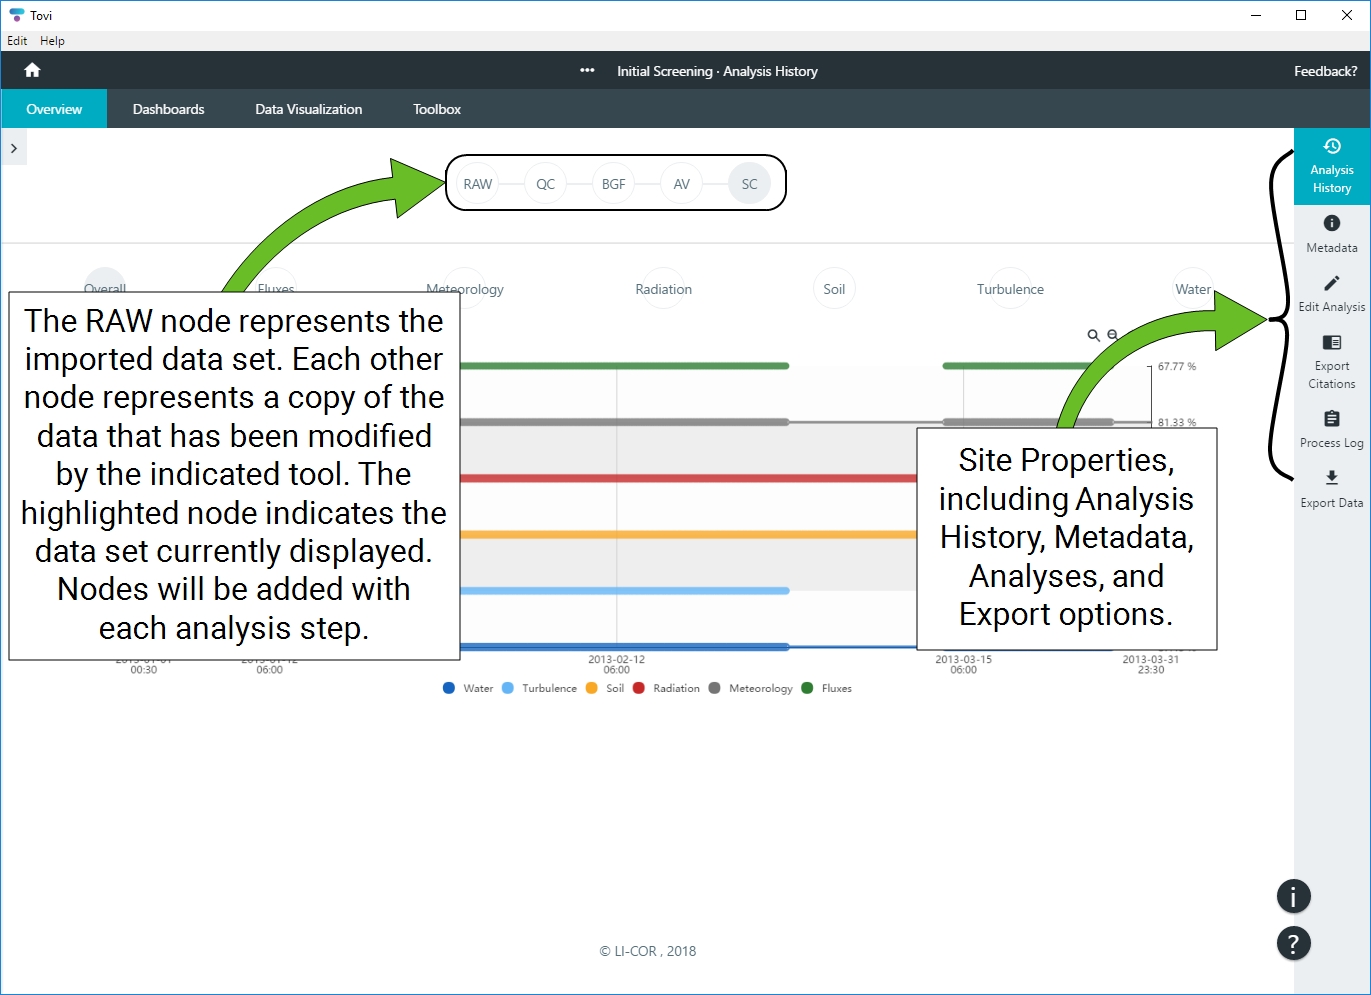
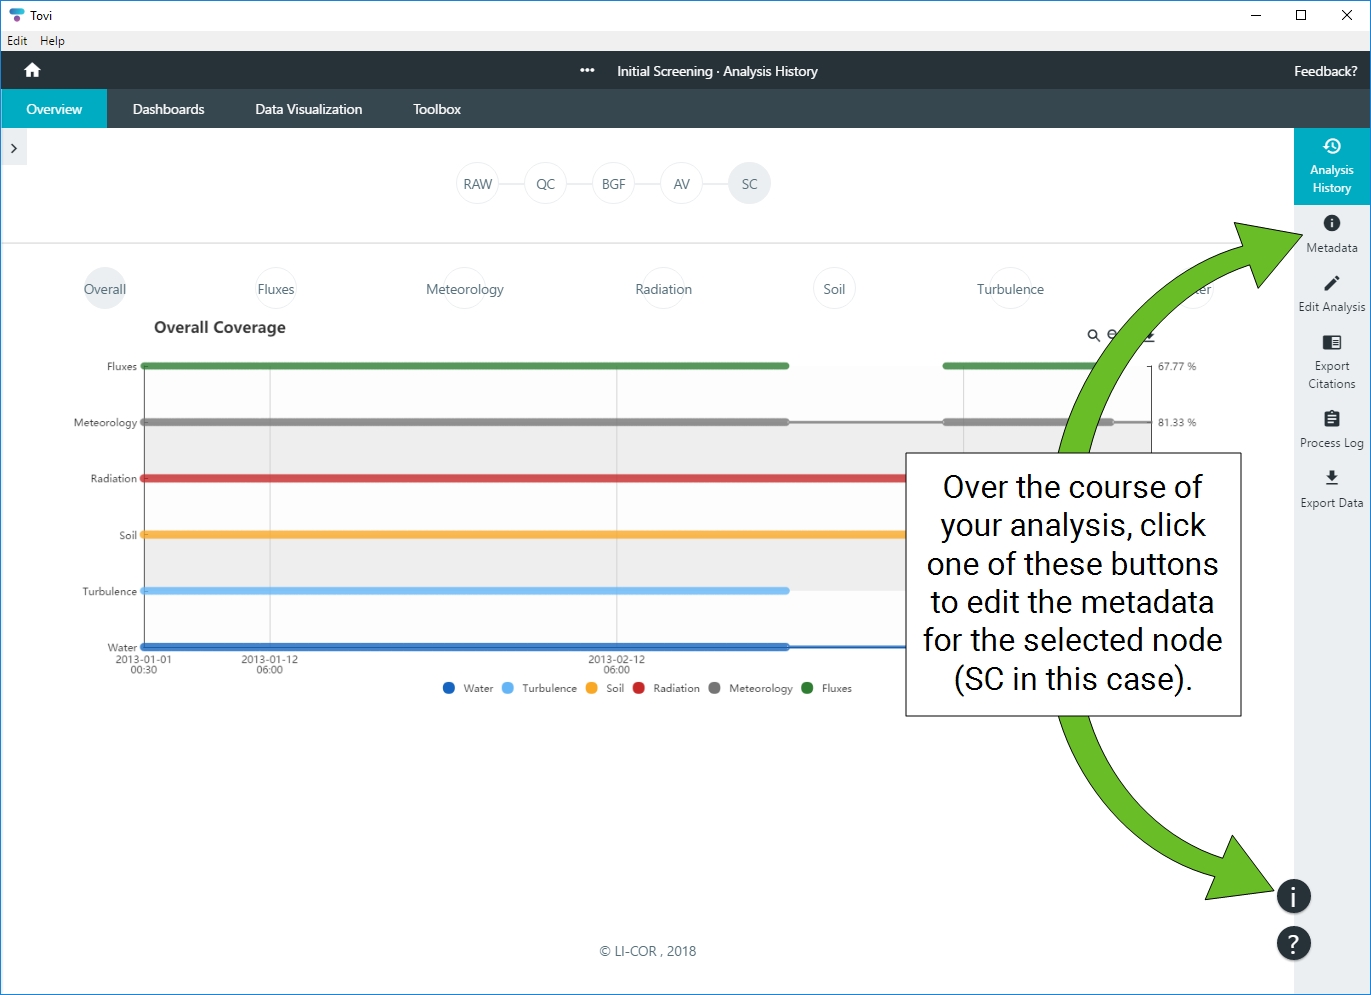
Site Information page
When you create a new site, the site information will be loaded automatically when you select a metadata file or it can be entered and edited manually. You can view the metadata an any time over the course of the analysis. And, you can alter the metadata for each node of the analysis (except for the location and time step information). The location and time step are set when you start a project, and they can't be changed after they are locked. There are several ways to edit the metadata (except the location and time step), at least one of which will be available to you no matter where you are in Tovi.
Dashboards, Data Visualization and Toolbox pages
When you select the Overview, Dashboards, Data Visualization or Toolbox tabs, you can select a tool, and after doing so, the bottom of the screen shows nodes that indicate the status of your data processing. The highlighted node indicates which data are currently displayed. Each node represents a copy of the data that has been modified in some way, except for the node labeled RAW. That is the original data set.