Mobile measurements of fugitive gas emissions with LI-COR gas analyzers
Authors: LI-COR, Inc.
Correspondence: envsupport@licor.com
Instruments: LI-7810, LI-7815, LI-7820
Keywords: fugitive gas emissions, mapping, portable measurements
Abstract
For researchers wanting to collect and visualize gas concentration data associated with either multiple fixed locations, or while walking or driving, there are several analyzer options available, as well as associated tools to process and visualize resulting data. With regards to the choice of methane analyzer, the LI-7810 CH4/CO2/H2O Trace Gas Analyzer is particularly well-suited to such applications. Although written to describe methane measurements with the LI-7810, the same techniques apply to CO2 measurements with the LI-7815 and N2O measurements with the LI-7820 Trace Gas Analyzers.
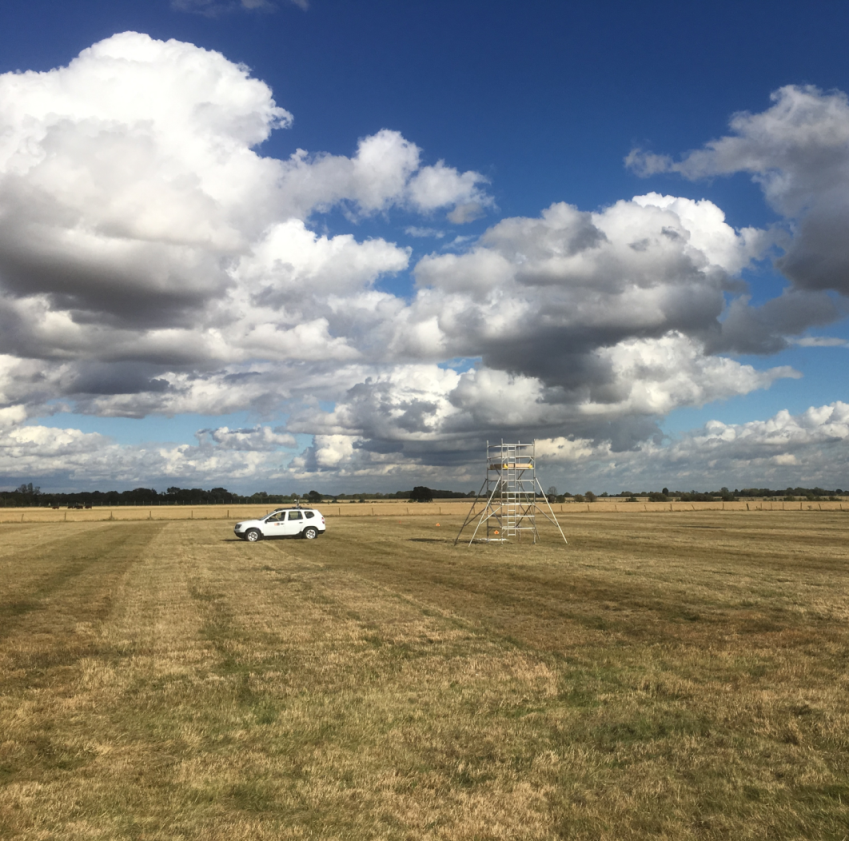
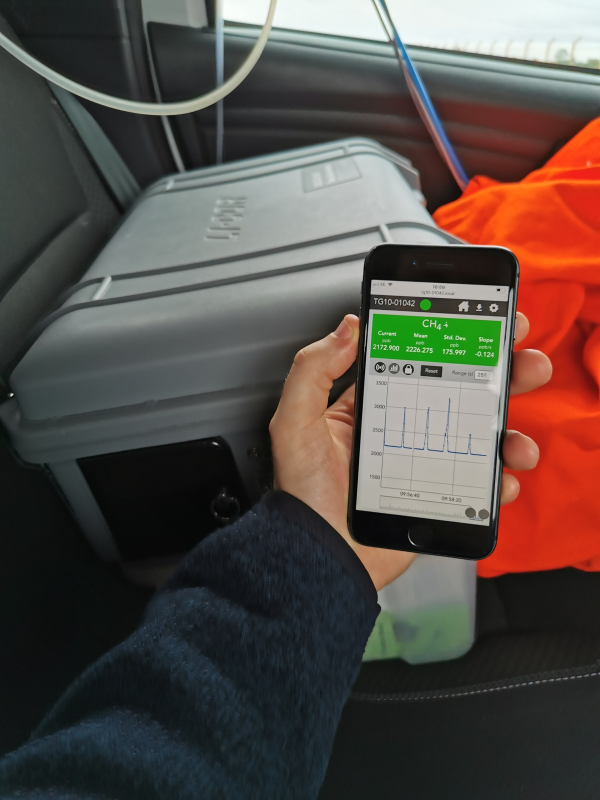
With sub-ppb precision in less than one second, the Trace Gas Analyzers can record very small changes in methane concentration above background levels, making the detection of methane emissions at very low levels a possibility. Importantly, because of its extremely low-volume optical cavity design, with a volume of just 6.41 cm3, the analyzer delivers response time (T10-90%) of <2 seconds. This is significant when moving at higher velocities when in a vehicle, or where you may be crossing narrow emissions plumes, resulting in transient increases in methane concentration.
To achieve the desired result, as shown in Figure 2, time synchronized concentration and Global Positioning System (GPS) data are required. Once methane concentration data and GPS data have been collected, you can visualize the data with a suitable mapping tool. Google Earth Pro provides an accessible and free to use platform for such an application. The LI-7810 is not fitted with an internal GPS. You can use an independent GPS device with the LI-7810 that meets the measurement frequency and precision needed for your research, with data from both devices synchronized in post-processing. The following describes two different case studies where an external GPS was used to collect position data, then synchronized with data from an LI-7810.
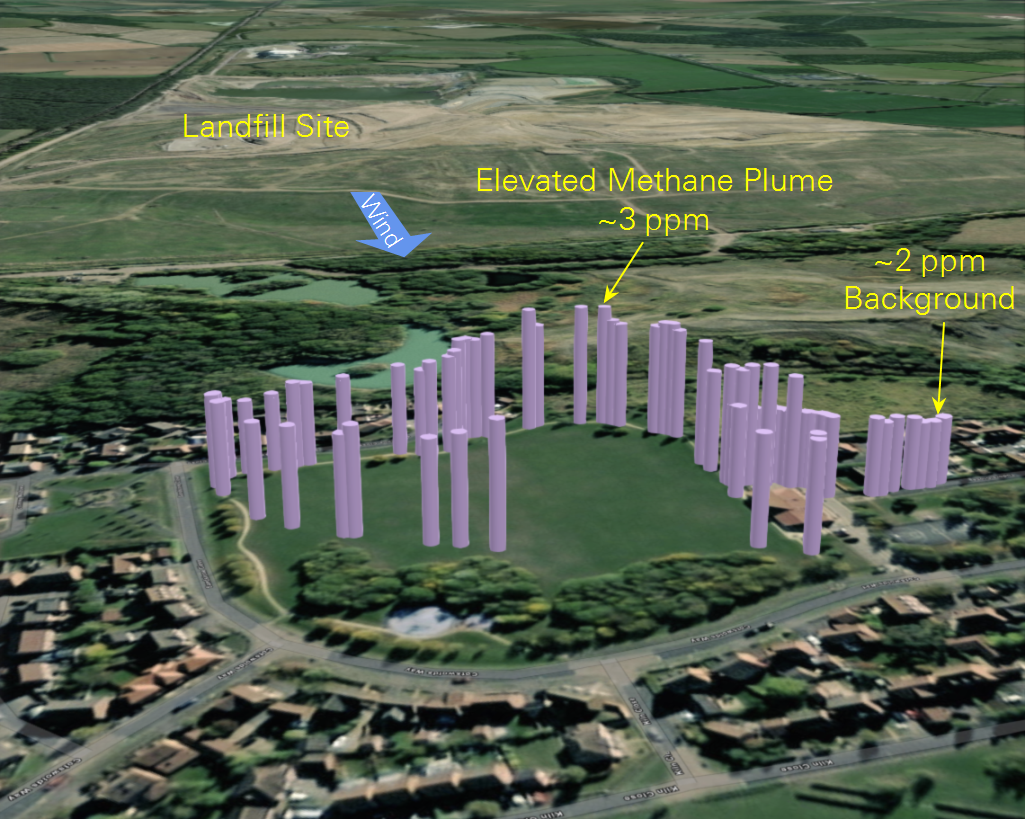
Here we describe the essential, basic hardware and software required to achieve a result such as that presented in Figure 2, along with step-by-step instructions for applying these options to deliver the desired result.
1 | Required equipment and software
We used the following hardware and software tools to measure and record methane concentration data and GPS data, synchronize these data sets, convert the data sets to the Keyhole Markup Language (KML) file format, and finally visualize the resulting data set using Google Earth Pro:
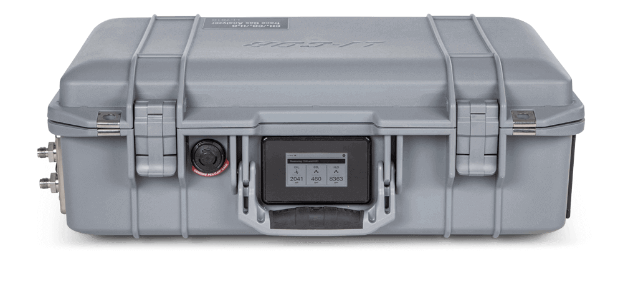
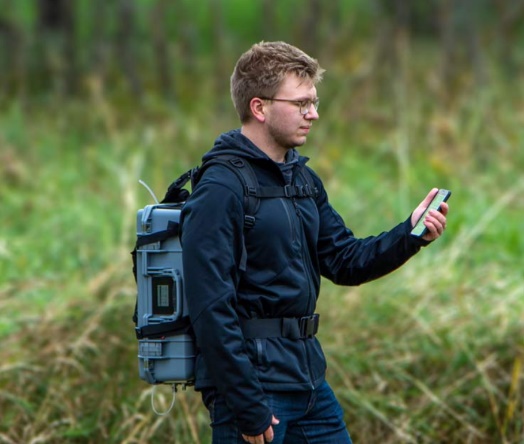
- LI-7810 Trace Gas Analyzer, with optional backpack harness for walk-around surveys.
- Global Positioning System
- We tested two options for GPS:
-
- Garmin eTrex 10 handheld GPS - https://buy.garmin.com/en-US/US/p/87768
- Trails GPS app for iPhone, available in the Apple App Store - https://apps.apple.com/gb/app/trails-outdoor-gps-logbook/id913277014
- Microsoft Excel
- GEGraph - http://www.sgrillo.net/googleearth/gegraph.htm
- Google Earth Pro - https://www.google.co.uk/earth/download/gep/agree.html
2 | Methods
The following describes the complete process of visualizing concentration and GPS data in two different case studies. The first is with the Garmin eTrex 10 handheld GPS. The second case study demonstrates how to run the iPhone Trails app and download data in GPX format. The data can then be processed in a similar fashion to that detailed for the Garmin eTrex 10.
During testing, we found that in a non-urban environment, the Garmin eTrex 10 delivers reliable data at 1 Hz without dropouts. The Trails app provided good accuracy in terms of location, and at times data were delivered at a steady 1 Hz rate, but data dropout was frequent, even at walking pace.
Before following this method, please familiarize yourself with manuals for the LI-7810 and Garmin eTrex 10 and use of the products themselves. The step-by-step instructions that follow will be significantly clearer as a result.
2.1 | Case Study 1: Methane Concentration and GPS Data Visualization Using the LI-7810 and Garmin eTrex 10
- Initial Set-up of GPS and LI-7810
Unless otherwise stated, navigation is affected using the joystick on the front panel as shown in Figure 3, with commands entered by clicking this joystick.
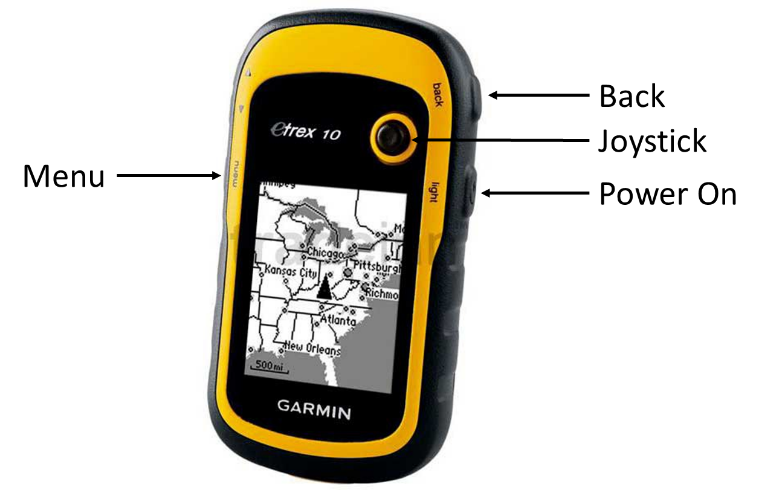
Figure 3. Garmin eTrex 10 handheld GPS. Firstly, set up the unit to record data at a fixed time interval of one second: Setup > Tracks > Record Method – Time > Set Recording Interval to 00:00:01.
To view time on the Map screen of the Garmin GPS, follow the following steps: Setup > Map > Data Fields > 1 large > Back (side button) > Back (side button) > Map > Menu (side button) > Change Data Fields > Select > Time of Day
Prior to starting either a walking or driving survey, it is important to manually synchronize the time set on the LI-7810 with that on the Garmin device. It is not possible to automate this process or manually adjust the time on the Garmin GPS since time is acquired via the satellite connection. Time on the LI-7810 can be manually set via the Network Control panel.
- Record and Export GPS Data
Initiate recording of a walk or drive as follows: Map > Hold down stick > Select Map > Select Go
To complete and save recording of a walk or drive, follow these steps:
Push back side button to leave Map > Track Manager > Current Track > Save Track > Name and save file > Delete current track to clear data (important as this file includes data from all tracks recorded unless cleared). When saved, the file will be exported in GPX format.
3 | Merging methane concentration data and GPS data in Excel
After you have downloaded the LI-7810 data file and GPX file, load the GPX file in Excel, and do the following:
- Connect the Garmin GPS to a laptop via the USB cable supplied with the unit.
- Open Microsoft Excel and load the GPS data file.
- Click File > Open > Browse to Garmin eTrex 10 > Garmin > GPX > Select file in default folder and Open.
- Ignore file format warning. Select Yes.
- Select OK to open As an XML Table.
- Ignore schema source warning. Select OK.
- You will see a Worksheet populated as in Figure 4. We are interested in columns H and I (containing latitude and longitude data) and column K (containing time data), highlighted in red.
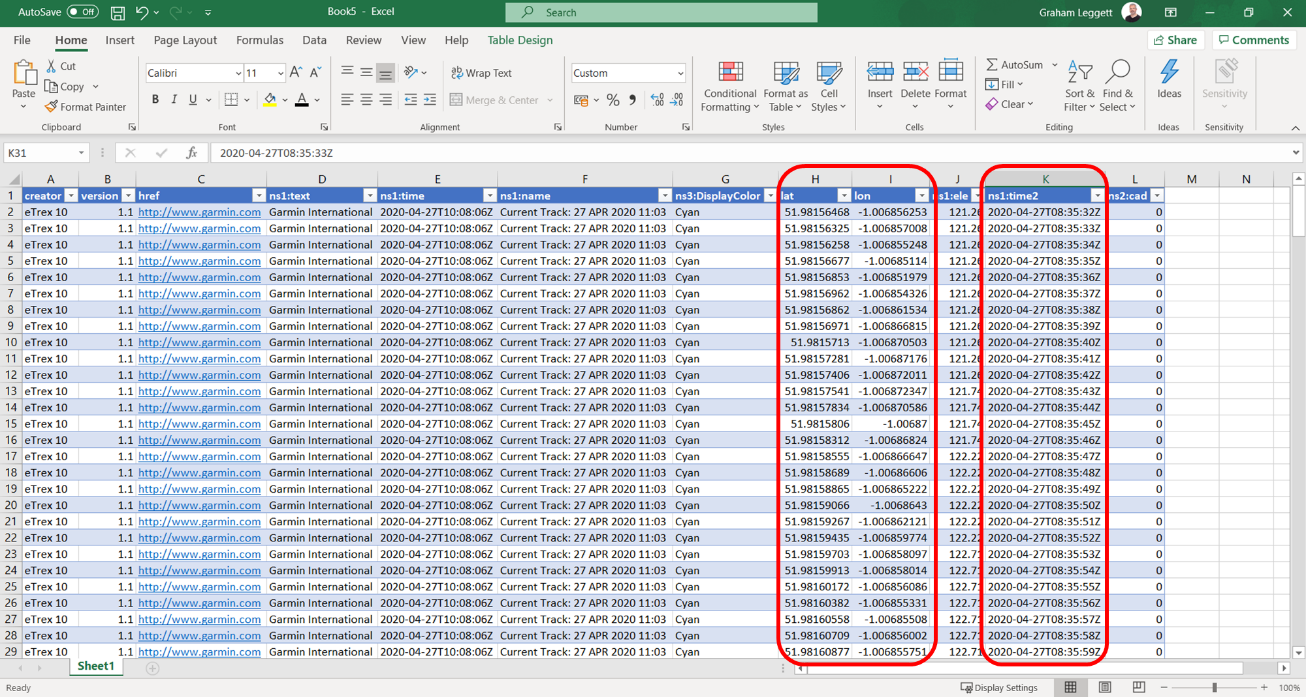
We need to combine the latitude, longitude, and time data in this file with methane concentration data collected by the LI-7810.
To import LI-7810 data into Excel, work through the following steps:
- Open Microsoft Excel and load the LI-7810 data file.
- Click File > Open > Browse to relevant folder > Select ‘All Files’ at bottom right to see data file > Open data text file.
- Use default Delimited and click Next.
- Use default Tab delimited and click Next.
- Use default General Column data format and click Finish.
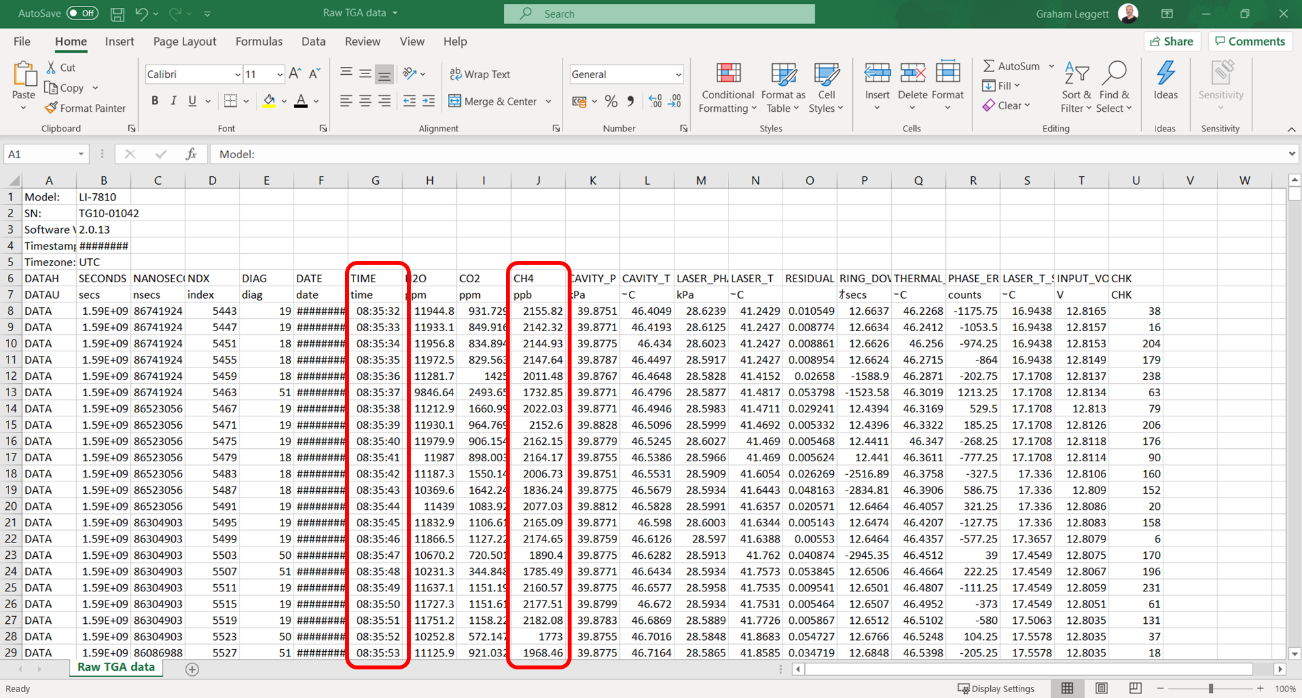
- You will see a Worksheet populated as in Figure 5. We are interested in the time data (in this case column G) and methane concentration data (in this case column J), highlighted in red.
At this point we need to bring the relevant data together in a single Worksheet, ready for export to GEGraph as follows:
- Open a new Workbook in Microsoft Excel
- Set up four tabs:
- TGA data.
- GPS data.
- Combined data.
- Data for GEGraph.
- Copy time and concentration data from the TGA data file to the TGA data Worksheet in the new Workbook. Time in Column A, concentration in Column B.
- Copy lat, long, and ns1:time2 data from the GPS data file to the GPS data Worksheet in the new Workbook. Ensure ns1:time2 data is in Column A, lat in Column B, and long in Column C.
- Remove text in time cells in the GPS data worksheet to obtain same format as TGA data:
- Select all data in Column A (ns1:time2).
- Click Find & Select.
- Click Replace.
- In ‘Find what’ field enter the date on which the data was recorded followed by T, so YYYY-MM-DDT. Leave ‘Replace with’ field blank.
- Click ‘Replace All’.
- Repeat steps d & e, this time entering Z rather than the date+T. You will now have time, lat, and long data in columns A, B, and C.
- Next copy and paste the time data and concentration data in Columns A and B from the TGA data Worksheet to Column A and B of the Combined data Worksheet.
- Now use the VLOOKUP function to bring across the lat and long data into the Combined data worksheet. This will allow the matching of time, concentration, lat, and long data, considering any dropouts in the GPS data.
- In cell C1 enter the following =VLOOKUP(A1,'GPS data'!$A$1:$B$X,2,FALSE)
- Double click on the bottom right of cell C1 to populate lat data for all rows.
- In cell D1 enter the following =VLOOKUP(A1,'GPS data'!$A$1:$C$X,3,FALSE)
- Double click on the bottom right of cell D1 to populate long data for all rows.
- Where X is the final row in the GPS data Worksheet data set.
- Finally, to prepare the data for cut and paste into GEGraph, transpose Column B (concentration data) to Column E, leaving Column B cells empty.
- If you wish to visualize values only when they are above the background concentration, an additional step can be applied to subtract this from the concentration values. One approach is to find the minimum concentration in the data set and subtract this from all values. The minimum value can be found using ‘=MIN(number1, number2,…)’.
3.1 | Using GEGraph to visualize data in Google Earth Pro
The data can now be visualized in Google Earth Pro via GEGraph:
- Open GEGraph.
- In the example set-up shown in Figure 6, we have set the footprint of the bar chart elements (polygons) to be constant and set this to two meters; in this case with a square base, polygon sides 4. Height is set to be according to value. The fill and outline of the polygons have been set to red.
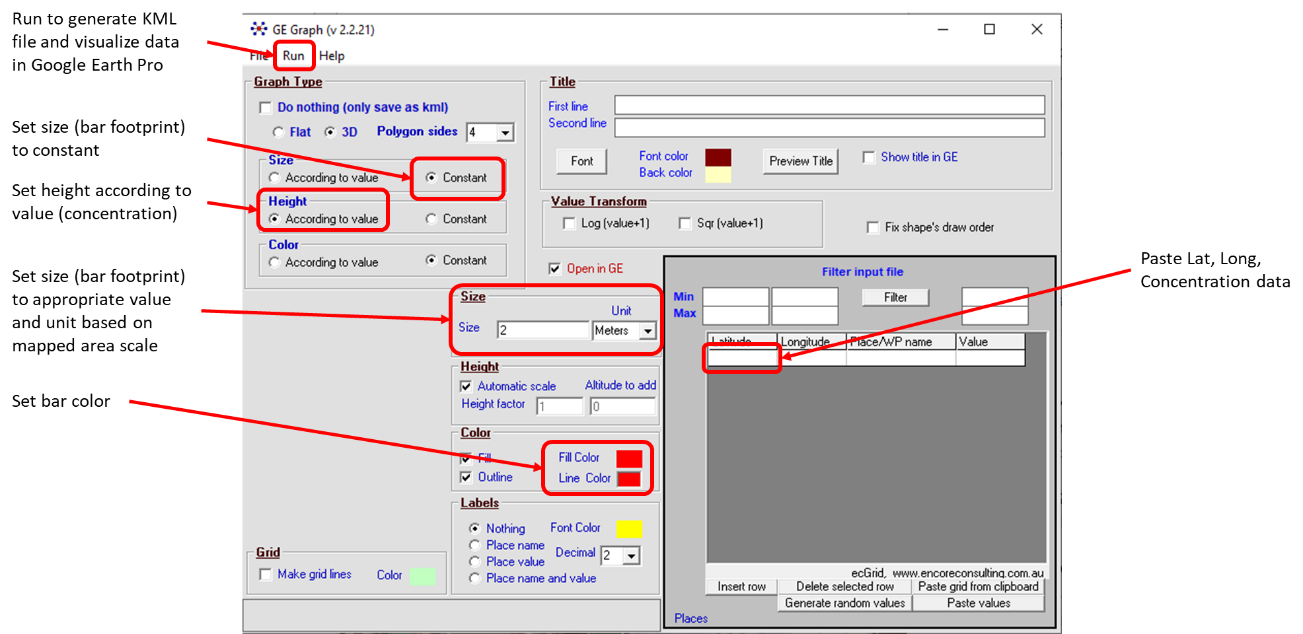
- Data can now be cut and pasted from Excel into GEGraph. Select all data in Columns B,C,D, and E in the Combined data Worksheet, omitting the first row if this includes column headings. Copy data.
- In GEGraph, click in the first cell on the first row. Click ‘Paste values’ button.
- Click Run.
- Enter a filename and click Save.
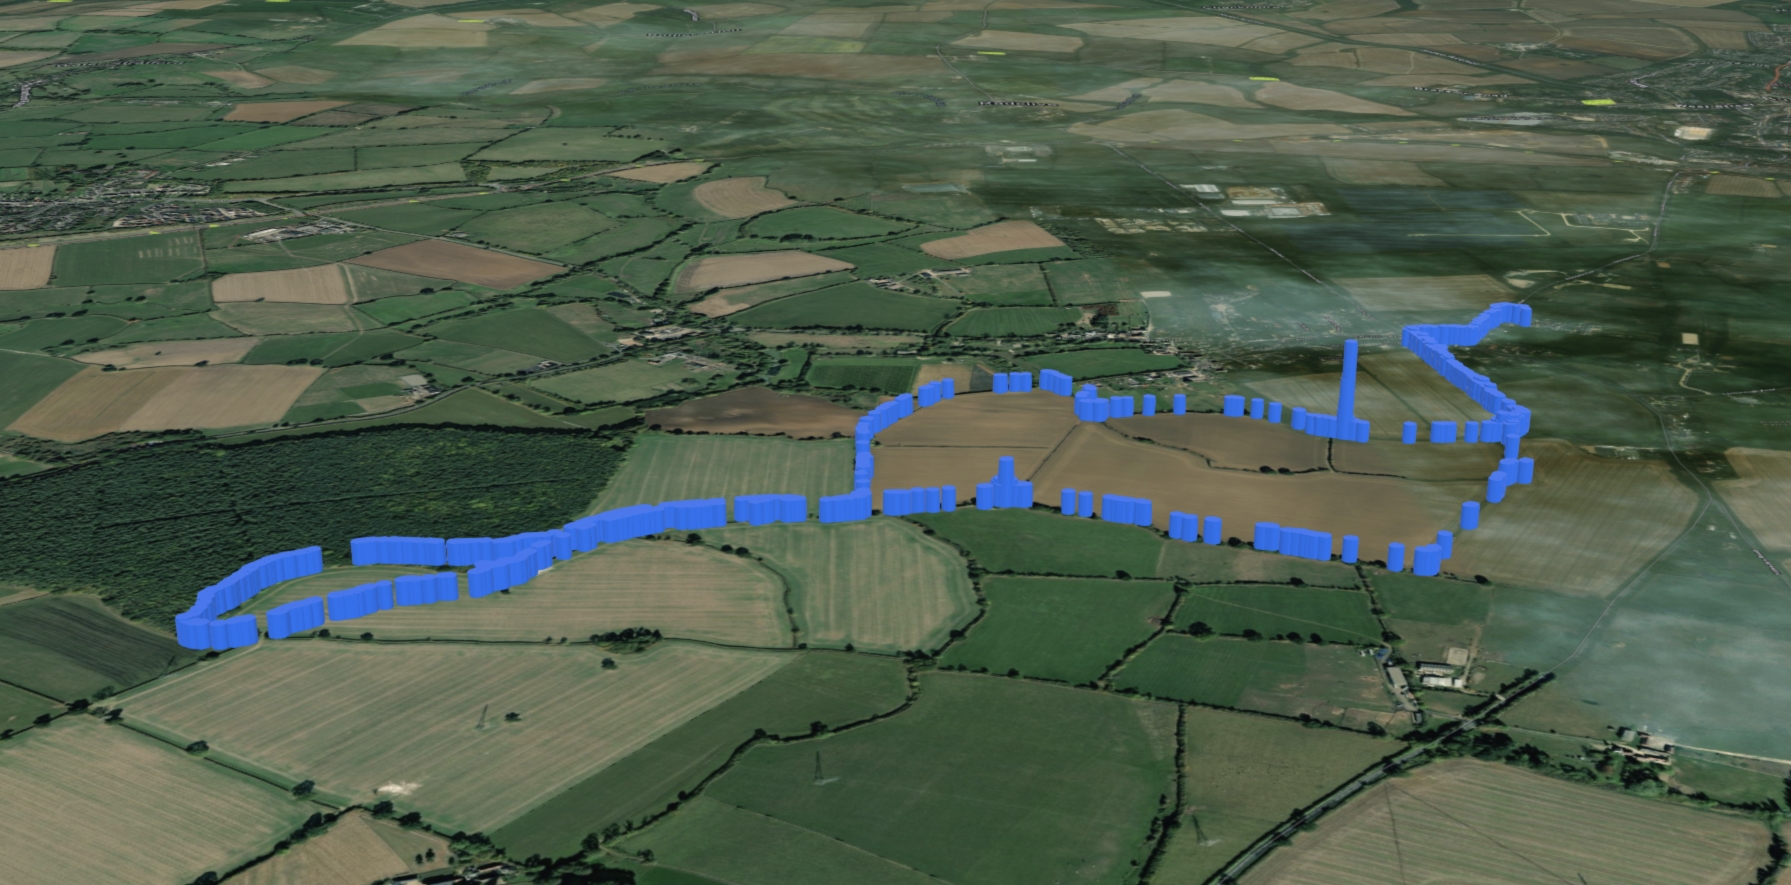
- The file will be saved and Google Earth Pro launched automatically. Data will be visualized, as shown in the example in Figure 7.
3.2 | Case Study 2: Methane Concentration and GPS Data Visualization Using the LI-7810 and Trails iPhone App
The Trails app is set to 1 Hz data recording by default. When using Trails, or an alternative GPS smart phone application, we would suggest testing the application at the frequency of the measurement you need, to ensure consistency throughout the measuring period. As with the Garmin GPS, LI-7810 and iPhone, times must be manually synchronized. Time can be adjusted on either device to match the other.
Follow the application instructions to record GPS data during your survey. After GPS is recorded on the Trails, or similar application, you can retrieve it through your personal device or via email or a messaging service. The GPX file can then be processed in a similar way to the GPX file generated by the Garmin eTrex 10.
4 | References
Monitoring Methane Emissions with a Mobile Testing Facility. See how The United Kingdom’s National Physical Laboratory and Royal Holloway, University of London assessed a mobile method for quantifying greenhouse gas emissions with the LI-7810 Trace Gas Analyzer at licor.com/products/trace-gas/case-studies/mobile-testing-facility
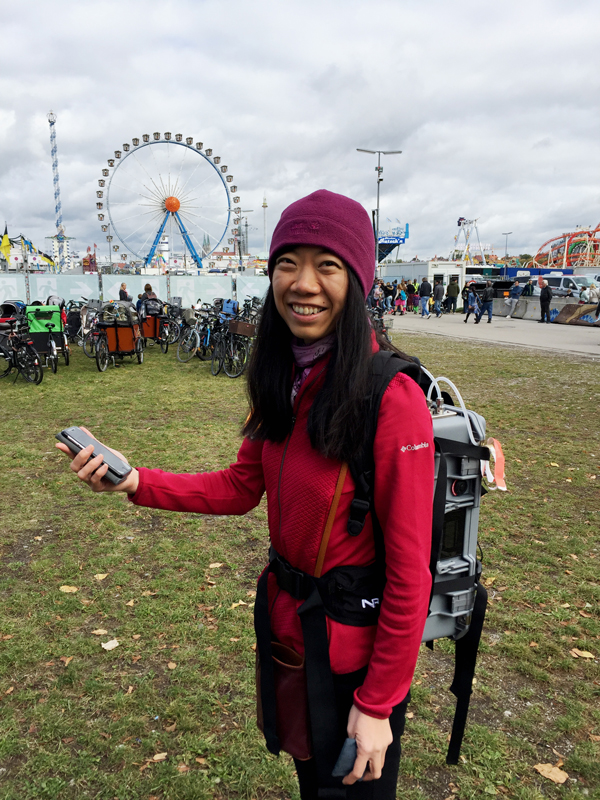
Measuring Greenhouse Gas Emissions at Oktoberfest. Learn how Prof. Chen and her team at the Technical University of Munich investigated the relationship between Oktoberfest and greenhouse gas emissions using the LI-7810 Trace Gas Analyzer at licor.com/products/trace-gas/case-studies/oktoberfest
Soil Gas Flux Studies: For soil chamber survey measurements, LI-COR’s Smart Chamber features integrated GPS, and the flux calculation software SoilFluxPro, which includes data visualization via Google Earth Pro. Further details regarding the Smart Chamber can be found here - licor.com/products/soil-flux – while information concerning SoilFluxPro is available here - licor.com/products/soil-flux/soilfluxpro.