WEBINAR
In this session, we’ll briefly dissect the data files created by EddyPro. Then we’ll describe how to create a project in Tovi using those files and data from weather stations that are near your site. Then we’ll review figures of the entire time series.
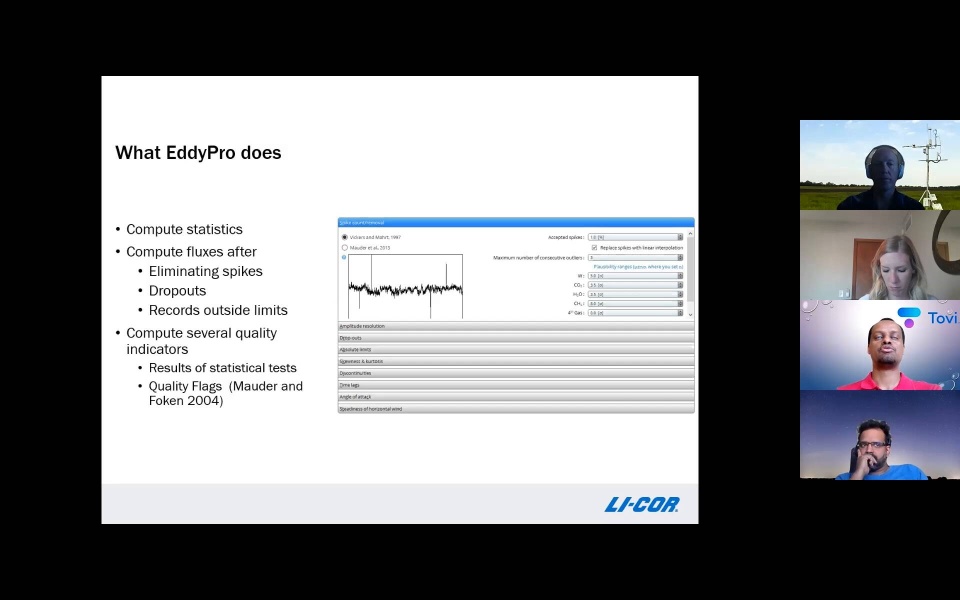
You may have heard that “quality input enables quality output”. That’s why EddyPro and Tovi include a team of tools that pair up to parse out any questionable values. We’ll explore the differences between quality indicators in EddyPro and Tovi and show you how to use quality flags from EddyPro and other parameters to screen data in Tovi. By the end, you’ll know how to perform the exact procedures on your own dataset. You’ll even learn why you should care about u* and Folken flags.
Please fill out this form to watch this webinar:
Dave Johnson
Senior Product Manager
Israel Begashaw
Senior Applications Scientist