Using the LI-7825 and Smart Chamber to determine the carbon isotope ratio (δ13C) of soil CO2 respiration
Authors: Liukang Xu
Correspondence: envsupport@licor.com
Published: 2025
Instruments: LI-7825, Smart Chamber, SoilFluxPro Software
Keywords: carbon isotope ratio, soil CO2 flux, soil respiration
Abstract
This application note provides instructions for using the LI-7825 CO2 isotope gas analyzer with the Smart Chamber (8200-01S) to determine the source carbon isotopic ratio (δ13C) of soil-respired CO2. Recently, LI-COR has added a passive water transient buffer inside the Smart Chamber (included in units with serial numbers 82S-2088 and up1). The purpose of the transient buffer is to stabilize the water vapor concentration in the air going to the LI-7825 during chamber closure to minimize the interference with the δ13C measurement and thus improve its precision. During the measurement, air flows from the chamber, through the transient buffer then to the LI-7825 and finally returns to the chamber. Below, this application note begins with an overview of Keeling plot analysis and a method developed by LI-COR to determine the δ13C of soil respiration using the linear slope of 13CO2 vs. 12CO2 curve. Then the application note will explain how to perform time synchronization between the LI-7825 and Smart Chamber, merge the two data sets, and conclude with instructions for data analysis with SoilFluxPro™ Software.
Explaining the Keeling plot
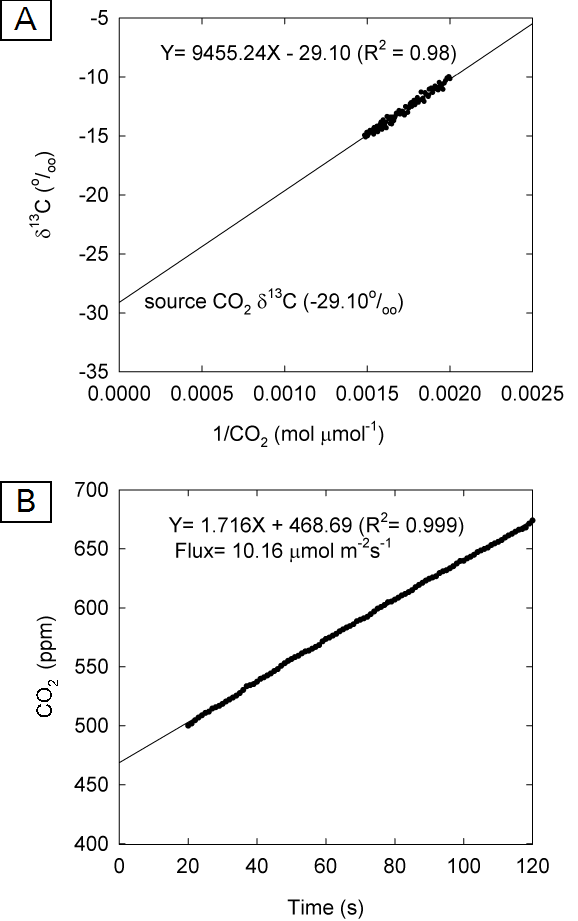
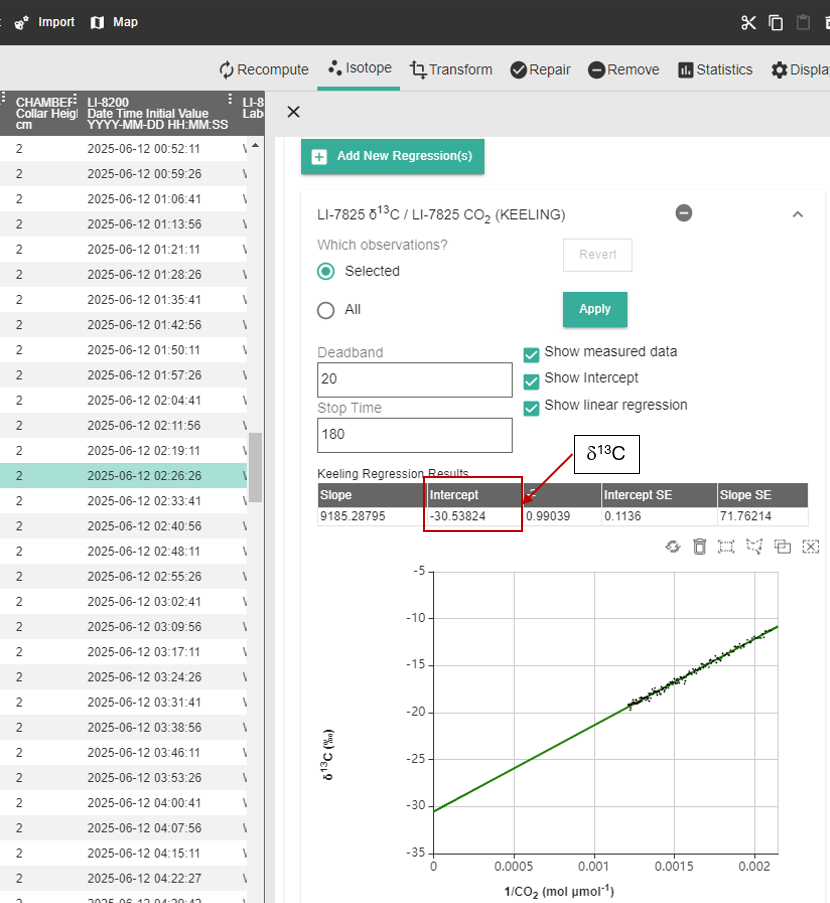
The Keeling plot has been used to determine the carbon isotope ratio (δ13C) of ecosystem respiration (Pataki et al., 2003), soil respiration (Flanagan et al., 1999), and other CO2 sources. With the closed-chamber method for soil CO2 flux measurements, the δ13C of soil CO2 from soil organic matter decomposition can be determined with the Keeling plot method (Flanagan et al., 1999) if the δ13C of chamber air is known as well. To do this, the chamber air δ13C is plotted against the inverse of chamber CO2 concentration and the intercept from that linear regression gives the carbon isotope ratio of the soil CO2 respiration (Pataki et el., 2003). Figure 1A shows an example of Keeling plot analysis from a closed chamber measurement with the Smart Chamber and an LI-7825. The Smart Chamber was sitting on a collar with a sealed aluminum base filled with moist soybean biomass material. From the 2-minute measurement, the Keeling plot yields an intercept of -29.10 ‰ for carbon isotope ratio for the source CO2 (i.e. soybean biomass material). This value is consistent with the value for a typical C3 species. The 2-minute time series of chamber CO2 concentration is shown in Figure 1B. The first 20 seconds of data points were excluded in the Keeling plot and linear regression analysis.
The slope method to determine the δ13C of soil respiration
The carbon isotope ratio (δ13C) of a sample material is defined as (Farquhar et al., 1989).

(C13/C12)sample is the molar ratio of 13CO2 to 12CO2 from the sample. (C13/C12)std is the molar ratio for the standard (Vienna Pee Dee Belemnite standard), which is 0.0112372.
Since the LI-7825 measures C12 and C13 separately, we can estimate the linear slope of C13 vs. C12 from the closed chamber measurement. In theory, this slope represents the molar ratio of C13 to C12 of the soil organic matter (SOM) if we assume there is no fractionation during the decomposition of SOM. Thus, equation 1 can be modified to:

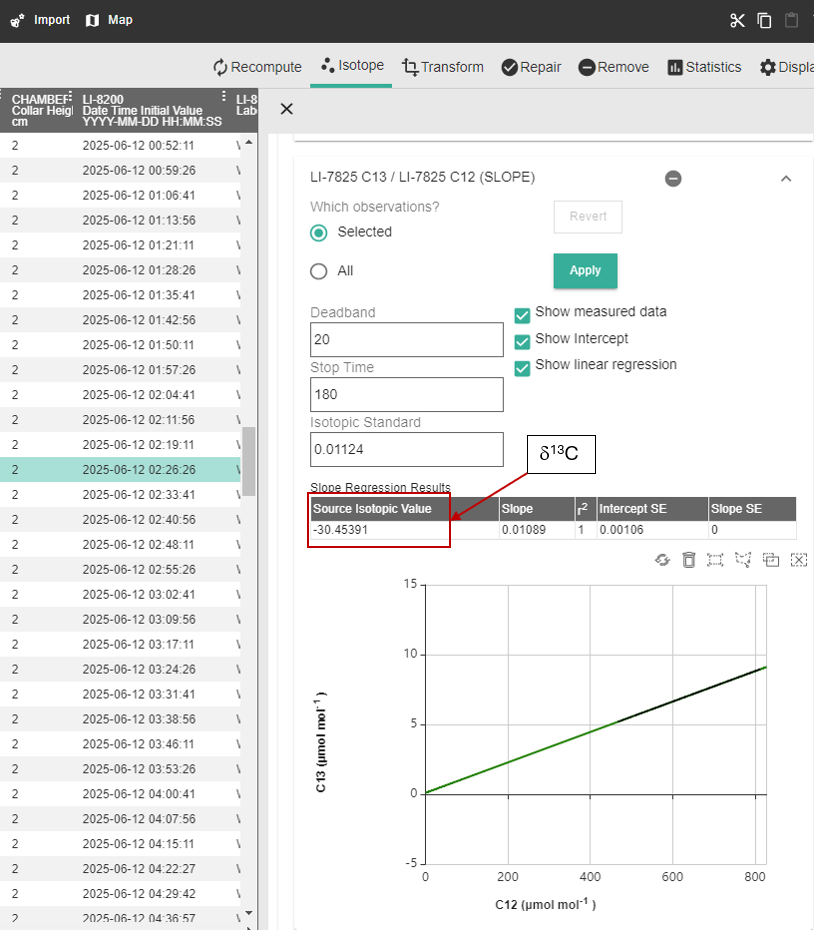
(C13/C12)slope is the linear slope when C13 (13CO2) is plotted against C12 (12CO2) from the chamber measurement. See Figure 2 for an example of using this slope method to determine the δ13C of soybean biomass material.
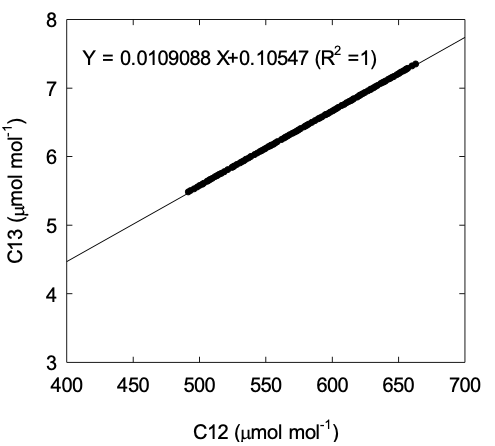
During this test, the Smart Chamber was closed with wet soybean biomass material inside. C13 and C12 were continuously measured with the LI-7825 for two minutes. From this measurement, the linear slope for C13 vs. C12 plot was 0.0109088 with R2 of 1.0 (see Figure 2). With the (C13/C12)std of 0.0112372, the δ13C of the soybean biomass material was found to be -29.22 ‰. The dataset shown in Figure 2 is from the same measurement as shown in the Keeling plot analysis in Figure 1A. The δ13C value of the soybean biomass material from the Keeling plot and the slope method are almost identical.
Time synchronization between the Smart Chamber and the LI-7825
See Initial setup for information on installing the cable assembly between the Smart Chamber and the LI-7825.
Since the gas concentration data from the LI-7825 is not captured in the Smart Chamber data files (*.json), you need to merge the datasets from two instruments by using timestamps during post-data processing with SoilFluxPro Software. Therefore, it is critical that the clocks on the two instruments are synchronized during measurements.
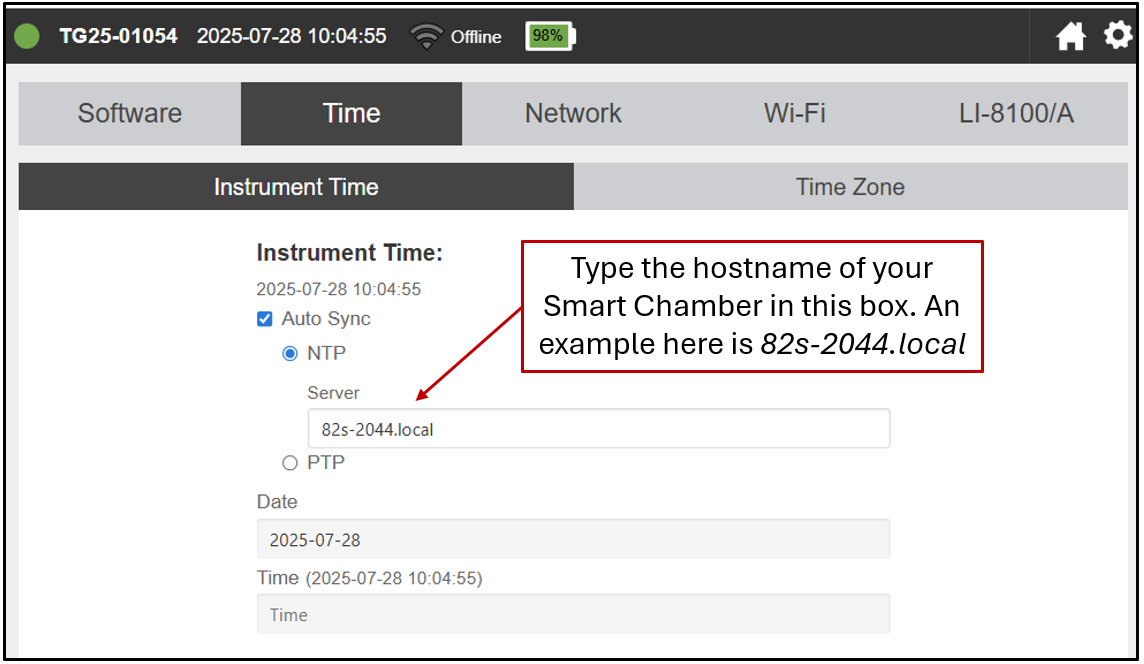
Ensure that the LI-7825 and Smart Chamber are connected using the provided Ethernet cable and tubing bundle. Make sure the two instruments clocks are set to use the same time zone. Then, on the Time setting in your LI-7825 interface, check Auto Sync, select NTP, and then specify the hostname of your Smart Chamber (e.g. 82s-2044.local) as the time server (see Figure 3). The clocks on the instruments should synchronize in about 2-3 minutes after setting the Smart Chamber as the NTP server for the LI-7825.
Note that the Smart Chamber clock will automatically synchronize to GPS time, so it is best to ensure that your chamber has achieved GPS lock before commencing measurements. Otherwise, you may observe time skips in your data series. GPS lock can be verified under Settings > Diagnostics in the Smart Chamber interface.
After you synchronize the clocks, you can configure the measurement protocol on the interface of the Smart Chamber. Right now, you will not be able to add the LI-7825 in the interface of the Smart Chamber, but you can still make the measurement. Since the gas concentration data will not be logged into the data files (*.json) of the Smart Chamber during the measurements, you will not be able to see the real-time CO2 flux in the field unless using a secondary analyzer such as the LI-870.
When you have high humidity in the field during your measurements, it is a good idea to set the Post Purge time to be a little bit longer, such as 7 minutes or longer. This will allow for the chamber to recover the water vapor buffer capacity. Lifting the chamber during the post purge can also speed up the recovery.
Refer to the relevant operating instructions for details on downloading data from the Smart Chamber and LI-7825.
Merging Data with SoilFluxPro Software
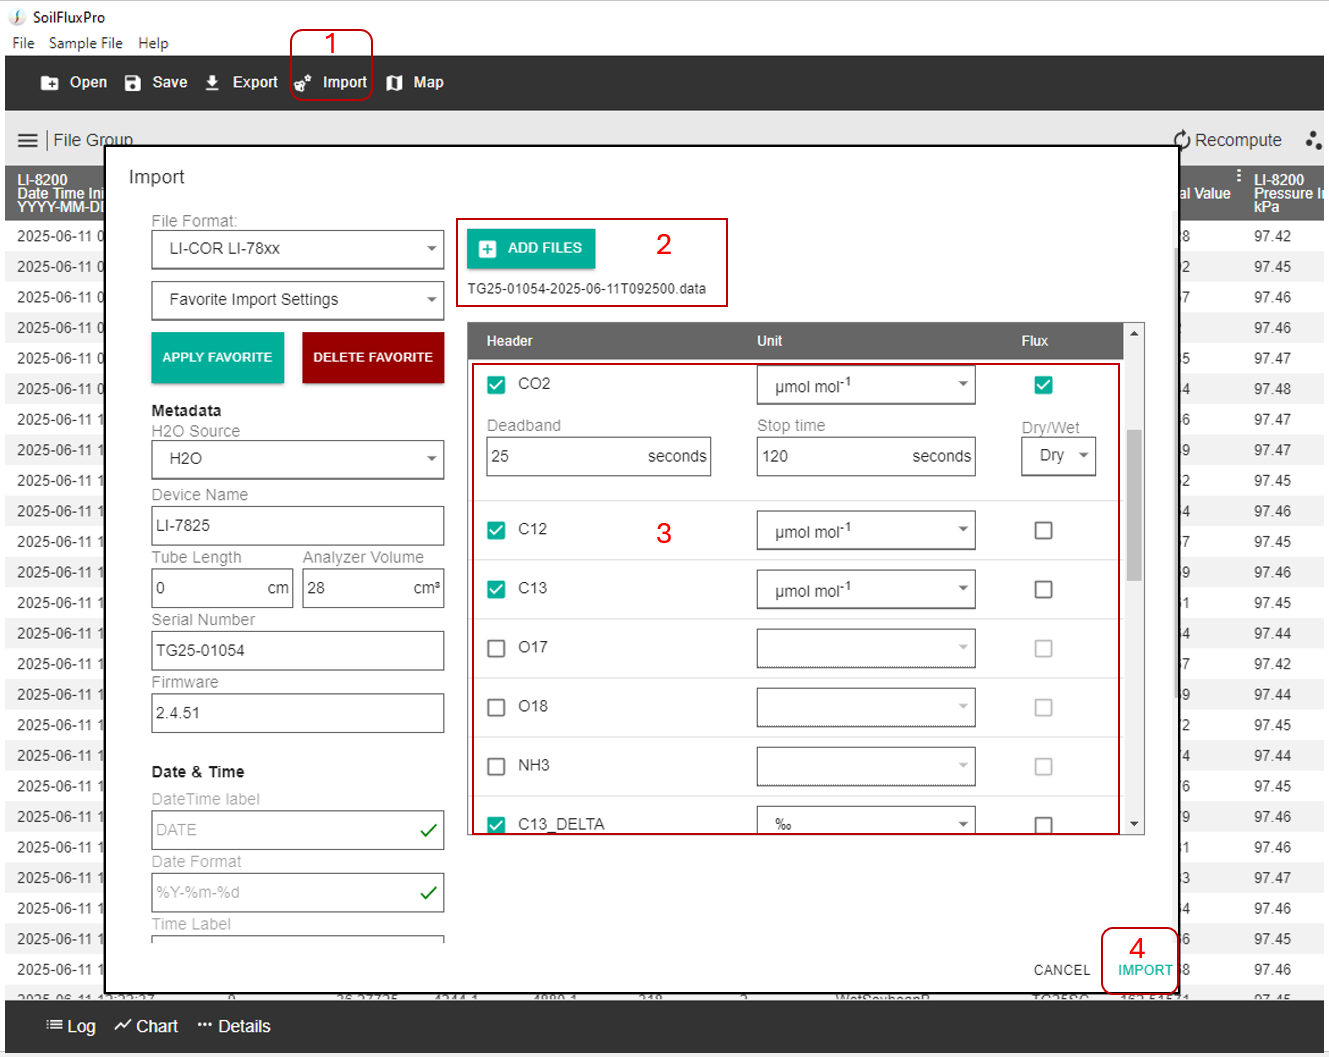
Open the Smart Chamber data file (*.json) with SoilFluxPro Software (SFP), then follow the steps described below to import the carbon isotope gas concentration data from LI-7825 (Figure 4).
-
Click Import from the menu to open the import options.
-
Click + ADD FILES and then select the LI-7825 data files you wish to import.
-
Check the boxes next to the variables you want to import and specify the unit for each variable.
Check the boxes at the right side of the unit box if you want SFP to compute the gas flux for you. You also need to specify the Deadband and Stop time for your flux calculation. If you just care about carbon isotopes, you only need to import the variables for CO2 (total CO2 concentration), C12 (12CO2), C13 (13CO2) and C13_DELTA (δ13C). You can also uncheck the variables you do not need to import into SFP software. You may also want to include diagnostic codes from LI-7825 so that you can use that information when you do the QA/QC of your results.
-
Click the Import button.
Using Keeling Plot and the slope method to determine δ13C of soil respiration
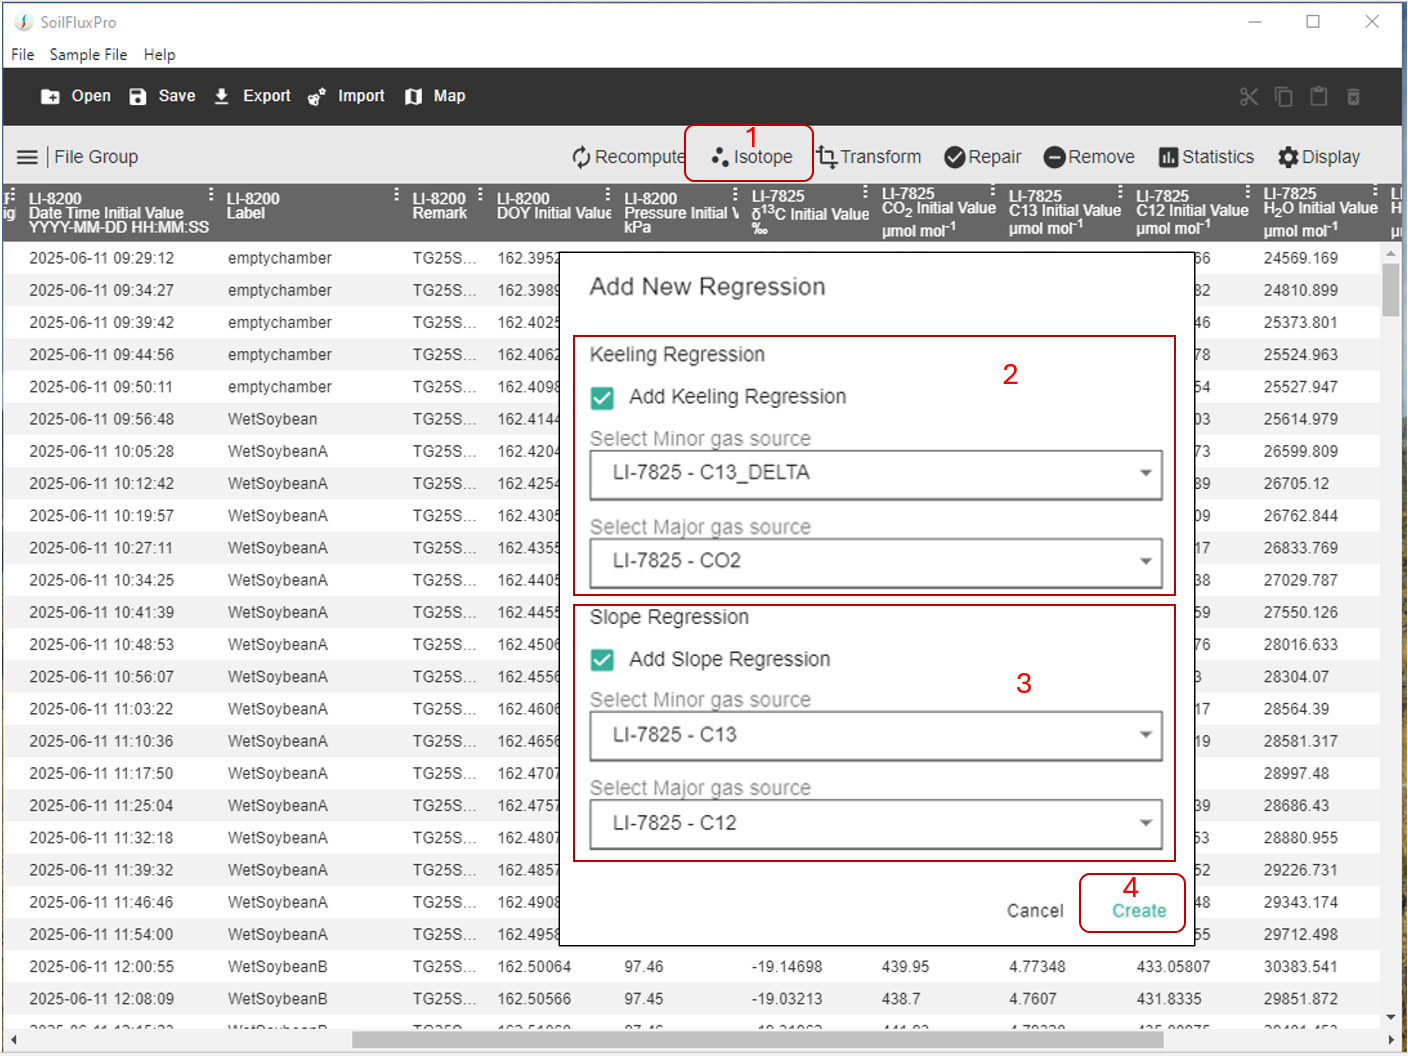
Once you import the data file from LI-7825 into SFP software, follow these steps to do the Keeling plot regression and the slope method to determine δ13C of soil respiration (Figure 5).
-
Click Isotope then click + Add New Regression(s) at the top right corner of SFP software.
-
For Keeling Plot Regression, select LI-7825-C13_DELTA (δ13C) as Minor gas source, and LI-7825-CO2 as the Major gas source.
-
For Slope Regression, select LI-7825-C13 (13CO2) as the Minor gas source, and LI-7825-C12 (12CO2) as the Major gas source.
-
Click the Create button.
Once Keeling plot and the Slope method is complete for your records, you will immediately see the following window (Figure 6).
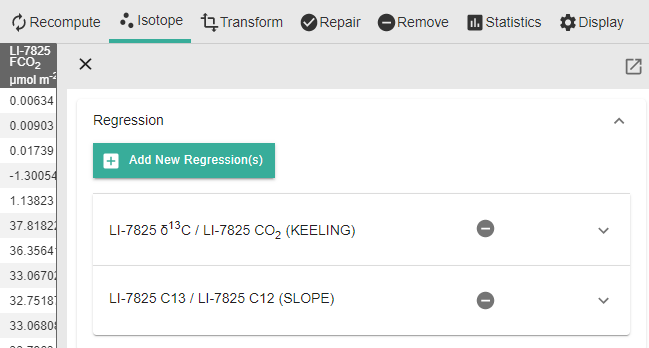
Click (KEELING) to see the Keeling plot analysis for your selected observation as shown in Figure 7.
Click (SLOPE) to see the slope method of your selected observation as shown Figure 8.
If you want to use a different value for the (C13/C12)std, you can do so by entering it and then clicking Apply.
See Downloading data from the instrument for instructions on how to export the result from SFP software for further data analysis for your research.
You can preserve all of the settings and calculations of isotope analysis by saving the file as *.82z format.
Some important considerations
When using the Smart Chamber and LI-7825 in the field, consider the following to minimize the uncertainties in your results.
-
Zero the LI-7825 before heading to the field. To achieve the best possible result, it is essential that you zero your LI-7825 every day in the morning before going to the field. For span calibration, we recommend calibrating your gas analyzer monthly. Please refer to the Maintenance section of the LI-7825 Instruction Manual for information on how to zero and span the gas analyzer and what kind of zero and span calibration gas tanks are recommended.
-
How long is the observation length you should use? This isotope gas analyzer (LI-7825) is portable with 1-Hz data output rate. So, normally you would only need to have 2-minute observation length to have enough CO2 range for carbon isotope ratio analysis. For a low CO2 flux field sites, set the observation length longer so you can have a CO2 increase of more than 50 ppm (Fig. 5 of Pataki et al., 2003). Our own experience also shows that a CO2 increase of around 50 ppm is sufficient to do Keeling plot and slope method to determine the carbon isotope ratio of soil respiration.
-
To have the desired stability and performance of your isotope gas analyzer and to minimize your waiting time during instrument warmup, we recommend that you always leave the analyzer ON. When it is not in use, we recommend plugging it in to AC power to keep the batteries charged.
-
The LI-7825 reports CO2 gas, δ13C, δ17O, δ18O, and NH3 gas in the sample. Even though the NH3 measurements are accurate, they are not necessarily representative of the NH3 that entered the tube because an unknown amount of NH3 has adsorbed to tube walls and other surfaces on the way to the analyzer. Therefore, NH3 flux measurements are not supported.
Smart Chambers with serial numbers 82S-2088 and up2 have the internal transient buffer. For older Smart Chambers, you can install an external transient buffer assembly (part number 9982-116) on the Air Outlet port of the Smart Chamber. Contact LI-COR for more information.
References
| 1 | Farquhar, G.D., Ehleringer, J.R. and Hubick, K.T. (1989). Carbon Isotope Discrimination and Photosynthesis. Annual Review of Plant Physiology and Plant Molecular Biology, 40(1), pp.503–537. doi:https://doi.org/10.1146/annurev.pp.40.060189.002443. |
| 2 | Flanagan, L.B., Kubien, D.S. and Ehleringer, J.R. (1999). Spatial and temporal variation in the carbon and oxygen stable isotope ratio of respired CO2 in a boreal forest ecosystem. Tellus B: Chemical and Physical Meteorology, 51(2), pp.367–384. doi:https://doi.org/10.3402/tellusb.v51i2.16306. |
| 3 | Pataki, D.E., Ehleringer, J.R., Flanagan, L.B., Yakir, D., Bowling, D.R., Still, C.J., Buchmann, N., Kaplan, J.O. and Berry, J.A. (2003). The application and interpretation of Keeling plots in terrestrial carbon cycle research. Global Biogeochemical Cycles, 17(1). doi:https://doi.org/10.1029/2001gb001850. |