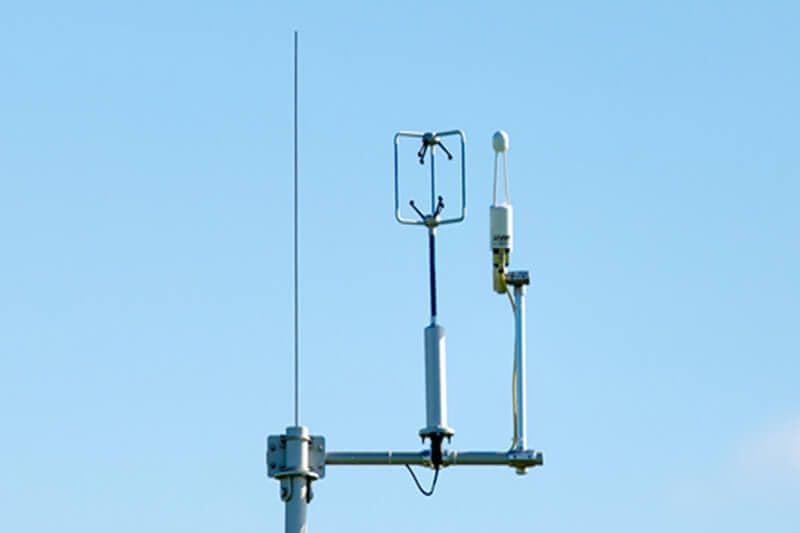
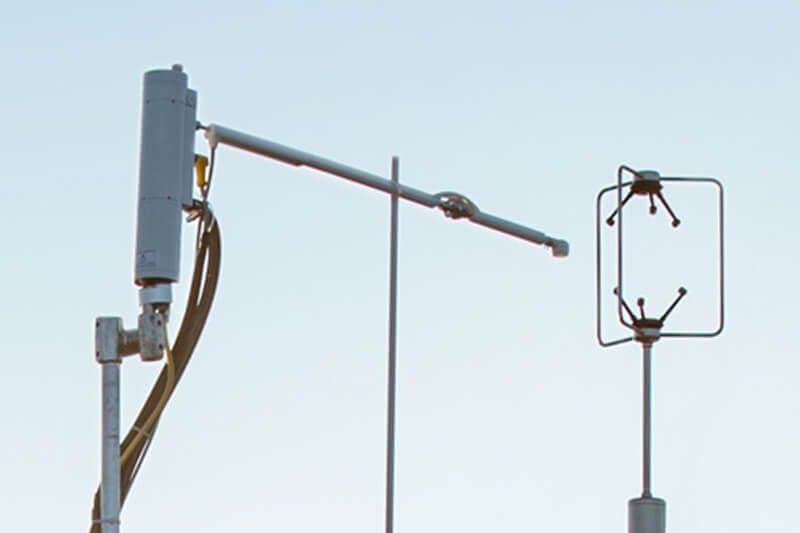
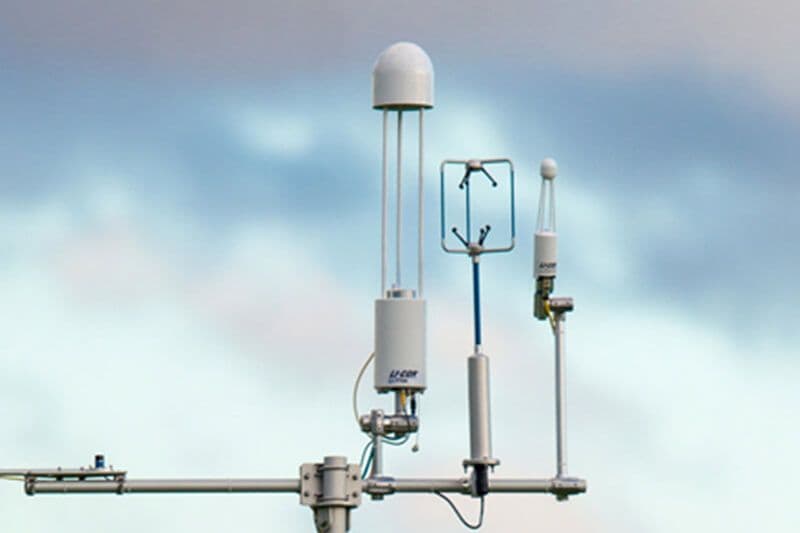
Tovi® Software

Powerful processing tools for EddyPro® results.

Eddy covariance results are a time-series of many measured and computed parameters that tell the story of fluxes at the measurement site. But the story is often incomplete. Tovi allows you to visualize the time series, screen for quality, gap-fill missing periods, data with simplicity and clarity.

Laptop displaying the Tovi software

Key Features of Tovi

Visualization

Make your complex eddy covariance data understandable, accessible, and usable. View and export data in tabular and graphical format, quickly identify areas in need of gap filling or QA/QC, and discover trends visually in graphs, plots, and dashboards, including Fingerprint plots, Coverage graphs, and Energy Balance dashboards.


Gap Filling

The Gap Filling tool provides complete flux data for your carbon or water budget analysis with Automated Weather Station data retrieval of your drivers. New Configurable Gap Filling adds the option to fill gaps in methane fluxes, evapotranspiration, friction velocity, and more using custom drivers and thresholds. Both tools use the Marginal Distribution Sampling Method (MDS) developed by Reichstein et al. 2005. Use the same technique as FluxNet in the 2015 data synthesis at the click of a button.

Footprint Modeling

Determine the footprint of your flux measurements around your tower using the Flux Footprint Prediction model from Kljun et al. 2015. Visualize a 2-D footprint overlaid on a satellite image of your flux site and select unique areas around your site to aggregate into your footprint results. Easily save and export your results.


Flux Partitioning

Partition your Net Ecosystem Exchange (NEE) fluxes into Gross Primary Productivity (GPP) and Ecosystem Respiration (Reco) using the Reichstein et al. (2005) “Night-time method.” This technique models ecosystem respiration primarily as a function of temperature using only night-time data.

QC Screening

Complete your QC with a single software package. Filter your flux data by any variable or use a slider to easily set the min/max threshold.

u* Threshold Detection

Use either the Change Point Detection (CPD) technique from Barr et al. (2013) or the Moving Point Detection (MPT) technique from Reichstein et al. (2005) for detection of friction velocity threshold.

Analysis History

Revision control for your flux data analysis! Branch-like structure allows for exploratory analysis without altering earlier versions of your data.

Carbon Cycle Dashboard

The carbon cycle dashboard helps visualize the accumulation of carbon in the ecosystem, including the components of ecosystem respiration (Reco) and gross primary productivity (GPP). Two additional charts display the daily partitioning (median and ±1σ) and ecosystem flux vs. radiation.

Citation Builder

Export citations for the techniques used in your Tovi analysis.

Data Import/Export

Optimized for output from EddyPro Software. Import directly into Tovi and get straight to work creating sites and beginning your analysis.