

Measuring gas exchange helps characterize leaf-level CO2 and H2O flux, stomatal conductance, and more. Pulse amplitude modulation (PAM) chlorophyll a fluorescence measurements provide information about the light-driven electron transfer rate (ETR), non-photochemical quenching (NPQ), and other reactions that protect a leaf when it absorbs excess energy. Together, they reveal additional insights into photobiology.
Integrated analyses of gas exchange and chlorophyll a fluorescence over the same leaf area can provide a more complete picture of photosynthesis than when using either technique alone. For example, when used together, these techniques can provide one way to assess the pathway of CO2 diffusion from the intercellular leaf air space to the chloroplast.

The resistance of CO2 along this pathway is currently the subject of intense research aimed at improving water use efficiency in plants. Given that water stress limits plant productivity worldwide, understanding these diffusive processes is essential.
Unsurpassed for CO2 and H2O gas exchange at the leaf level or CO2 exchange of aquatic samples, the LI-6800 provides direct measurements of CO2 uptake to characterize the photosynthetic assimilation rate of samples.
The LI-6800 measures leaf-level gas exchange with the steady-state assimilation equation where A is CO2 assimilation, µ is the flow rate, c1 and c2 are the CO2 concentration before and after the sample, and S is the leaf area.
Assimilation is computed from the concentration differences and flow rate where A is CO2 assimilation, µ is the flow rate, c1 and c2 are the CO2 concentration before and after the sample, and w1 and w2 are water vapor before and after the sample. The mass balance computation gives flux of CO2 between the liquid sample and the cuvette head space. Flux is coupled to the true carbon assimilation and the kinetics of the carbonate system for the aquatic sample. When normalized to cell density, mass, or chlorophyll content, the aquatic chamber provides measurements of µmol CO2 cell-1 s-1, µmol CO2 mg-1 s-1, or µmol CO2 µg-1 s-1.
For survey measurements with the Soil CO2 Flux Chamber (6800-09), the LI-6800 operates as a closed system. It computes gas exchange using the familiar soil gas flux equation where Fc is flux of CO2, V is system volume, P is atmospheric pressure, W is water mole fraction in the chamber, R is the gas constant, S is the soil area, T is chamber air temperature, and dC’/dt represents the change in dry CO2 concentration over time (t).
Based on a reformulation of the steady-state gas equation, the Dynamic Assimilation Technique allows measurements of photosynthetic gas exchange in non-steady-state conditions, as shown by the equation where A is CO2 assimilation, μ is the flow rate, c1 and c2 are the CO2 concentration before and after the sample, S is the leaf area, and dC/dt is the rate of change of CO2 In the system. The dynamic assimilation equation shows that steady state is a special case of the mass balance equation where dC/dt is equal to 0 (Saathoff and Welles, 2021). The LI-6800, equipped with the 6800-01A Fluorometer, is the only instrument capable of the Dynamic Assimilation Technique.
For details, see
Saathoff, A. J., & Welles, J. (2021). Gas exchange measurements in the unsteady state. Plant, Cell & Environment, 44(11), 3509–3523. https://doi.org/10.1111/pce.14178
Improved combined gas exchange and fluorescence measurements.
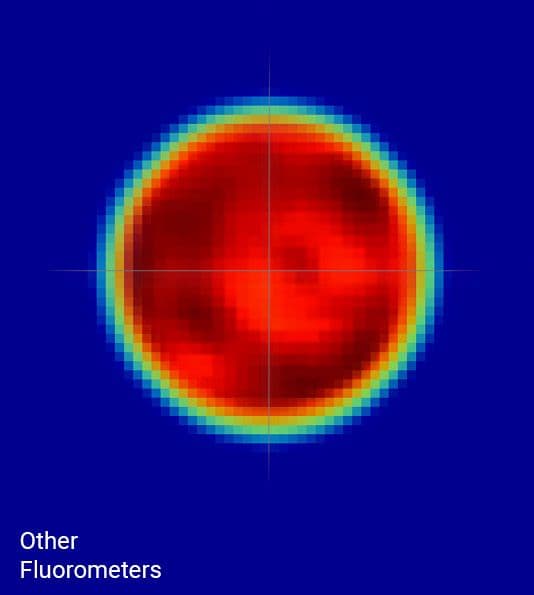
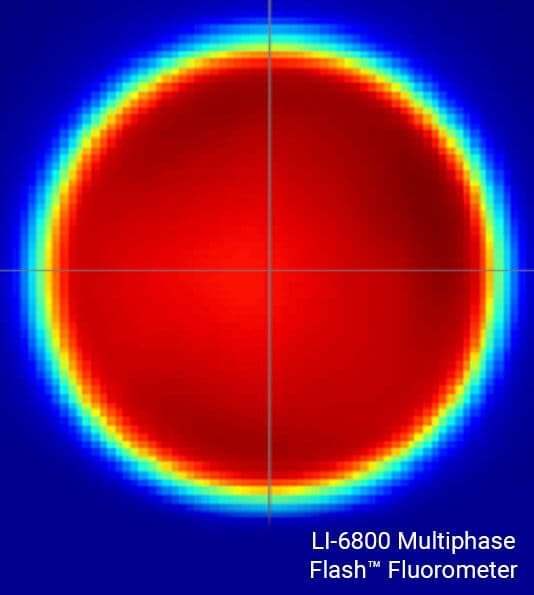
Understanding leaf-level processes from an integrated assessment of gas exchange and fluorescence requires that the leaf area under investigation be illuminated by a highly uniform light source. If not, gas exchange parameters can be artifactually inaccurate, resulting in errors that propagate to many other parameters.
The LI-6800 fluorometer light source is highly uniform, with light intensities of ±10% of the mean over 90% of the leaf area. This high light uniformity minimizes artifacts that can cause errors in gas exchange measurements and confound the understanding of processes that require comparison of gas exchange and PAM chlorophyll a fluorescence parameters.
The maximum fluorescence yield must be known in order to accurately estimate ETR and NPQ, as well as several other important parameters. Historically, estimation of the maximum fluorescence yield has been achieved using short (one second or less), high intensities (many times higher than full sunlight) flashes of light termed 'saturation flashes'. The yield of fluorescence increases hyperbolically towards an asymptote in response to progressively increasing light intensity, at which the maximum fluorescence yield can be most accurately approximated.
Estimation of the maximum fluorescence yield (Fm'), when measured in an illuminated leaf, requires the use of extreme light intensities never encountered by plants in nature. Furthermore, estimation of Fm' requires even higher intensities as NPQ increasingly develops in a leaf, which begins to occur at light intensities well below full sunlight.
The LI-6800 fluorometer can deliver traditional saturation flashes upwards of 16,000 µmol m-2 s-1 over a leaf area of 6 cm2; something no other commercial fluorometer can do.

An innovative technique, Multiphase Flash™ Fluorescence, can be used to quickly estimate, using a single flash event, the fluorescence yield at infinite irradiance, which is a more accurate determination of 'true' Fm. This value, known as extrapolated maximum fluorescence yield (EFm'), is a more accurate assessment of “true” Fm', contrary to traditional measurements of apparent maximum fluorescence yield (AFm') using traditional rectangular flashes.
Experimental research shows that EFm' values are invariably higher than AFm' values measured using increasingly intense saturating flashes of light (Q'). In some instances, erroneous estimates of Fm' can subsequently result in errors in estimation of ΦPSII by as much as 15-30%. Furthermore, while the measured values of AFm' progressively increase with increasing Q', estimates of EFm' measured across the same range of Q' intensities are constant, except at the lowest Q', indicating that accurate estimates of Fm' can be achieved at lower flash intensities using the Multiphase Flash™ Fluorescence method. As such, since this technique can be used to estimate Fm' using moderate flash intensities, plants that are sensitive to photodamage can be studied with less risk of damage from the saturation flash.
An aspect of obtaining accurate fluorescence parameters concerns the signal-to-noise ratio. This is especially important during fluorescence induction curves, when data points are being acquired rapidly and undergoing minimal averaging.
The LI-6800 uses a carefully refined protocol in which modulated light is altered solely by changing the frequency of the modulated pulses, not the pulse amplitude or the pulse width. This ultimately prevents the induction of photosynthesis by the measuring light in both dark- and light-adapted leaves and optimizes the fluorescence signal. The LI-6800 provides predetermined setpoints that optimize the signal-to-noise ratio without violating the PAM chlorophyll a fluorescence technique.
Capable of modulating the measuring light at frequencies up to 250 kHz, the LI-6800 fluorometer can fully characterize the fluorescence induction transient of a leaf with high resolution.
Fluorescence induction (OJIP) curves serve as a means of rapidly assessing exquisite photophysical details of a key pigment-binding protein complex, PSII, in which photosynthesis is initiated. The different transitions of an induction curve (historically termed “OJIP transient”) can be used to measure environmental stress in plants. The LI-6800 fluorometer is unique in that it can measure two types of fluorescence during induction: 1) modulated; and 2) continuous. The photophysical reactions underlying an OJIP transient occur over a range of time scales. These time scales of the OJIP transient require that measurements occur on time scales ranging from microseconds to milliseconds. The LI-6800 fluorometer can acquire modulated and continuous fluorescence signals on time scales ranging from 4 microseconds to hundreds of milliseconds.

Continue Reading