Printable PDF: Using Campbell Scientific Dataloggers to Collect Biomet Sensor Data.
Application note that describes how to use a CR1000, CR3000, or CR6 in a LI-COR eddy covariance system.
With the addition of the SmartFlux® 2 and 3 Systems, LI-COR eddy covariance systems can collect biomet data from the Campbell Scientific CR6, CR1000, or CR3000 dataloggers. Compatibility between the datalogger and the analyzer has three requirements:
- The logger needs to support an Ethernet interface with a static IP address on the same network as the SmartFlux 2 or 3 System (and the LI-7550 or LI-7500DS).
- The data that you want to send to the SmartFlux System needs to be stored by the logger in a datatable named Biomet.
- The field names used in the data table need to follow the standardized format required by EddyPro® Software.
Initial setup
- Install an Ethernet cable
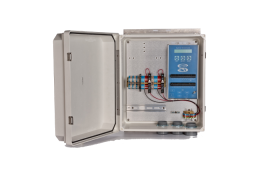
- For the datalogger to communicate with the eddy covariance (EC) system, it needs a physical network connection on the same network as the SmartFlux 2 or 3, with a user-assigned static IP address. The CR6 has a built-in Ethernet port used for networking. If using the CR1000 or CR3000, an additional hardware component will be needed to network the data logger (e.g., NL115, NL116, or NL121 Ethernet Interface).
- Sync Clocks
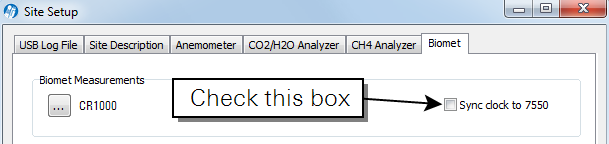
- When the EC system polls the datalogger for new data it can also set the datalogger’s clock to match the time of the rest of the system. Enable this feature in the LI-7500A/RS or LI-7200/RS software. At the main dashboard window, click Site Setup > Biomet, and check the box next to Sync clock to 7550.
All communication to the datalogger is done through its web API (port 80). For the clock to be set using this protocol, the permissions need to be changed on the datalogger to allow read/write access. Network parameters and permissions can be set on the datalogger using LoggerNet’s Device Configuration Utility.
Configuring the network and permissions
- Power on the datalogger and connect the datalogger to a computer using its RS-232 connection.
- Launch Device Config Utility from LoggerNet’s Utilities menu.
- Select the datalogger type under Datalogger and the port it is connected to under Communication Port. Click the
 button to bring up a list of available serial ports.
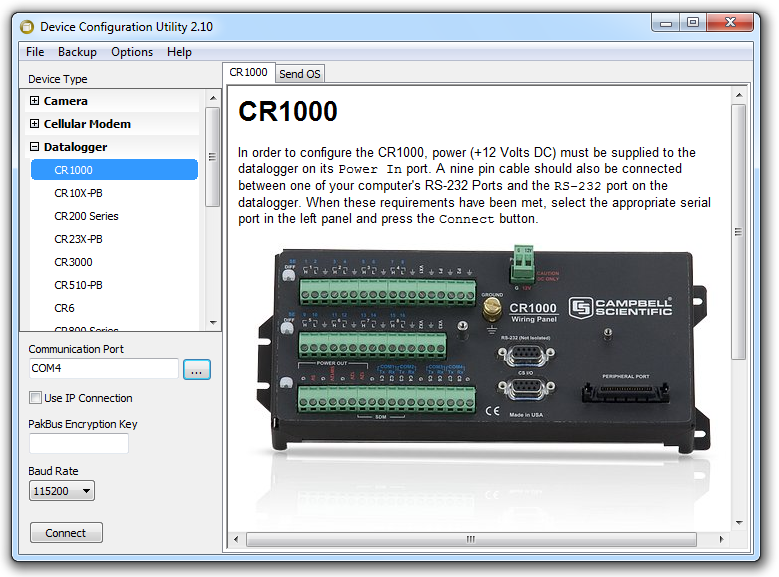
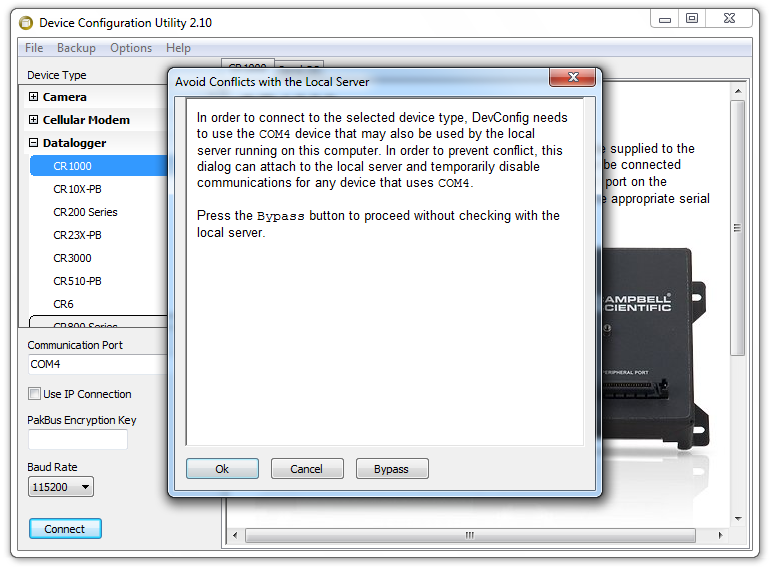
- Click Connect and then choose Bypass at the pop-up window.
- Once connected, under Deployment choose TCP/IP and set appropriate values for the IP Address, Subnet Mask, and IP Gateway.
- Below, we show values appropriate for a system using a Sierra Wireless AirLink® LS300 cellular modem. Make a note of the IP address set on the datalogger in this step. It will need to be entered into the Biomet information in the EC system interface software (see the LI-7500A/RS or LI-7200/RS Instruction Manuals or online Help).
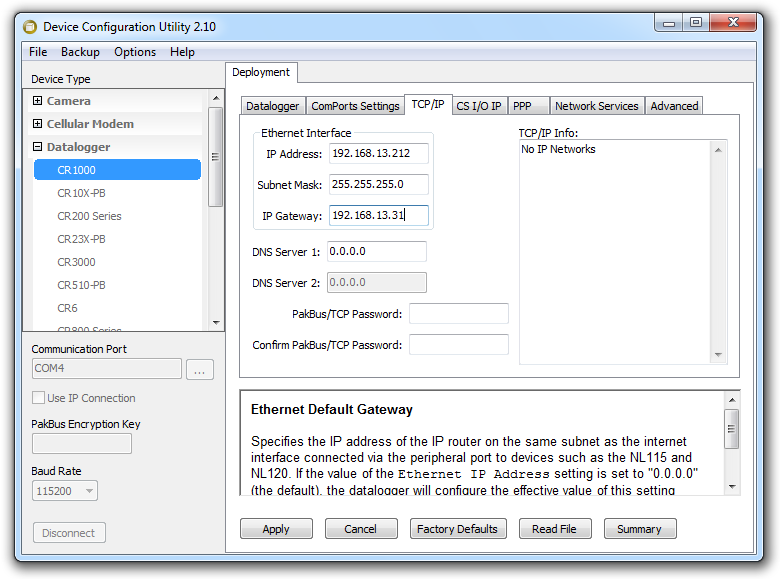
- Click Apply.
- Choose Network Services under Deployment.
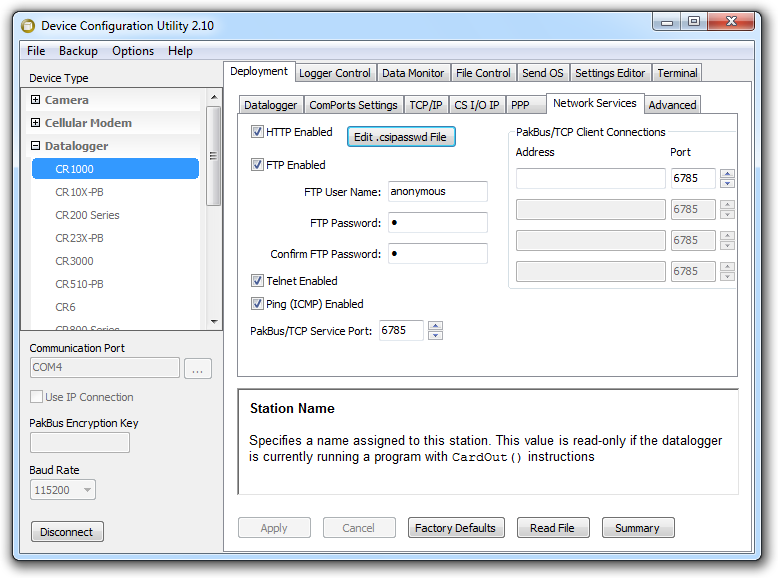
- Click Edit .csipasswd File.
- When the Datalogger .csipasswd File Editor opens, select anonymous under User Names: and change the drop down for Access Level: to read write.
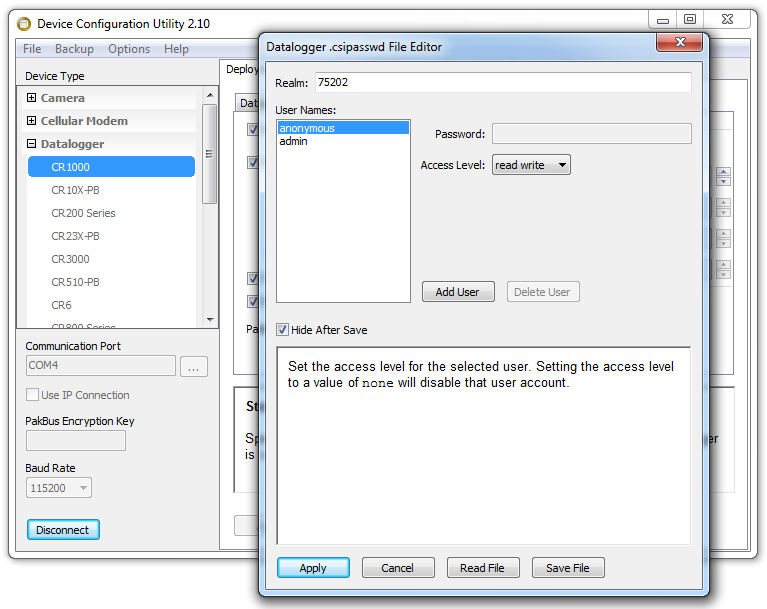
- Click Apply.
- Click Disconnect in the lower left corner of the Device Configuration Utility and exit the application.
Creating the Biomet data table
Data tables are created using the DataTable() instruction in CRBasic. For data in a data table to be accessible by the EC system, simply name the table "Biomet" as shown in the example below.
Important: Configure the logger program and datatable before you connect the logger to the SmartFlux System.
DataTable(Biomet,True,9999)
    DataInterval(0,60,Sec,10)
EndTable
Here the data table will hold 9999 records (one week of data) and a new record will be added once every minute (DataInterval() of 60 seconds). The EC system polls the table for the newest record every 10 seconds and stores that data into the .ghg file once per minute (the nearest neighbor is logged). In this application, there is typically no need to store data more often than this on the datalogger.
Creating field names that are compatible with EddyPro
When the EC system polls the data table for new records, it sees and uses the field names present in the data table to label columns in the .ghg file and to create appropriate metadata for the biomet measurements. To work correctly, the field names used on the CSI logger need to follow the labeling format used by EddyPro Software. The field name needs to start with the EddyPro label from Table 2, the numeric units identifier from Table 1, the numeric data identifier from Table 1, and the position information. All other values should be separated by an underscore (_). For a sensor measuring air temperature in degrees Celsius, the EddyPro compliant field name would look like:
TA_2_1_1_1_1
Or for a relative humidity measurement:
RH_19_3_1_1_1
The field name can be applied to the variable several different ways. The simplest method is to declare the variable with the EddyPro compliant name initially. In the example below we create two variables, one for air temperature and one for relative humidity:
Public TA_2_1_1_1_1, RH_19_3_1_1_1
or
Dim TA_2_1_1_1_1, RH_19_3_1_1_1
This method may not be the most efficient when dealing with replicate sensors or sensors that return multiple values. In these cases, an array and aliasing may be more useful:
Public sensorvalues(2)
Alias sensorvalues(1) = TA_2_1_1_1_1
Alias sensorvalues(2) = RH_19_3_1_1_1
Field names can also be modified in the data table itself using the FieldNames() instruction as shown below:
DataTable(Biomet,True,9999)
    DataInterval(0,60,Sec,10)
    Average(2,sensorvalues(),FP2,0)
    FieldNames(“TA_2_1_1_1_1:, RH_19_3_1_1_1:”)
EndTable
When writing data to the data table, avoid using the Average() instruction when not using FieldNames() to specify EddyPro complaint names in the data table. Average() by default appends _avg to the end of the field name, breaking EddyPro compliance. If average values are desired and FieldNames() won’t be used, use the AvgRun() instruction inside the scan to compute a running average and then use Sample() to record the running average in the data table.
Below is a simple example CRBasic program that shows collection of data from a Vaisala HMP155 Temperature and Relative Humidity sensor using EddyPro compliant names. The sensor is connected to single-ended channels 1 and 2 in this example.
'CR3000 Series Datalogger
‘EddyPro compliant biomet example
‘HMP155-->CR3000
‘yellow-->SE1
‘white-->SE2
‘red, black, green-->ground
‘blue-->+12V
'Declare Variables and Units
Public sensorvalues(2)
DataTable(Biomet,True,9999)
    DataInterval(0,60,Sec,10)
    Average(2,sensorvalues(),FP2,0)
    FieldNames("TA_2_1_1_1_1:,RH_19_3_1_1_1:")
EndTable
BeginProg
    'Main Scan
    Scan(5,Sec,1,0)
        VoltSe(sensorvalues(1),1,mV1000,1,0,0,_60Hz,0.14,-80)
        VoltSe(sensorvalues(2),1,mV1000,2,0,0,_60Hz,0.1,0)
        If sensorvalues(2)>100 AND sensorvalues(2)<108 Then
            sensorvalues(2)=100
        EndIf
        'Call Data Tables and Store Data
        CallTable Biomet
    NextScan
EndProg
Unit identifiers
The unit identifiers specify which units to associate with each variable.
Data identifiers
The data identifiers specify which label to associate with each variable.
Note: Variables with data identifiers 40 through 45 are recognized by the LI-7550, but as of the writing of this document, are still treated as custom variables in EddyPro.
Relating field names with sensor position
With multiple sensors, some of which measure the same variable at a different (or the same) position on a station, it can be difficult to know which sensor provided which data. The scheme described here will unambiguously relate each sensor to the data it provides.
The horizontal position, vertical position, and replicate at a specific position will provide enough information to distinguish all sensors on a meteorological station.
In the dataset, an air temperature variable looks something like TA_2_1_1_1_1. To interpret the code:

|
|||||
| Standard Label | Units Identifier | Variable Identifier | Horizontal Position | Vertical Position | Replicate |
Note: These values are integers. They are not floating points that represent real distances. You'll need to record the distances elsewhere.
Using Biomet.dld with sensor packages
LI-COR provides a generic CRBasic program (Biomet.dld) that accommodates all four standard biomet sensor packages available from LI-COR and can compile on a CR6, CR1000 or CR3000 datalogger. The program uses pre-compiler directives and a user-accessible constants table (BiometConstants; accessed through the logger keypad or the datalogger support software) to allow it to be configured without the need to modify the program in the CRBasic editor. To use Biomet.dld, the logger needs to be running OS28 or newer. Download biomet.dld from: https://licor.app.boxenterprise.net/s/uk0xougnxfq4w7424su4hszyocz5tg3m
Uploading Biomet.dld and configuring measurements
- Connect the datalogger to power and physically connect it to the computer either through RS-232 or Ethernet.
- Create a new station by following the prompts in LoggerNet’s Setup application.
- Setup is found under the Main menu in LoggerNet.
- In LoggerNet’s Connect application (Main menu) select the station and click Connect.
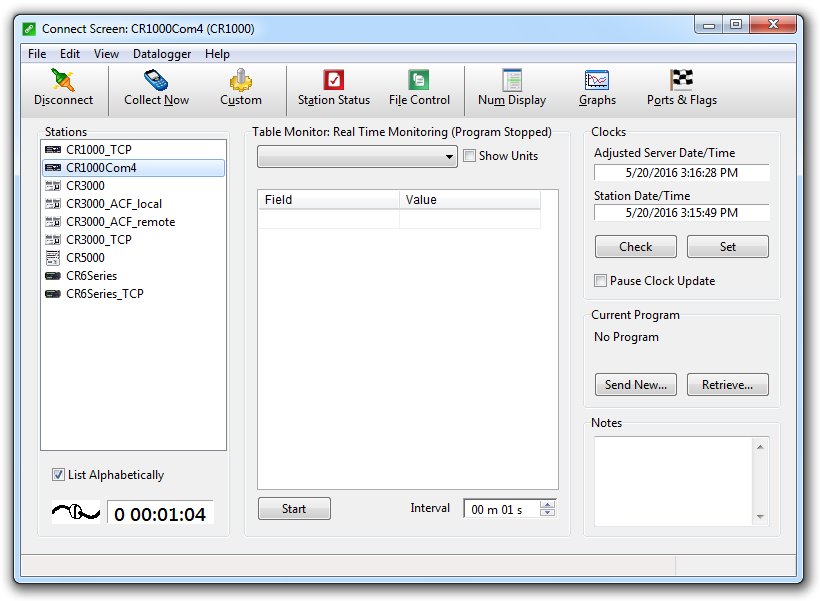
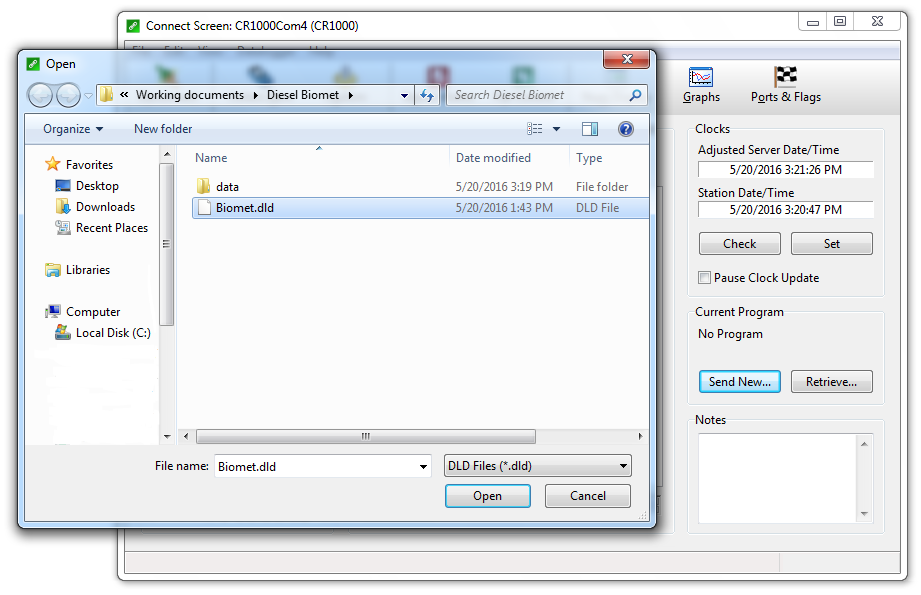
- Once a connection is established, click Send New… from under Current Program and navigate to where Biomet.dld is stored on the computer.
- To see Biomet.dld in available files select DLD Files (*.dld) or All Files (*.*) for the file type.
- Once the program has uploaded and compiled, select BiometConstants from the dropdown menu under Table Monitor: Real Time Monitoring. If the value fields are blank, click Start at the bottom of the table.
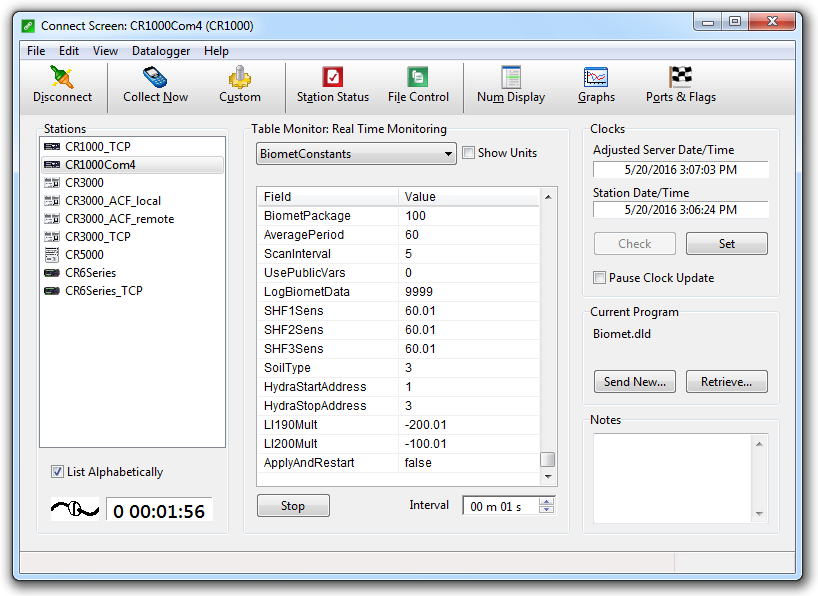
- If not using biomet package 100, select the value for BiometPackage and change the number to correspond to the package in use.
- Click Enter so that the new value is retained in the table. If using biomet 100 skip to step 10.
- Select the value next to ApplyAndRestart at the bottom of the table, change it to true, and click Enter.
- This will force the logger to apply the new values and recompile the program. Communication to the logger will be lost during this process and the table definitions will need updating after reconnecting.
- Wait 30 seconds or so and click Connect to reconnect to the logger.
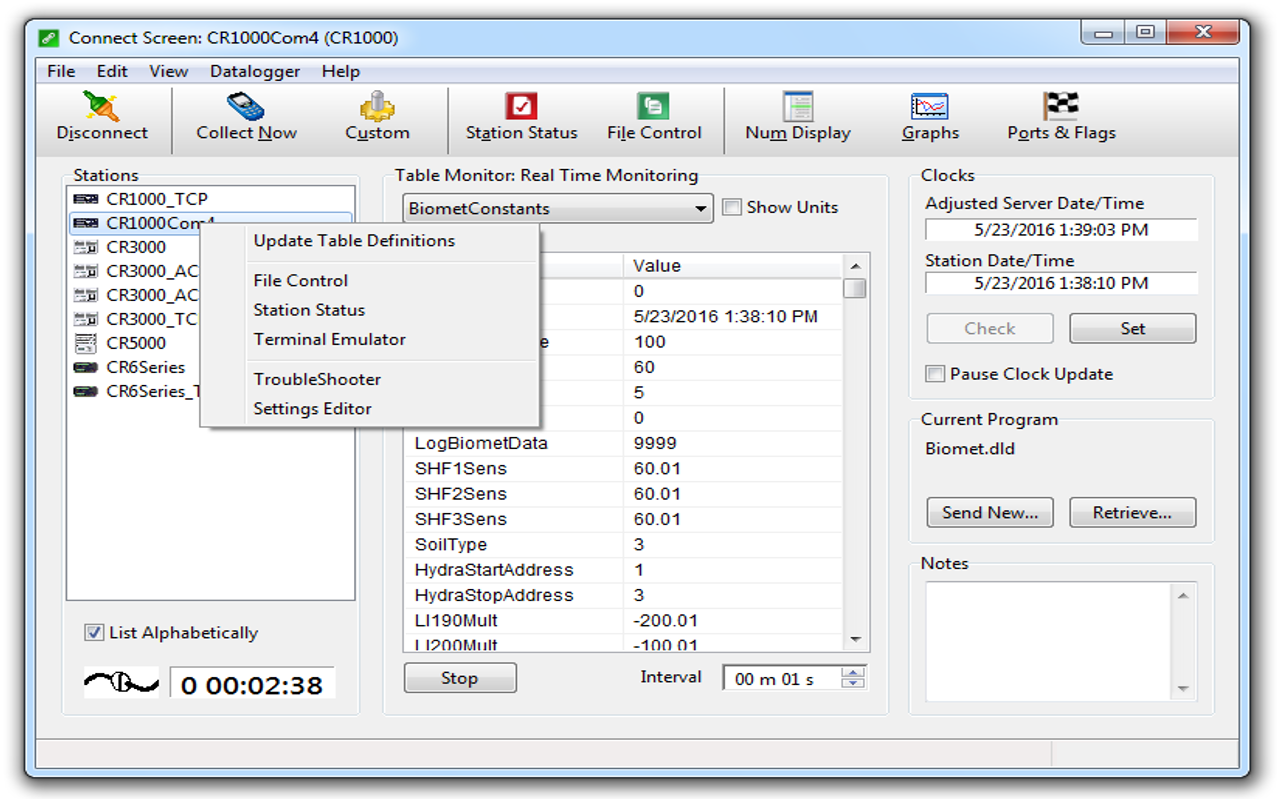
- Once connected, right click the station and select Update Table Definitions and click Merge.
- Select BiometConstants again and edit the values associated with the various fields as needed.
- Click Enter after entering each new value so that it will be retained. A summary of all potentially available fields with their description is given in Table 1‑1.
- Once all required fields have been edited, select the value next to ApplyAndRestart at the bottom of the table, change it to true, and click Enter.
- Again, this will cause the logger to recompile the program and lose connection with the computer.
Three data tables may be created by Biomet.dld depending on the sensor package selected. For all sensor packages, a table containing a single record of version information (VersionInfo) and a table containing one minute mean sensor data (Biomet) are created. For all packages other than biomet 100, an additional table is created that contains flags indicating the state of various program controls (ControlFlags). The number of records stored in Biomet and ControlFlags is user set from BiometConstants.
All voltage measurements are treated as single ended measurements in Biomet.dld. This is a consequence of the limited number of input channels available on the dataloggers supported by the program.
Biomet.dld uses the SDI-12 protocol to communicate with up to three Stevens HydraProbe II soil moisture sensors at sequential addresses. If it fails to communicate with one of the sensors, it will not fill Biomet with any data, as the M! command does not allow for a timeout and the program will not advance beyond the initial call for soil moisture data. To avoid this issue, make sure the probes are connected correctly and the address range is specified correctly in BiometConstants. By default the program expects the three sensors at addresses 1, 2 and 3. New sensors come from the factory set to address 0 and need to be manually addressed by the user. To set an address on an SDI-12 device through the logger, see the instructions below.
Setting the address on an SDI-12 sensor
- Connect the sensor to the logger (only one sensor should be connected at a time): blue wire to C1, black to ground, red to SW-12 or SW-12-1.
- Connect to the datalogger as described in Uploading Biomet.dld and configuring measurements.
- There is no need to create another station if the setup has already been done.
- Under Stations right-click the station name and choose Terminal Emulator from the pop-up menu.
- Once the terminal emulator window opens click Open Terminal and press Enter to bring up the datalogger prompt (CR1000> in the figure).
- It may take several Enter presses to get the prompt.
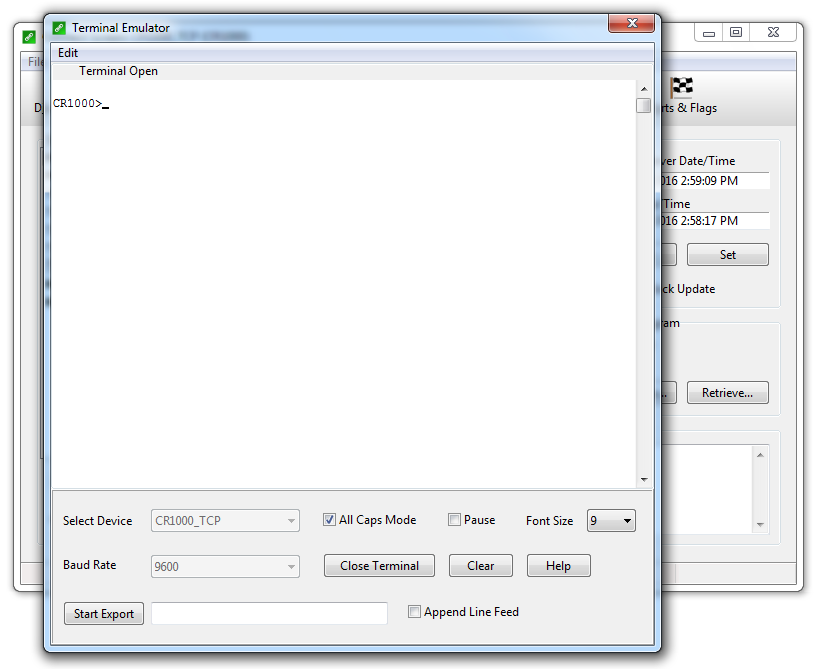
- At the prompt enter sdi12 and press Enter.
- Note that the entry is not case sensitive.
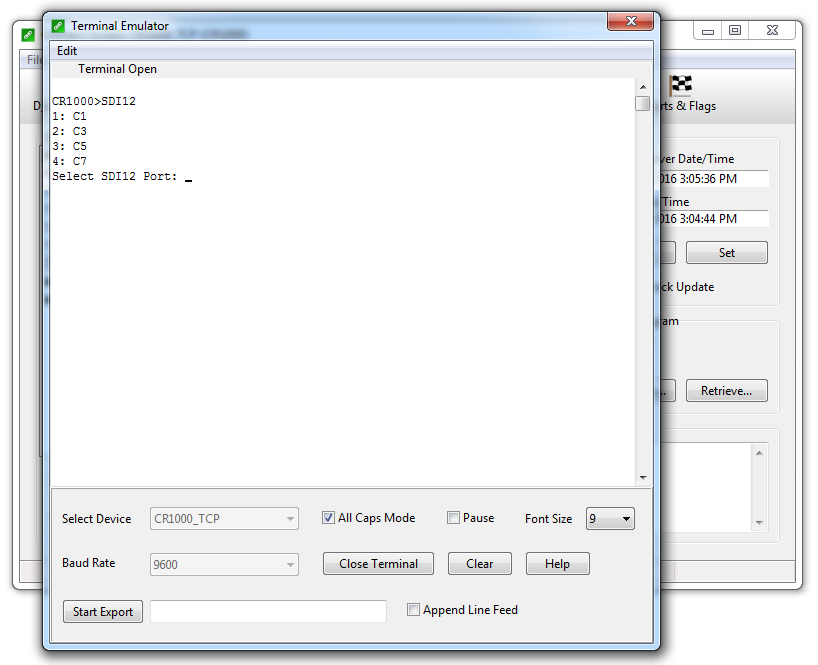
- A list of available SDI-12 ports will be displayed in the terminal.
- Enter 1 at the Select SDI12 Port: prompt and then press Enter.
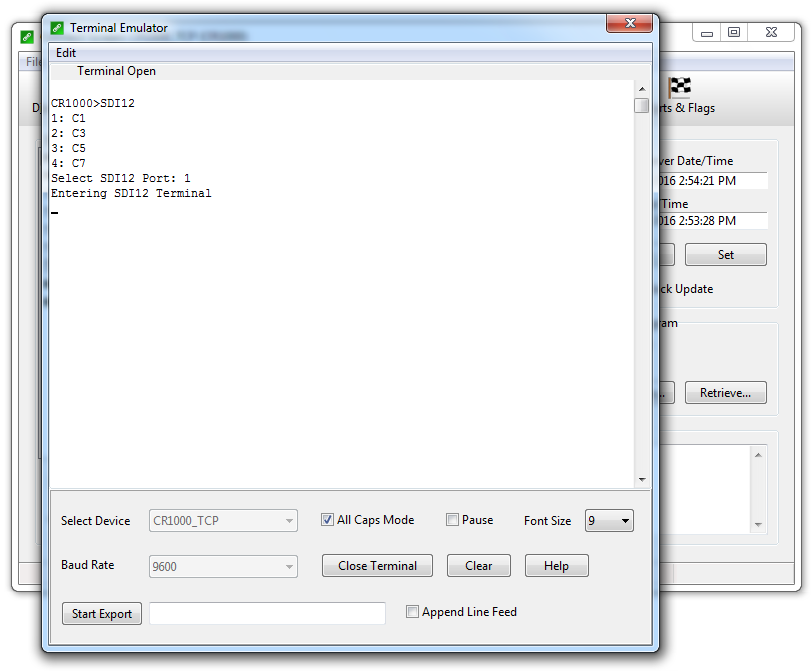
- After the Entering SDI12 Terminal message, enter ?! then press Enter to see the address of the connected sensor (0 in the figure).
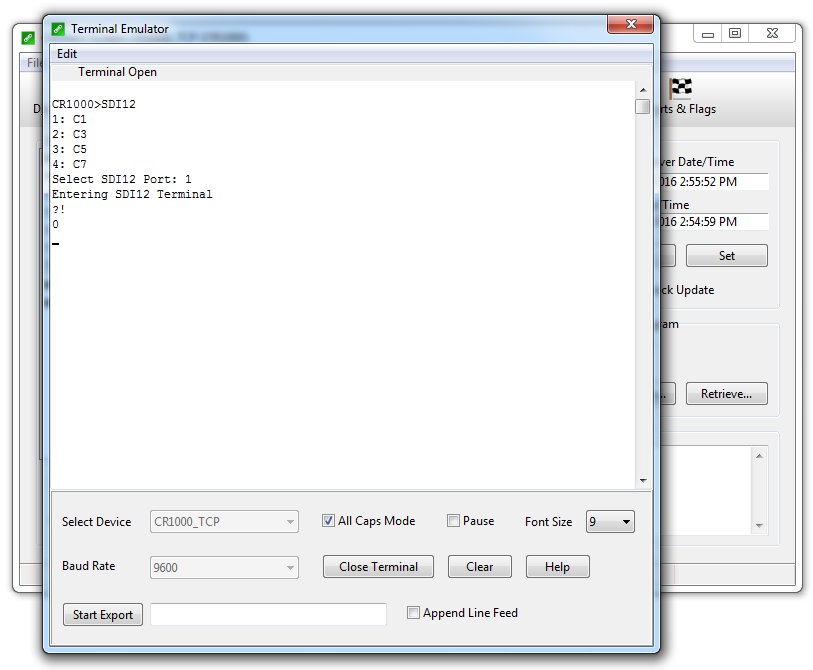
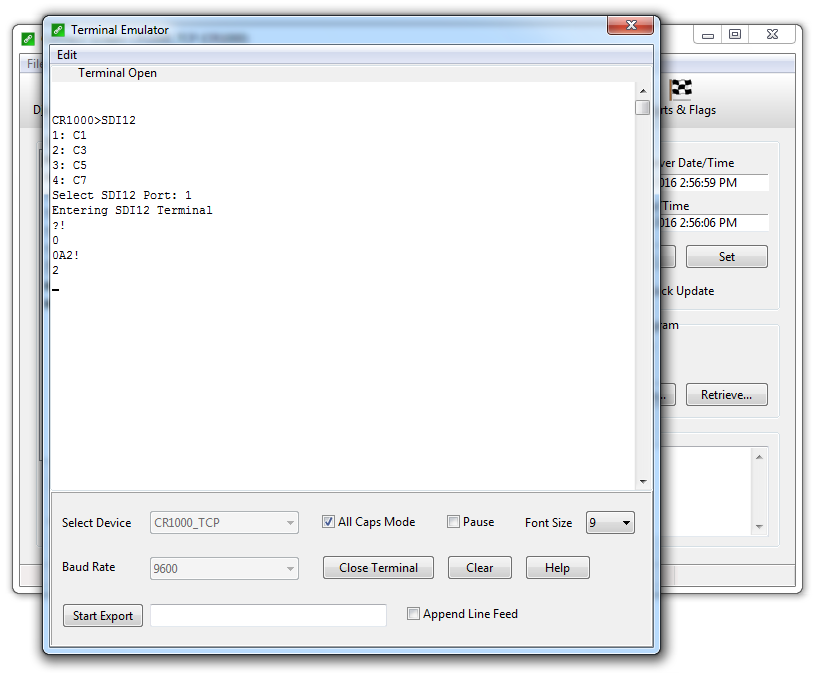
- To set the new address enter the address returned in step 7 followed by A, then the new address followed by !, and press Enter.
- To set a sensor with address 0 to address 2, enter 0A2! as shown in the figure. Once Enter is pressed the sensor will return the new address if it is accepted.
- Disconnect the sensor and repeat steps 1, 7 and 8 for any remaining sensors.
- Note that only one sensor should be connected at a time during this process and that the terminal has a relatively short time out. If it loses connection to the SDI-12 terminal, press Enter a few times to bring up the datalogger prompt and then repeat steps 5 and 6 to re-enter the SDI-12 terminal.
- Once all sensors are addressed, click Close Terminal and exit the terminal emulator.