There are two ways to select a station to view its status:
- Click a station in the Map View, or
- Click a station in the Stations List list.
Either of these actions will take you to a flux station dashboard, where you view broadcasting information.
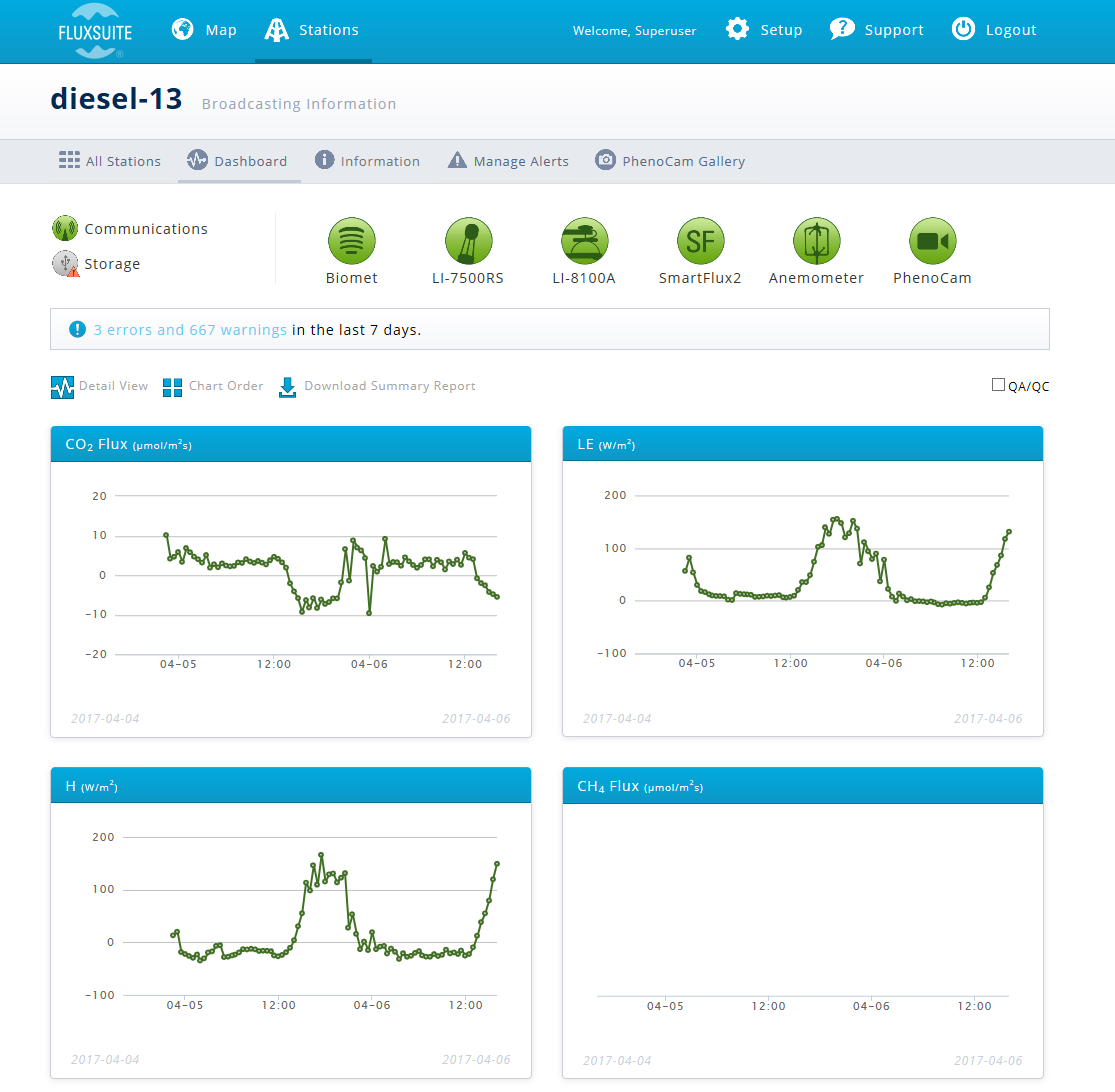
Broadcasting Information
The Broadcasting Information page indicates the status of the EC system components. Green indicates that no alerts have been triggered. Red indicates a warning or error.
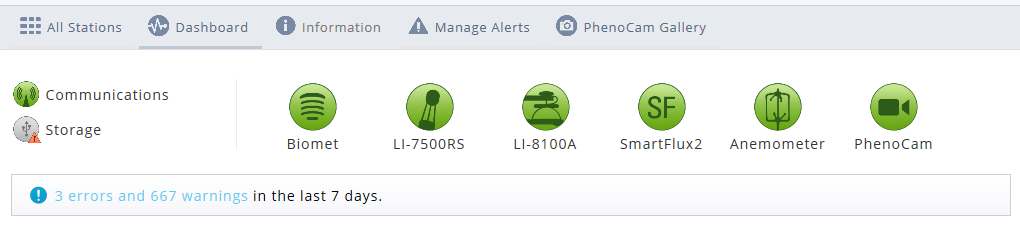
In the Stations Dashboard, you can click an icon for more details about alerts.
| Normal | Warning | Error | Description |
|---|---|---|---|

|

|

|
Warning indicates no communication for 1 hour; Error indicates no communication for 2+ hours. |

|

|

|
Warning indicates free space is below a configurable threshold (default 500MB); Error indicates that the drive is out of space or a GHG file logging error. |

|

|

|
Alerts are configured under Manage Alerts > SmartFlux Alerts. |

|

|

|
Alerts are configured in the SmartFlux System thresholds and LI-7500A/RS alerts section. |

|

|

|
Alerts are configured in the SmartFlux System thresholds and LI-7200/RS alerts section. |

|

|

|
Alerts are configured in the SmartFlux System thresholds. |

|

|

|
Alerts are configured in the SmartFlux System thresholds. |

|

|

|
Alerts are configured under Manage Alerts > LI-8100 Alerts. |

|

|

|
Status indicators show normal, warning, or error, respectively.
Note: Click on each status dot for more information on the status warning.
Below each status indicator is a warning and error message, indicating any alerts that were triggered in the last 7 days. Click the link for a summary of all warnings and errors.
Data
For basic users, the dashboard has a status indicator section and 6 graphs. Indicators show the status of communication, USB data storage, the SmartFlux System, the LI-7500RS, LI-7200, the sonic anemometer, and the Biomet system.
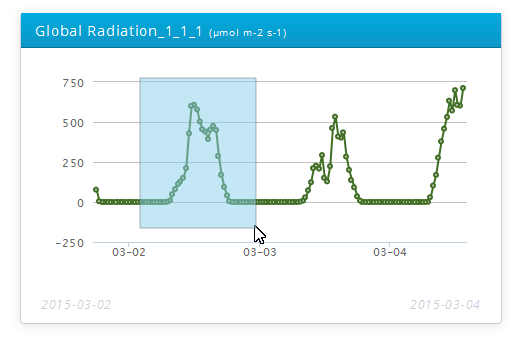
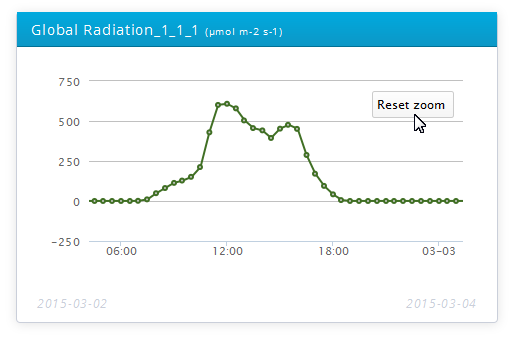
Note: Click and drag to zoom in on a graph.
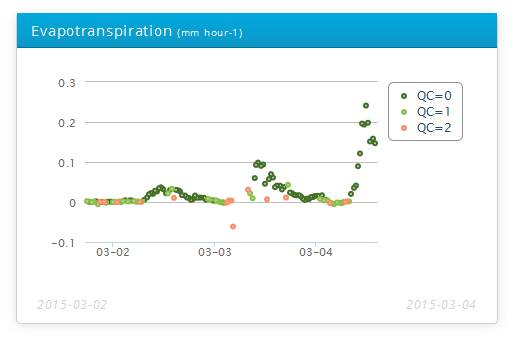
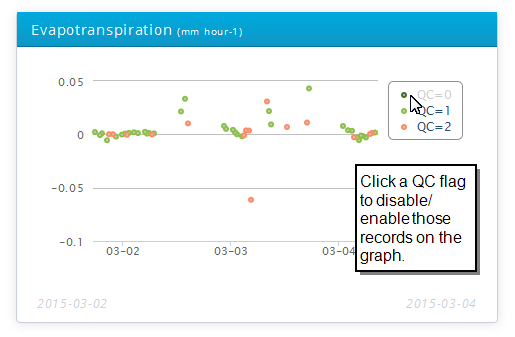
QA/QC Indicators
The Quality Assurance/Quality Control check box ( ) converts the graphs to display the quality flag of each record when checked. When viewing QC/QA mode, you can turn on or off the QC levels by clicking the record.
 indicates OK status.
 indicates note. You should consider checking these data for problems.
 indicates a warning. These data should reviewed and discarded if they are problematic.
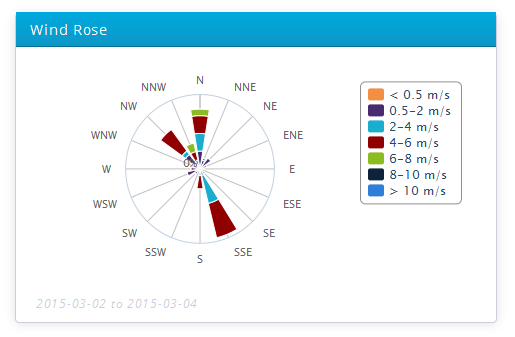
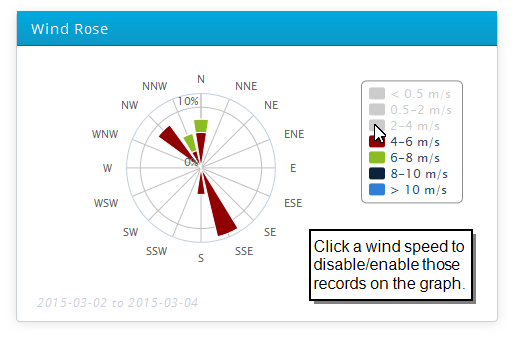
You can also activate/deactivate wind sectors in the wind rose plot.
Detail View
The Detail View ( ) displays a single graph of variables available on the SmartFlux System.
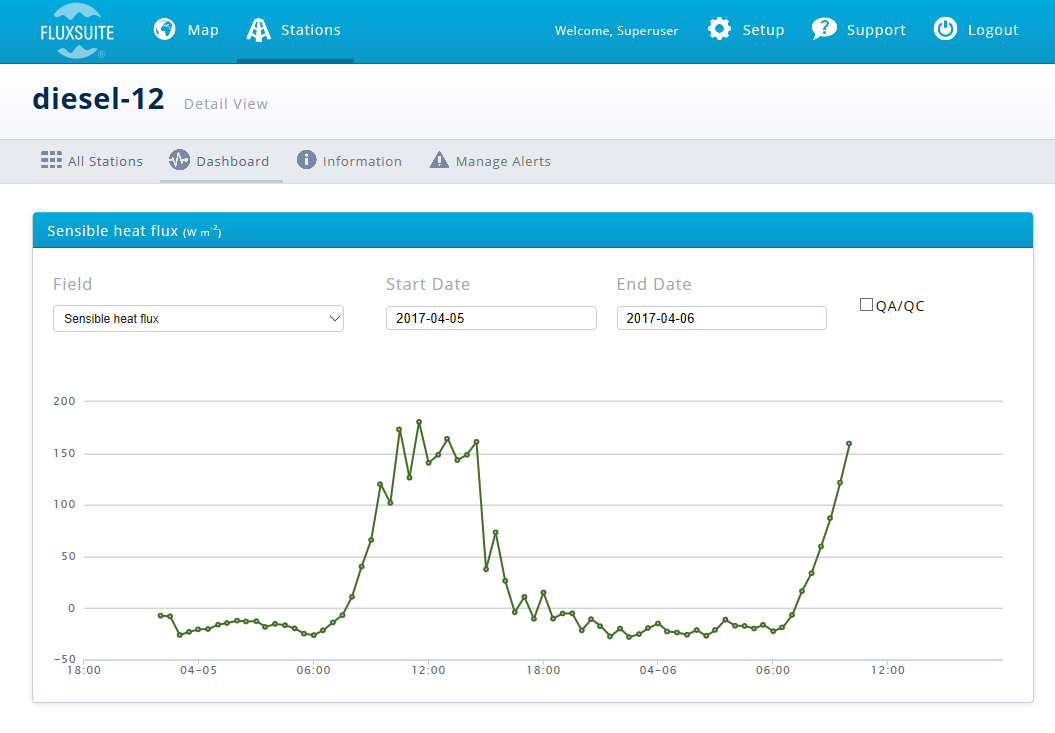
Here you can select a variable (Field) and set the start and end dates. You can also convert the display to show QC flags like those described in QA/QC Indicators.