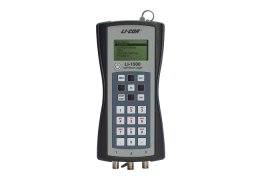
Configuring the LI-1500
This section describes how to configure the LI-1500 to display and log data from LI-COR light sensors.
Creating a basic logging configuration
When powered on for the first time (or any time there is no configuration file), the instrument will prompt you to create a configuration. If your LI-1500 has saved configurations, it will prompt you to select an existing configuration or create a new configuration.
1. Create a new configuration or open an existing configuration
Either enter a name and press OK to create and open a new logging configuration file, or select an existing file and press OK to open it.
2. Configure the logging configuration file
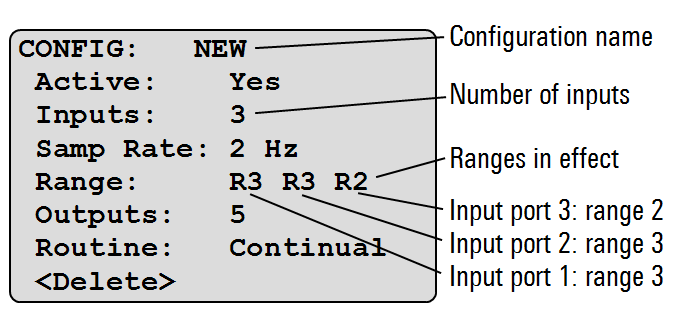
The logging configuration defines what the LI-1500 does while logging.
- Active: Yes or No. If the status is No, select the entry and press OK to change it to Yes.
- Inputs: Select and press OK to specify which inputs (1, 2, or 3) have sensors connected. Select an input. If this is the first time you are connecting a sensor, select <Add New Sensor>. Select a sensor type and press OK. Enter the serial number, multiplier value, and calibration date (see Adding a sensor for details). Press Exit once to save it and again to return to Inputs. Either add more sensors or press Exit again to return to the configuration page.
- Samp Rate: Select and press OK to set the sampling rate. See Changing the sampling rate for details.
- Range: Set to Auto unless a different range is needed. See Selecting a measurement range for details.
- Outputs: Select <add new output>, select Light, and name the output. Review the options and press Exit twice to return to logging configuration. The output can also be a mathematical transformation, prompt, or something else. See Adding an output and Enabling averaging for details.
- Routine: Set to Manual to log manually. See Changing the logging routine for details and options.
Press Exit several times to return to monitor mode. See Creating a configuration for more details.
3. Create a log file
Press the Start | Stop button. Select New File and name the file. When prompted to enter a remark, enter a remark (optional) and press OK to open the file (see Prompts and remarks). Or press Exit to cancel and close the file. If you selected an automatic log routine, logging will begin immediately (or as scheduled) after selecting a log file. See Logging and viewing data.
4. Log a reading
Press the LOG button to manually log a reading.
5. Close the log file
Press the Start | Stop button to stop logging and close the log file. See Viewing and downloading logged data to review and download the data.
Adding a sensor
The LI-1500 Light Sensor Logger is compatible with LI-COR Light Sensors having BNC terminations. Calibration data must be entered for each light sensor. Data for up to 100 sensors can be stored in the memory of the LI-1500.
- Select MENU > Sensors > Add New Sensor and select the model number of your LI-COR light sensor.
- Enter the sensor's serial number (printed on the sensor). Press OK when finished.
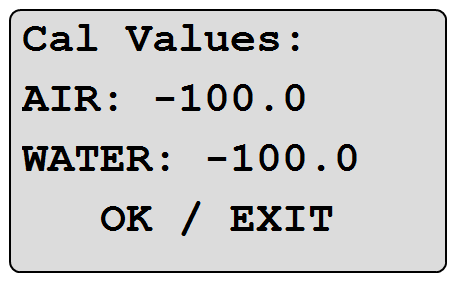
- Select Mult Val (terrestrial sensors) or Mul A/W (underwater sensors) and enter the sensor’s calibration multiplier (use the back arrow
 to delete the existing number). Underwater sensors require both AIR and WATER calibration multipliers. Press OK when finished.
 - Select Cal Date: and use the up and down arrows

 to set the date of the sensor’s last calibration (Year/Month/Date). Press OK when finished.
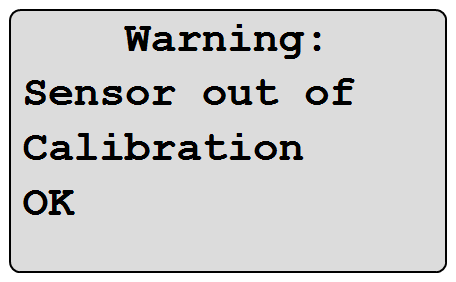
A Sensor out of Calibration warning appears when opening a logging session if more than two years have passed since the date of the sensor's last calibration. This is a reminder to send your sensor back to LI-COR for factory re-calibration. Press OK to continue.
Calibration certificates for LI-COR sensors are available at: licor.com/support/. Enter your sensor's serial number in the Calibration search box. Certificates include the multiplier and the sensor's last calibration date.
Creating a configuration
This section describes how to create and activate a configuration. At least one configuration must be created and made active in order to view and log light readings.
- Select MENU > Configurations > Add New Config.
- Enter a name for the configuration. Press OK when finished.
- Select Inputs, and then select IN1, IN2, or IN3. Attach a LI-COR Light Sensor to the chosen input port.
- For terrestrial sensors, highlight your sensor's serial number, then OK > Exit. If your sensor is not on the list, select Add New Sensor and see Adding a sensor.
- For underwater sensors, select Air, Water, or Prompt On Log, then press OK. This tells the sensor whether to use the AIR or WATER calibration multiplier. Choose Prompt On Log if you want to switch between AIR and WATER multipliers without changing the configuration, or if you want to use both multipliers at the same time with two or three sensors attached (Prompts and remarks).
- Press EXIT. Repeat steps 3–4 to enable a second or third sensor.
- Select Active > Yes. Readings are now visible in Monitor Mode and can be logged.
Changing the logging routine
A logging routine includes settings for when the logging session occurs and how often a sample is logged (logging rate). Logging routines apply to configurations. A logging routine takes effect when a configuration set for that routine is active and a logging file is opened.
Logging rates for automatic routines: Each Sample, 100 msec, 200 msec, 500 msec, 1 sec, 5 sec, 10 sec, 15 sec, 30 sec, 60 sec, 100 sec, 5 min, 15 min, 30 min, 1 hr, 2 hr, 3 hr, 6 hr, 12 hr, 24 hr
Note: The sampling rate must be set at or faster than the desired logging rate. For example, the 1 second logging rate would not be available if the sampling rate is set at 1 sample / 10 seconds). With the sampling rate set at 1 sample / 10 seconds, the shortest time interval you could choose as a logging rate would be every 10 seconds (by choosing Each Sample).
The manual logging routine logs a reading when the LOG key is pressed. Automatic logging routines are continual, daily, or one time.
Select MENU > Configurations and select a configuration from the list. Select Routine, then select a routine type:
- Manual—then press EXIT. Logs a reading each time LOG is pressed.
- Continual—then set a logging rate and press EXIT. Logs automatically while the logging file is open. Close the logging file to stop logging.
- Daily—then set a logging rate, start time, stop time, and press EXIT. Logs automatically during a set time period every day.
- One Time—then set a logging rate, start time/date, stop time/date, and press EXIT. Logs automatically during a single set time period.
The appropriate configuration must be active and a logging file open for a routine to be carried out (Logging data). Leave the power on until the logging routine is finished.
Changing the sampling rate
Sampling rates apply to configurations. A sampling rate takes effect when a configuration set for that sampling rate is active and a logging file is open.
The sampling rate controls how often a data point is taken. For example, a 10 Hz sampling rate indicates 10 samples are taken every second. If averaging is enabled, the number displayed or logged is the continuous moving average of samples taken during the chosen averaging window.
Example: With a sampling rate of 1 Hz and an averaging window of 30 seconds, the data point displayed or logged would be the average of the instantaneous data points for seconds 1 through 30. Every second thereafter, the average is updated based on the previous 30 seconds. With a manual logging routine, the light sensor would need to be in place for at least 30 seconds after the logging session is initiated before you press the LOG Key. The average from the previous 30 seconds would be logged.
Standard modes
Sampling rates: 1 per hour, 1 per minute, 1 per 10 seconds (0.1 Hz), 1 Hz, 2 Hz, 5 Hz, 10 Hz, 20 Hz.
In the standard sampling modes, up to three input ports can be sampled at once, and averaging is supported.
- Select MENU > Configurations and select a configuration from the list.
- Select Samp Rate and select a sampling rate from the list.
Note: The sampling rate must be set at 1 Hz or less in order to log GPS data.
Raw mode
Sampling rates: 1–500 Hz in whole number increments.
Raw Mode sampling permits the user to choose any whole number from 1 through 500 Hz as the sampling rate. Raw Mode sampling is useful for logging rapid changes such as the flicker rate of fluorescent, iridescent, incandescent, and LED light bulbs.
In Raw Mode, the active configuration settings and outputs are disregarded and the following settings are automatically applied:
- Input: Only INPUT1 is sampled.
- Output: Only one output is produced.
- Logging routine: Continual and every sample is logged.
- Averaging is not available.
- GPS data cannot be included inside records.
- Autoranging is not available (see Selecting a measurement range).
These are the steps for Raw Mode sampling:
- Select MENU > Configurations and select a configuration from the list.
- Select Samp Rate.
- Select Raw Mode from the bottom of the list and select Yes when asked whether to continue.
- Enter the desired sampling rate: A whole number from 1 through 500 Hz.
- Select Sensor to choose a light sensor for raw mode sampling and make sure this sensor is attached to input 1.
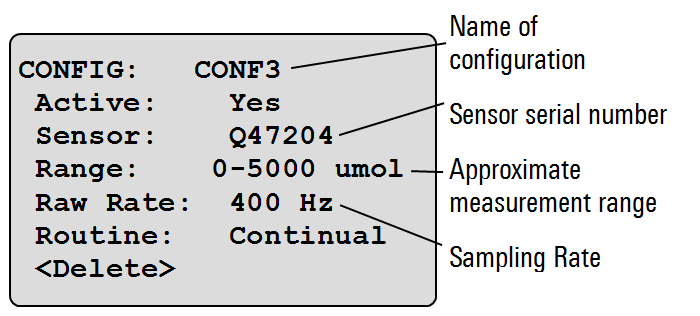
- In Raw Mode, you can change settings (sensor, range, or sampling rate) by selecting the desired line on the configuration screen (Figure 3‑1). To change the Raw Mode sampling rate, select Raw Rate > *Raw Mode, then enter a sampling rate and press OK. To exit Raw Mode, Select Raw Rate and select a standard sampling rate from the list.
Sampling rate and measurement range
With Standard Modes sampling and a total sampling rate across all three input ports set to 3 Hz or less, the LI-1500 chooses a measurement range automatically based on light levels detected (autoranging). For example, when using one input port the sampling rate needs to be ≤ 3 Hz for autoranging to be active. When using two or three input ports at once, the sampling rate needs to be ≤ 1 Hz on each port for autoranging to be active.
For Raw Mode sampling or when the total Standard Modes sampling rate is greater than 3 Hz, an approximate measurement range must be selected (or the default range will be in effect). See Selecting a measurement range.
Selecting a measurement range
Normally, the LI-1500 automatically selects a measurement range based on light levels detected (autoranging). However, you must select an approximate measurement range (or use the default) in the following two cases:
- When using Raw Mode sampling
- When using Standard Modes sampling, but the total sampling rate for all three input ports is greater than 3 Hz
Approximate measurement ranges available for each sensor type are shown in Table 3‑1. When autoranging is not possible, the LI-1500 chooses range 3 (R3) by default. To achieve the highest resolution possible, use Table 3‑1 to determine which range is best for your application. Range 4 (R4) is available for applications requiring the largest signal range.
Tip: Light levels listed in Table 3‑1 are approximate, based on the average output for each sensor type. Individual sensors will vary, so experimentation may be needed. For example, if you choose range 3 for a terrestrial quantum sensor because the measurement is expected to fall between 4000 and 5000 µmol s-1 m-2 and it turns out range 3 will not allow a measurement over 4000 µmol s-1 m-2 with this individual sensor, you will need to choose the next higher range (R4).
Use the following steps to change the measurement range:
- Select MENU > Configurations.
- Select a configuration to modify.
- Select Range.
- For Raw Mode sampling, select a measurement range. For Standard Modes sampling, first select an input port, then select a measurement range for the sensor connected to that input port.
Adding an output
An output takes data from light sensors, battery voltage, GPS, prompt entries, or another output and creates a separate data set that can be viewed in monitor mode or logged. The LI-1500 will support up to six Light outputs, 15 Math outputs, and three Prompt outputs in each configuration.
- Select MENU > Configurations and select a configuration from the list.
- Select Outputs > Add New Output. Select an output type:
- Light: Enter a name for the output. Select Sensor. Select Input 1,Input 2, or Input 3 as the data source. Select Averaging to set an averaging window (Enabling averaging).
- Math: Enter a name for the output. Select Operation, then see step 3 under Configuring a math output to configure the operation type.
- Prompt: Enter name for the output. Select Type. Highlight the Full Alphanumeric or Numeric Only entry type, then press OK > EXIT. During manual logging, a Prompt output asks for a different data entry into each record when LOG is pressed. For continuous or automatic logging, a prompt output asks for an entry when the logging file is first opened. That same entry is then added into each record (Prompts and remarks).
- Battery: Logs battery voltage in an output named "Battery".
- GPS: Logs all of the GPS variables in an output named "GPS". GPS must also be enabled (Select MENU > Console Setup > GPS > Enabled).
Configuring a math output
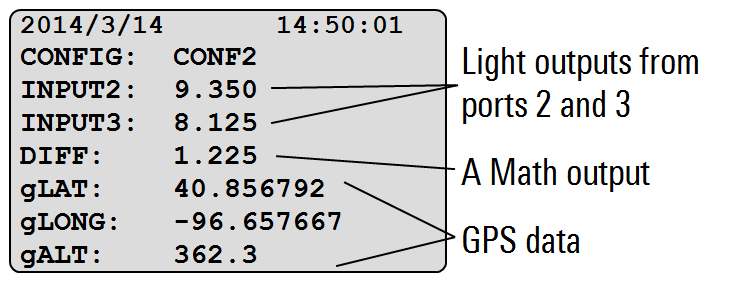
DIFF is displaying the real-time result of subtracting INPUT3 from INPUT2.A Math output performs an arithmetic operation on selected data (parameters) and reports the result.
- Select MENU > Configurations and select a configuration from the list.
- Select Outputs and select a math output from the list or see Adding an output to add a new Math output.
- Select Operation and select an operation type:
- Addition—Set parameters
- Subtraction—Set parameters
- Multiplication—Set parameters
- Division—Set parameters
- Integration—Select Param and select a Light output from the list. Select Duration and use the up and down arrow keys to set the length of time in hours and minutes. The integration period starts when the logging file is opened.
- Daily Integral—Select Param and select a Light output from the list. Set the start and stop time for the integration period by setting up a Daily routine for the active configuration (Changing the logging routine).
- Attenuation—Select Param A and select a Light output from the list. Select Param B and select another Light output from the list. Select Separation and enter the separation distance – the distance between the two underwater light sensors (see Measuring underwater attenuation).
- Logarithm—Natural Logarithm, Ln()—Set a parameter
- Select Param to set parameters. A parameter is a numeric constant or a pre-existing output to which the operation is applied.
- Press EXIT to return to the Outputs screen.
Example: Select the Addition operation type and the Output parameter type. Choose INPUT1 and INPUT2 as parameters. Readings generated by INPUT1 and INPUT2 will be added together in the new output.
Enabling averaging
Averaging is applied to outputs. A specific averaging window takes effect for a particular output.
The averaging function is useful for applications where the signal to be measured is very small, or where the maximum possible resolution is desired. Setting a longer averaging window increases resolution since more samples are used to compute the average. The averaging function is often used when light measurements are taken under water or with changing cloud cover.
- Select MENU > Configurations and select a configuration from the list.
- Select Outputs and select a Light output from the list or add a new Light output (see Adding an output).
- Select Averaging and select an averaging window from the list.
- Select Min/Max > Yes to include minimum and maximum values in the output. Then press EXIT twice.
Averaging window and min/max
The averaging window is the time period over which sampled numbers are averaged. The sampling rate affects what averaging windows are available (Table 3‑2).
The average reported is the moving average. This means the average is updated with every sample and the averaging window moves with every sample, creating a series of overlapping windows. Minimum and maximum values, however, are calculated based on non-overlapping windows.
Example: With an averaging window of 15 seconds, the minimum and maximum is updated every 15 seconds. With a sampling rate of 1 Hz (1 sample per second) and a 15-second averaging window, two different minimums and two different maximums would be reported during a 30-second logging session.
Note: When averaging is enabled for an output and a logging session is initiated (by pressing START|STOP), the output will not display or log data until time has elapsed equal to the averaging window (e.g. 15 seconds if the averaging window is set for 15 seconds). This includes minimum and maximum values if enabled. Any records logged from the output before the first averaging window has elapsed will not contain valid readings.
Sampling rate and averaging
The sampling rate controls how often a data point is taken. For example, a 10 Hz sampling rate indicates 10 samples are taken every second. If averaging is enabled, the number displayed or logged is the continuous moving average of samples taken during the chosen averaging window.
Example: With a sampling rate of 1 Hz and an averaging window of 30 seconds, the data point displayed or logged would be the average of the instantaneous data points for seconds 1 through 30. Every second thereafter, the average is updated based on the previous 30 seconds. With a manual logging routine, the light sensor would need to be in place for at least 30 seconds after the logging session is initiated before you press the LOG Key. The average from the previous 30 seconds would be logged.
Measuring underwater attenuation
With two LI-192 Underwater Quantum Sensors connected to the LI-1500—each placed at different depths—you can measure the vertical attenuation (also known as the extinction coefficient) of light underwater. Set up the LI-1500 using the following steps:
- Create a configuration including the two LI-192 sensors and make this configuration active (Creating a configuration).
- Add a Math output (Adding an output).
- Select Attenuation as the operation type (Configuring a math output).
- Select the LI-192 sensor outputs as the two parameters.
- For separation distance, use the vertical distance between the two sensors in meters.
The Math output reports the vertical attenuation coefficient in m-1.
Note: The LI-COR 2009S Lowering Frame can hold only one LI-192 sensor for measuring downwelling radiation.
Underwater attenuation theory
The Attenuation operation type uses the following equation:
3‑1

Where Kd is the vertical attenuation coefficient in m-1, 1 and 2 are the sensors (1 is the upper sensor), z is the physical separation between sensors (meters), and E1 and E2 are the readings from the sensors (units do not matter as long as they are the same).
50/60 noise filter
When enabled, the 50/60 Hz noise filter will filter out undesirable signals from external devices with a frequency of 50 or 60 Hz (cycles per second). In the United States, most electrical devices cycle at 60 Hz, while the mains frequency in Europe and other 230 volt areas is 50 Hz.
Select MENU > Console Setup > 50/60 Noise Filter and select Enabled or Disabled. The default setting is Disabled.
Note: When the 50/60 Noise Filter is enabled, only one input can be active, and the sampling rate must set at 1, 2, 5, or 10 Hz in the configuration.