Logging and viewing data
Logging data
Data are logged based on the active configuration.
- To view the list of configurations, select MENU > Configurations.
- The active configuration is marked with an asterisk (*). To make a different configuration active, highlight the desired configuration, then press OK three times. Press EXIT three times to return to Monitor Mode.
- From the Monitor Mode screen, press the START | STOP key on the keypad.
- Select New File (enter a name) or Existing File (select from the list).
- Enter a session remark or press OK.
- The logging file is now open.
- The trigger for logging depends on the logging routine chosen (Changing the logging routine):
-
- Manual: press LOG to record the current data for all outputs.
- Continual
- Daily
- One Time
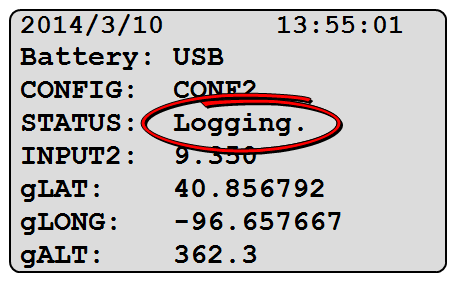
- The STATUS line in Monitor Mode indicates Logging when a logging routine is running.
- A dot (.) flashes at the end of the STATUS line while data are being recorded (see Figure 4‑1).
- Press START | STOP to close the logging file.
Caution: Leave the power on and the logging file open until the logging routine is finished. The LI-1500 will not turn itself on for Daily or One Time routines.
Prompts and remarks
You will be given the option to enter a remark each time you open a logging file. Press the period key (.) to enter additional remarks while the logging file is open. These remarks are time-stamped when you press OK. Automatic logging continues uninterrupted.
Prompts are enabled by adding a Prompt output to the active configuration Adding an output). During manual logging, a Prompt output asks for a different data entry into each record when LOG is pressed. For continuous or automatic logging, a prompt output asks for an entry when the logging file is first opened. That same entry is then added into each record.
With a prompt, data are inserted into the same record as the sensor data. Prompt data and sensor data appear on the same line in a spreadsheet. A remark, on the other hand, is inserted into its own record and appears as its own line in a spreadsheet. Prompts allow data to be added by the user, while remarks are a way of annotating data if needed.
Underwater sensor logging
When logging data from an underwater sensor, the configuration can be set for Air, Water, or Prompt On Log (Creating a configuration).
With Air, the "in-air" calibration multiplier is used. With Water, the "in water" calibration multiplier is used. These multipliers are entered when you add a sensor to the memory of the LI-1500 (Adding a sensor).
Prompt on Log
Prompt on Log allows you to switch between "in air" and "in water" measurements without changing the configuration. It also allows both "in air" and "in water" measurements at the same time with two or three underwater sensors attached to the LI-1500.
With Prompt on Log enabled, you will be asked to choose between the Air or Water multiplier for each attached underwater sensor. Press OK after highlighting your choice. This request is made at the following times:
- Each time you begin a logging session
- Each time you press the zero (0) key during a logging session
- Each time you press the LOG key during a manual logging session
Caution: Your choice of Air or Water will always be applied to the next reading, not the reading that happened the moment you pressed LOG
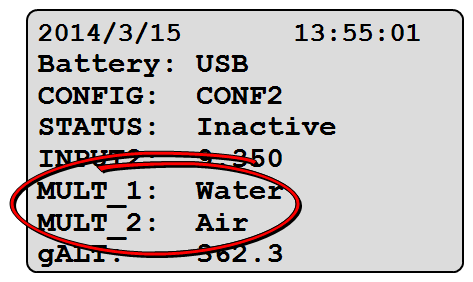
With one or more underwater sensors attached, a variable available in Monitor Mode (Monitor mode navigation) indicates which multiplier is currently in effect (Air or Water). The variable is labeled MULT_1, MULT_2, or MULT_3, corresponding to the input port number. See Figure 4‑2 for an example with two underwater sensors attached.
GPS tagging
- Add the GPS output to the active configuration (see Adding an output).
- Press a numbered key (1–9) to record current GPS data in a separate record during a logging session.
Example: Mark the corners of "Plot 1" by pressing the "1" key at each corner of Plot 1 and then mark the corners of "Plot 2" by pressing the "2" key at each corner of Plot 2 — all during the same logging session.
Viewing and downloading logged data
Logged data are stored in files that can be opened on the LI-1500 console or on a computer. Data from multiple logging sessions may be stored in a single file.
On the console
- Select MENU > Data > Files. Select a logging file from the list.
- Select View and select a logging session from the list.
- Select Session Info to view session metadata such as the configuration name, software version, any remarks, number of records, and the time/date when the logging file was opened for this session.
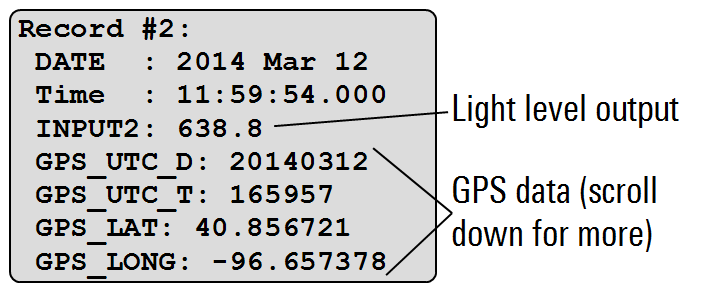
- Select Records and select an individual record to view date and time, any prompt entries, the light level for each output, computed values, battery voltage, and GPS data (if enabled).
On a computer
You can transfer data files to a computer over the USB connection.
- Connect the LI-1500 to your computer with the USB cable. It will appear as a mass storage drive named LI-1500.
- Open the DATA folder in the LI-1500 drive, locate the desired logging file, and drag or copy it to a directory on your computer.
- Open the logging file in a spreadsheet application on your computer.
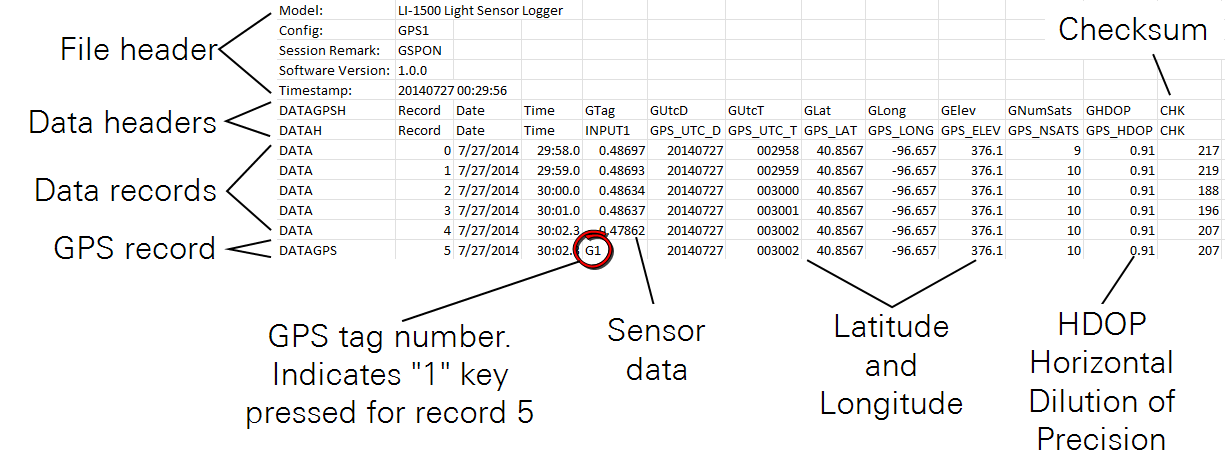
- Logging files are tab delimited, ASCII text files with the .txt ending. Some column widths may need to be adjusted for a full view of the data (see Figure 4‑4).
Note: Initially, hours may not be visible in the timestamps for data records viewed in a spreadsheet application (see data records in Figure 4‑4). Change the cell format for the Time column in order to view the time properly.
Raw Mode Data
Data logged with Raw Mode sampling can be viewed with a spreadsheet (as described above) or with LI-COR's FV7x00 software for Windows. This software was designed for high speed gas analyzers, but also works well for graphing large data sets taken at high sampling rates with the LI-1500.
To view raw mode data with the File Viewer:
- Download the FV7x00 software at licor.com/support/
- Click on LI-1500 and then Software. Click on File Viewer Software FV7x00 to install the file viewer software on your computer.
- Drag and drop your data file onto the FV7x00 window or click the "+" at the bottom left corner of the FV7x00 screen.
- Click on the Variables tab, then click on a record.
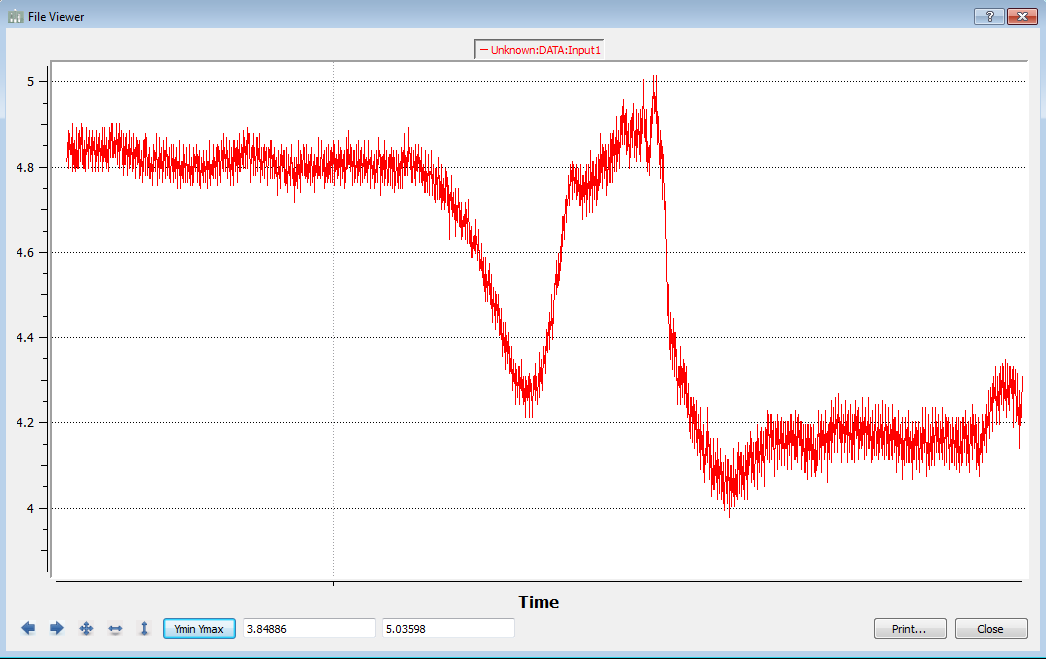
- Hold down your left mouse key and draw a box around a portion of the graph to zoom in on a graph (Figure 4‑5).
- Hover the cursor over the graph to see individual readings and time.
Viewing real-time data
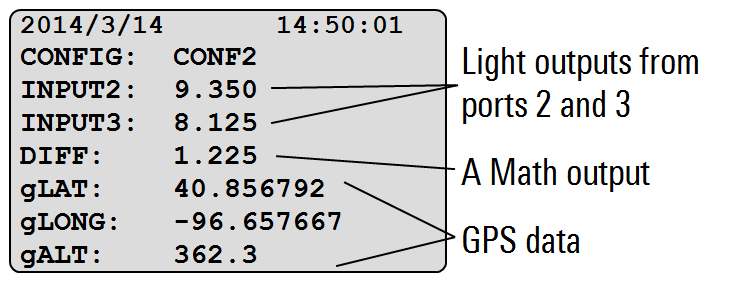
DIFF is displaying the result of subtracting INPUT3 from INPUT2.In Monitor Mode (Monitor mode navigation), the LI-1500 can be used as a handheld meter for viewing real-time light level data. If the Global Positioning System (GPS) is enabled and a satellite connection is available (Overview of GPS), GPS data can also be viewed in Monitor Mode.
- Make sure a configuration is active and sensors are attached to the correct input ports.
- Use the up and down arrows to highlight any line in monitor mode.
- Use the left and right arrows to toggle between any available variables, including any active outputs showing real-time light or GPS readings.