
Software
Configuring OPEN for Soil Measurements
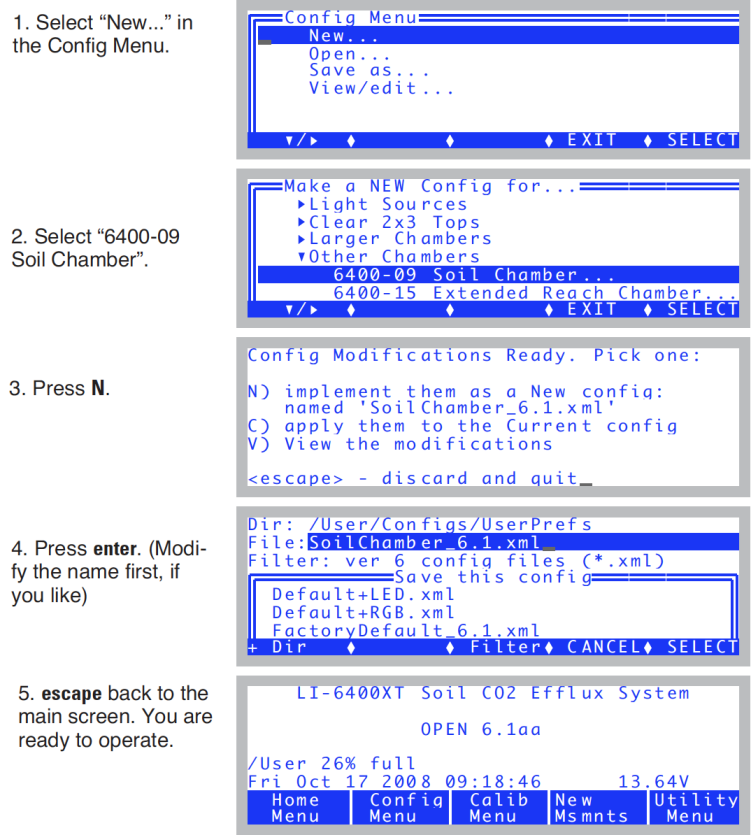
To make soil CO2 flux measurements, a configuration file must first be created. After that, anytime you wish to use the soil chamber, select this configuration file from the list of configurations presented at power up, or when you change configurations (Config Menu -> Open...).
Creating a Soil Chamber Configuration
Follow the steps in Figure 28‑18.
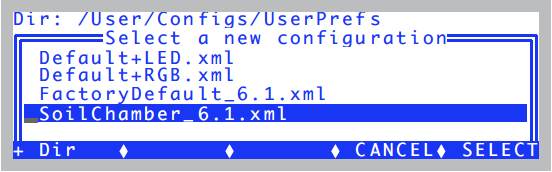
Selecting An Existing Soil Chamber Configuration
Once a soil chamber configuration has been created, you can select it from the list of configurations that are presented at power up, or when “Open...” is selected from the Config Menu (Figure 28‑19).
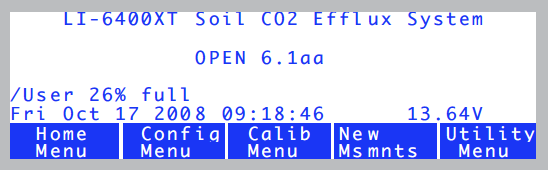
OPEN’s Main Screen
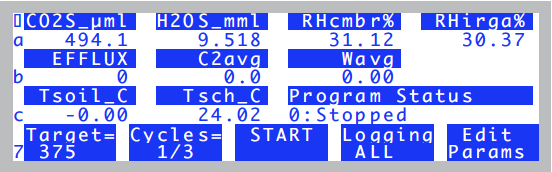
When configured for soil flux measurements, OPEN’s Main Screen appears as in Figure 28‑20. The only change from normal is the title.
The Calibration Menu
While configured for soil flux measurements, the flow meter and reference IRGA are not used, so the Calibration Menu is slightly changed (Figure 28‑21).
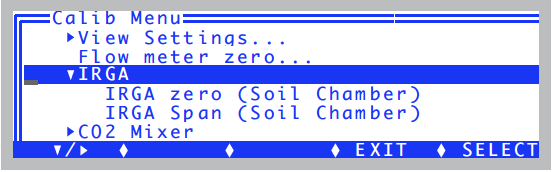
Also, the zeroing and spanning routines are a bit different, and some replumbing is necessary. This is explained later in IRGA Calibration.
New Measurement Mode
New Measurements mode has some new variables and function keys.
The function keys are described below, and the new variables are discussed in Table 28‑2.
Function Keys
Figure 28‑23 shows the function keys in New Measurements while configured for soil CO2 flux. The important group of keys is on level 7.
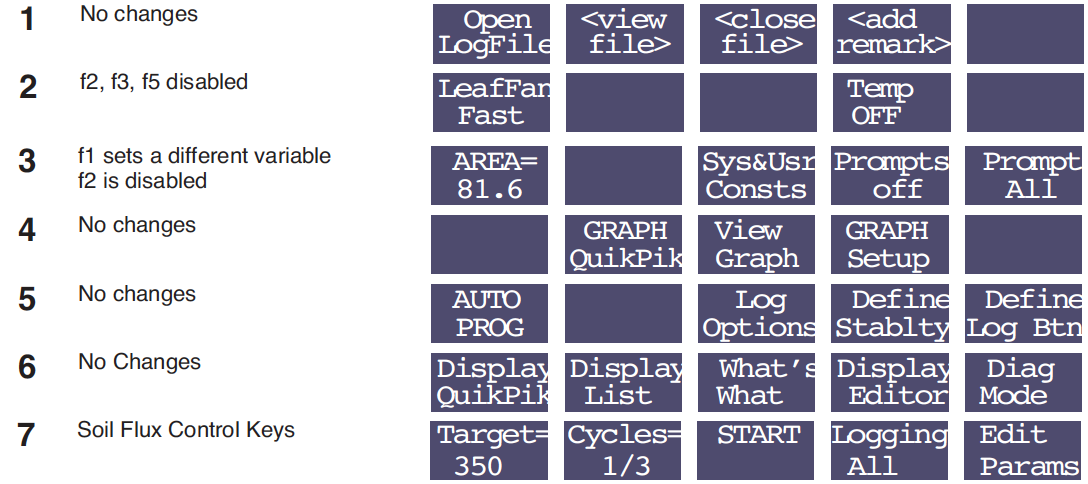
The following function keys are new - or have different meanings - for the soil configuration:
Target= (f1 level 7,). Sets Target and Delta. The target is the CO2 concentration at which you want the measurement taken, and the delta defines the operating window around that target. For example, if you specify a target of 360 ppm and a delta of 20 ppm, the measurement will occur while the CO2 rises from 340 to 380 ppm. Once above 380 ppm, the pump will pull the CO2 back down to 340 ppm (minus any extra draw down ddMargin) for another cycle).
Cycles= (f2 level 7). Sets NumCycls, the number of repetitions to perform. The key label shows the current repetition number, and the maximum number of repetitions (e.g. 1/3 is the first of three).
START (f3 level 7). Starts/stops the measurement cycle. (While a measurement is in progress, the label will be Stop.) If no log file is open when Start is pressed, you will be prompted for one. If a file is open, you will be prompted “Append to the current log file? (Y/N)”. If you respond N, you are prompted for a new log file name.
It is possible to do a measurement without logging to any file. Simply press escape when asked for the file name, and press N for the subsequent prompt “Log to COMM port? (Y/N)”. (The other way to accomplish this is to turn off logging, as described next.)
Logging… (f4 level 7). Selects what is stored in the log file (if a log file is open) during a measurement. The dialog box is shown in Figure 28‑24.
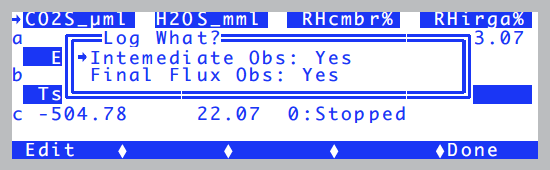
During the measurement cycle, the LI-6400 computes an intermediate observation (Mode = 3) every 2 seconds (see #310 in Table 28‑2). This observation includes a CO2 efflux value based on a rate of change of CO2 with time over the previous 10 seconds, which corresponds to 20 samples. (For versions 3.x and 4.x, it is 10 samples over 7.5 seconds.) In addition to the rate of change of CO2, the intermediate observation includes the mean CO2 for that interval. At the end of the cycle, when CO2 has reached the upper limit (Target + Delta), a final result (Mode = 4) record is computed by regressing the rates of change of CO2 (dc’/dt) against the mean CO2 concentration (C2avg), and computing the CO2 efflux rate (EFFLUX) appropriate for the target concentration. Typically, you only need to store the final result record (option 2), but the other options are available.
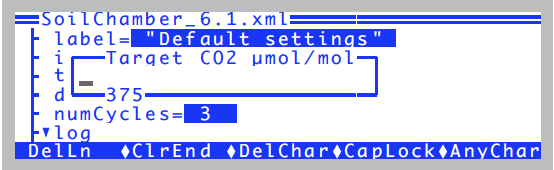
Edit Params (f5 level 7).This key provides access to all the soil flux parameters, and allows them to be viewed, edited, stored and retrieved (Figure 28‑25).
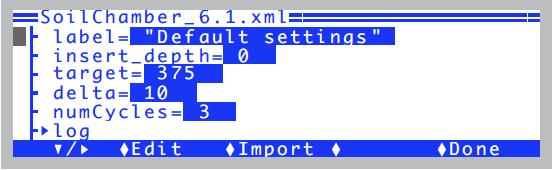
The entire list looks like this:
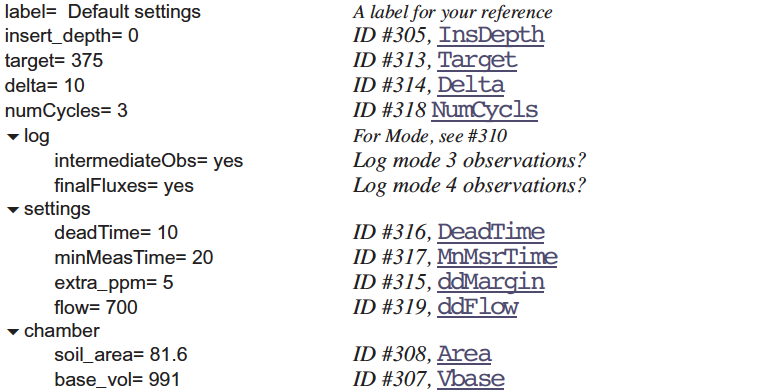
To edit any of the parameters, place the cursor on that line, and press f2 (Edit).
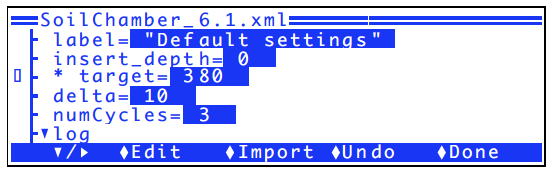
If the value of any setting is different from its value as last stored with the configuration file, it appears with an asterisk (Figure 28‑27).
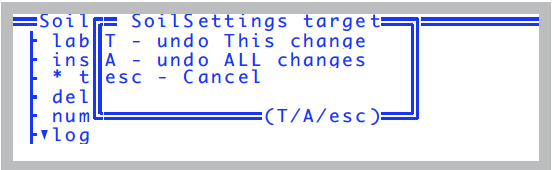
The Undo key (f4) allows any or all un-stored values to be reverted back to their stored condition (Figure 28‑28).
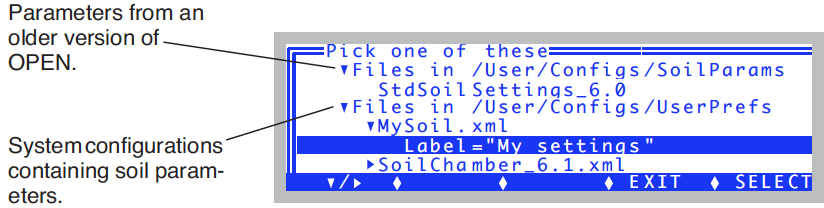
The Import key (f3) allows soil settings to be imported from any stored configuration file that has them, or from soil config files that may exist from older versions, if you’ve upgraded from OPEN 6.0.x (Figure 28‑29).
Display Map
The default soil configuration has the display arranged as shown in Table 28‑1.
User Variables
The soil CO2 flux configuration makes use of a compute list file named “/User/Configs/Comps/Soil Efflux Eqns.LPL”, which defines a number of user variables and constants (Table 28‑2).
| ID # | Label | Description | How to Change1 | LPL variable name | |
|---|---|---|---|---|---|
| 5.2 and up | 5.1 and bleow | ||||
| 300 | dC/ct | Mode=3: Rate of change of CO2 Mode=4: Meaningless (last Mode=3 value) |
co2Slope | ||
| 301 | dW/dt | Mode=3: Rate of change of H2O
Mode=4: Meaningless (last Mode=3 value) |
h2oSlope | ||
| 302 | C2avg | Mode=3: Average CO2 Mode=4: The target CO2. |
co2Mean | ||
| 303 | Wavg | Mode=3: Average H2O
Mode=4: Meaningless (last Mode=3 value) |
h2oMean | ||
| 304 | Vtot | Total Volume (including IRGA), computed by the software: Vtot = Vbase - Area * InsDepth |
soilChamSysVol | ||
| 305 | InsDepth | Insertion depth (cm). Distance from chamber edge to the top of the soil surface. | f5 level 7 | f5 level 7 | soilInsDepth |
| 306 | dc’/dt | Mode=3: Dilution corrected CO2 density Mode=4: Dilution corrected density regressed to target concentration. |
dcdt | ||
| 307 | Vbase | Volume (cm3) at 0 depth. Includes IRGA. | f5 level 7 | Note2 | soilChamBaseVol |
| 308 | Area | Soil area (cm2) | f1 level 3 f5 level 7 | soilArea | |
| 310 | Mode | 0 - Measurement not active
1 - Pump is on, drawing CO2 down 2 - Pump off, waiting to start. (CO2 still too low) 3 - Computing intermediate observations 4 - Final result |
opMode | ||
| 311 | Smpls | Mode=3: Number of samples used in the intermediate observation that was logged.
Mode=4: Number of intermediate observations of dc’/dt used for the final regression. |
numSamps | ||
| 312 | Program Status | Mode=0: "0:Stopped"
Mode=1: "1. Pumping Down" Mode=2: "2:Waiting to start" Mode=3: "3:Measuring" Mode=4: "4:Compute Final" |
srState | ||
| 313 | Target | Target CO2 μmol/mol. Computations and logging are performed while the CO2 is rising from Target - Delta to Target + Delta. | f1 level 7 f5 level 7 | f1 level 7 | targetCO2 |
| 314 | Delta CO2 | Delta μmol/mol. | deltaCO2 | ||
| 315 | ddMargin | Extra Drawdown (ppm). Mode 1 (drawdown) ends when the CO2 concentration drops below Target - Delta - ddMargin. | f5 level 7 | f2 level 3 | ddSafetyMargin |
| 316 | DeadTime | Dead Time (secs). Minimum time between when the pump turns off, and when measurements begin. | postPumpDeadSecs | ||
| 317 | MnMsrTime | Min Measure Time (secs). Minimum length of the Mode 3 part of a measurement. | minMeasureTime | ||
| 318 | NumCycls | Number of cycles to do. 1 cycle is drawdown (Mode=1) through final result (Mode=4). | f2 level 7
f5 level 7 |
f2 level 7 | numCycles |
| 319 | ddFlow | Flow during draw down (Mode=1). | f5 level 7 | f2 level 3 | ddFlow |
| 320 | EFFLUX | Mode=3: Flux for intermediate observation Mode=4: Flux for final result. |
soilEfflux | ||
| 321 | RHcmbr% | Relative humidity in the soil chamber | rhsc | ||
| 322 | Tsoil_C | Temperature of the external soil probe | tSoil | ||
| 323 | RHirga% | Relative humidity in the IRGA | rhOut | ||
| 324 | Tsch_C | Air temperature in the soil chamber. | tLeaf_c | ||
| 330 | R(C)m | Mode=3: Meaningless
Mode=4: Slope of dc’/dt vs. C2avg |
dcdtSlope | ||
| 331 | R(c)b | Mode=3: Meaningless
Mode=4: Intercept of dc’/dt vs. C2avg. |
dcdtOffset | ||