Measuring PI response using a program
Although you can record a photosynthesis irradiance curve manually — entering irradiance setpoints, waiting for stability, and pressing the log button to record each measurement — a better approach is to let the instrument operate the controls, timing, and data logging programmatically based on criteria that you set. In this tutorial, we describe how to do that with an existing Program. In this exercise, you are using the fluorometer as a basic light source (Start Up > Chamber set up > Fluorometer functions as: Light source only).
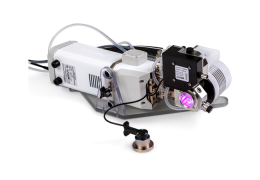
- Prepare the chamber.
- Do the things relevant to you in Preparing for measurements.
- Remove the pre-equilibrated media from the chamber and load 15 mL of newly re-suspended algae sample into the chamber. Install the chamber top plug.
- Install the light sensor aperture on chamber to ensure that the sample is in dark conditions. Let the sample acclimate to the darkness.
- While it acclimates, match the IRGAs. Tap Match IRGAs > Auto to initiate the automatic match. Review the adjustments and close the Matching screen.
- Open a log file or create a new one.
- Under the Programs tab, select Light_Response.
- Modify the Qin values and time to wait for stability.
- Qin: 0, 30, 75, 150, 250, 500, 750, 1000, 1250
- Min. wait: 480 seconds
- Max. wait: 480 seconds
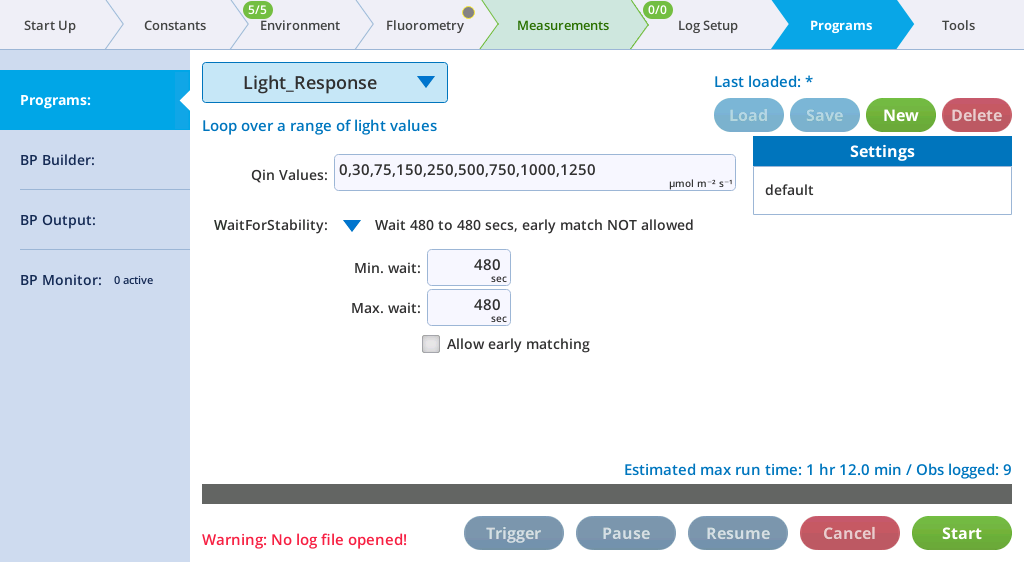
- The instrument will follow the order entered. In this example the Qin levels are going from low to high. You can go in any order. The minimum and maximum wait times of 480 seconds specify that each measurement is recorded after 480 seconds (8 minutes). The instrument will summarize the program at the lower right. In this configuration, the run time is 1 hour 12 minutes, during which the program will log 9 observations.
- Save the Program.
- Enter the sample constants.
- Under Constants > Gas Exchange, enter the sample volume, cell density, chlorophyll density, or mass density. These parameters will be adjusted later, so don't worry if they are inexact at this time.
- On the Programs tab, tap Start to initiate the program.
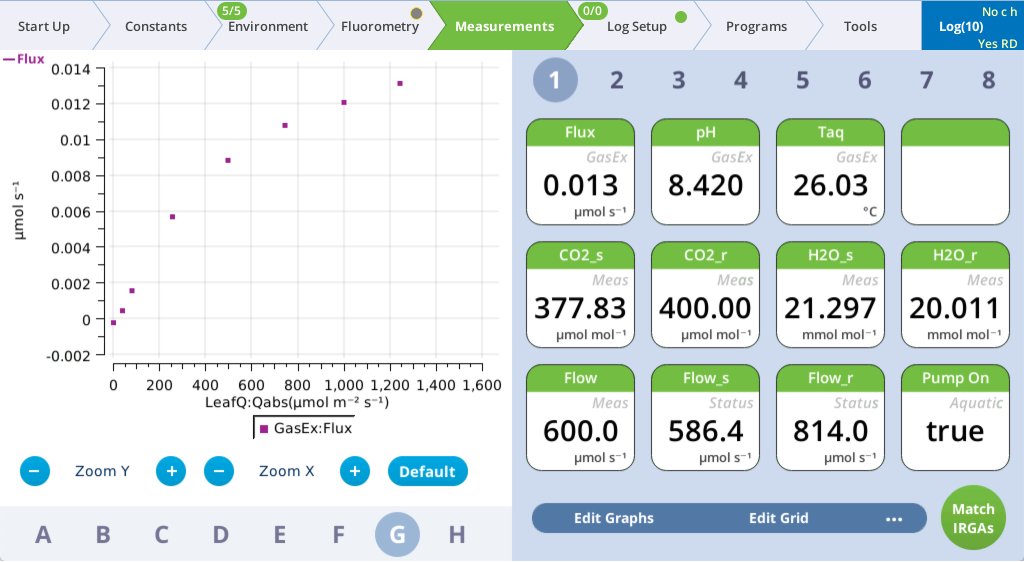
- You can observe the measurements as the program proceeds.
- Review chart G. It is configured to show the flux (µmol s-1) vs. irradiance (µmol m-2 s-1).
- After the measurement is complete, measure cell density and the chlorophyll density from the sample in the chamber.
- Transfer the Excel version of the log file from the instrument (see Transferring files to a computer).
- In the Excel file, identify columns for the cell density (Dcell), chlorophyll density (Dchl), and mass density (Dmass). Enter these parameters into the columns. The Excel file maintains the photosynthesis equations; the final flux results will be recomputed automatically when these parameters are entered.