
Fluorometer events file structure
The addition of custom flash events has caused some minor changes to the fluorometer event file structure. These changes will not impact most users, except those who analyze event files with their own software.
Listing 8‑3 shows a VERSION 5 .json file for a standard rectangular flash. The red sections depend on event type. All event types now have a copy of the state of the fluorescence computation group (FLR) appended to it (green section). The FLR numbers reflect whatever computations (including matching adjustments) that were triggered by that event. For example, if the event were triggered by a log that included matching, then the FLR values will reflect the final computations at the completion of the match (i.e., A_dark or A_fs will include that match adjustment). In the case of a flash with dark pulse log (resulting in two event files, unless they were combined in a custom event), then the FLR values in both files will be identical.
MPF and INDUCTION type files (and CUSTOM events that have MPF computations (+p1, +p2, +p3) or fast kinetic computations (+fk) will also have appended to them the state of the MPF group and/or FastKntcs group.
When MPF, FastKntcs, and FLR groups are included in event files, they are added with their own table structure. In other words, the value entry for FLR is not a single value, but a separate value:key table (e.g. Python dictionary, C++ map, etc.). In the example below, the FLR table is shown on separate lines for readability, but in the actual .json files, the FLR is not separated into separate lines. This is of no concern, however, if your software reads the file as .json and not as a simple text file.
Listing 8‑3. A standard rectangular flash. The red highlighted sections will change with event TYPE.
{
"EVENT_ID":628,
"DEVICE":"MPF-551000",
"DATE":"20220711",
"TIME":"11:19:38",
"TIMESTAMP":1657556378.6,
"TYPE":"RECT",
"OUTRATE":100, This section depends of the flash TYPE
"MARGIN":5,
"DURATION":800,
"Q_RED_SETPOINT":12000,
"D_RED_PERCENT":90,
"MODRATE":250000,
"DC_SECS_OFFSET":5.6e-07, See Fluorometry timing details
"AC_SECS_OFFSET":-1.44e-06, See Fluorometry timing details
"PFD_SECS_OFFSET":1.33e-06, See Fluorometry timing details
"FLASH_SECS_OFFSET":-2.25e-06, See Fluorometry timing details
"SECS":[-0.04000175, -0.03000175, -0.02000175, ..., Relative time (s)
"FLUOR":[1346.83, 1355.88, 1357.69, ..., Modulated (AC) fluorescence
"DC":[1070.89, 1077.75, 1079.17, 1079.27, ..., DC fluorescence
"PFD":[124.202, 124.211, 124.206, ..., Photon Flux Density (Q) mol m-2 s-1
"RED":[84.7424, 84.7505, 84.7456, 84.7419, ..., Qr mol m-2 s-1
"REDMODAVG":[30.0601, 30.0601, 30.0601, ..., Qm peak mol m-2 s-1
"FARRED":[0, 0, 0, 0, 0, 0, 0, 0, 0, 0, 0, 0, 0, ..., Qd mol m-2 s-1
"CODE":[2, 2, 2, 2, 2, 3, 3, 3, 3, 3, 3, 3, 3, ..., Step code numbers
"Tled":45.312, LED tile temperature (C) at time of flash
"Pre_Qin":99.9377, Pre-flash PFD (LeafQ:Qin) mol m-2 s-1
"Pre_Qabs":84.23, Pre-flash LeafQ:Qabs mol m-2 s-1
"Pre_Q_red":85.43, Pre-flash FlrLS:Q red mol m-2 s-1
"Pre_Q_blue":9.5, Pre-flash FlrLS:Q blue mol m-2 s-1
"Pre_Q_farred":0.0, Pre-flash FlrLS:Q farred mol m-2 s-1
"Pre_Favg":1155.817, Pre-flash FlrStats:F avg
"Pre_dFdt":-3.5539215322752034, Pre-flash FlrStats:dF/dt
"VERSION":4, This file format
"Starts":[0, 5, 85], Indicies that start a step
"Stops":[4, 84, 89], Indicies that end a step
"T_OFFSET":0.04499975, This section depends of the flash TYPE / meta commands
"Dspk_indices":[0, 5, 85],
"Dspk_values":[1130.92, 3074.12, 2937.76],
"FMAX":3809.72,
"T@FMAX":0.38500025,
"QMAX":12359.5,
"Fs":1155.8,
"FLR:DarkAdaptedID":"RECT-621-20220710-20_20_54", The state of the FLR group after this event
"FLR:Qmax_d":12456.6,
"FLR:Fo":798.0884705882354,
"FLR:Fm":966.81,
"FLR:Fv/Fm":0.17451363702461142,
"FLR:A_dark":0.0006241274473727851,
"FLR:LightAdaptedID":"RECT-628-20220711-11_19_40",
"FLR:Qmax":12359.5,
"FLR:Fs":1155.8176470588237,
"FLR:Fm'":3809.72,
"FLR:PhiPS2":0.696613492052218,
"FLR:PS2/1":0.5,
"FLR:Qabs_fs":84.23269098717378,
"FLR:A_fs":-0.0013443312108192432,
"FLR:ETR":29.33881450676526,
"FLR:PhiCO2":-2.3369295639525135e-05,
"FLR:NPQ":-0.7462254443896139,
"FLR:alt._Fo'":2078.349590362122,
"FLR:DarkPulseID":"-",
"FLR:Fmin":0,
"FLR:Fo'":2078.349590362122,
"FLR:Fv'/Fm'":0.4544613277715627,
"FLR:qP":1.5328333776342227,
"FLR:qN":2.5576326967119765,
"FLR:qP_Fo":0.8812174819605304,
"FLR:qN_Fo":-16.849716867264068,
"FLR:qL":2.756285674133975,
"FLR:1-qL":-1.756285674133975
}
Table 8‑21 shows header entries that are to be found for each of the 6 event types. CUSTOM event headers only have TYPE in common with the other headers; everything else (meta through Q_modred_setpoint) are the values that define the event's behavior and computations. See Custom event definition files for details.
Table 8‑22 shows the computational entries associated with each event type. A CUSTOM event is capable of any of them, and it is determined by the string of commands found in the meta header line. See Meta commands for details.
CUSTOM flashes can also perform user-defined computations, which lead to entries in the computations section not shown in Table 8‑22. See Meta commands.
Fluorometry timing details
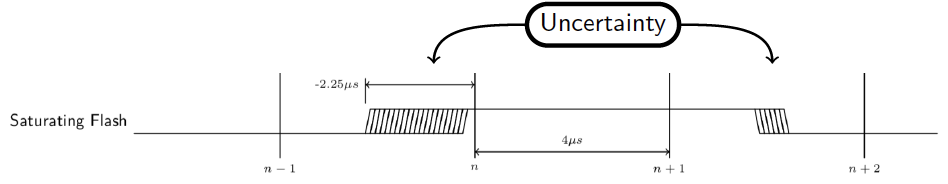
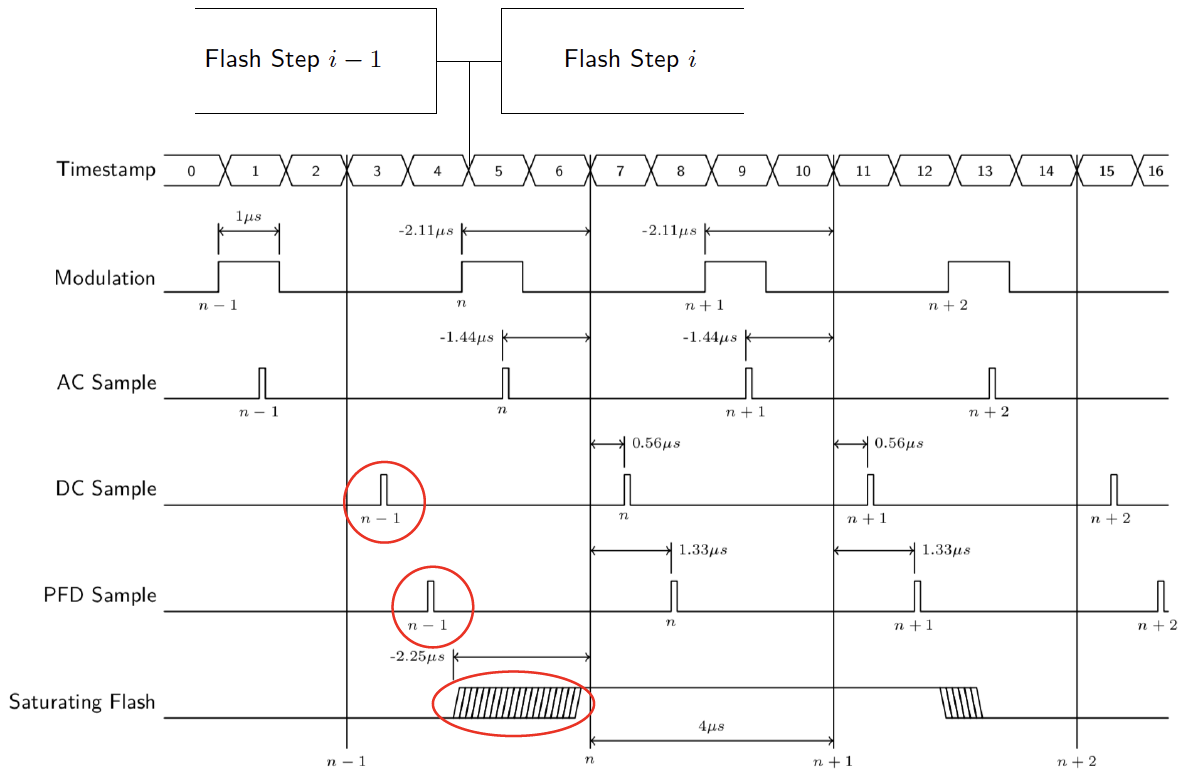
The relative timing of the modulation, various measurements, and actinic change (Saturating Flash) is shown in (Figure 8‑97).
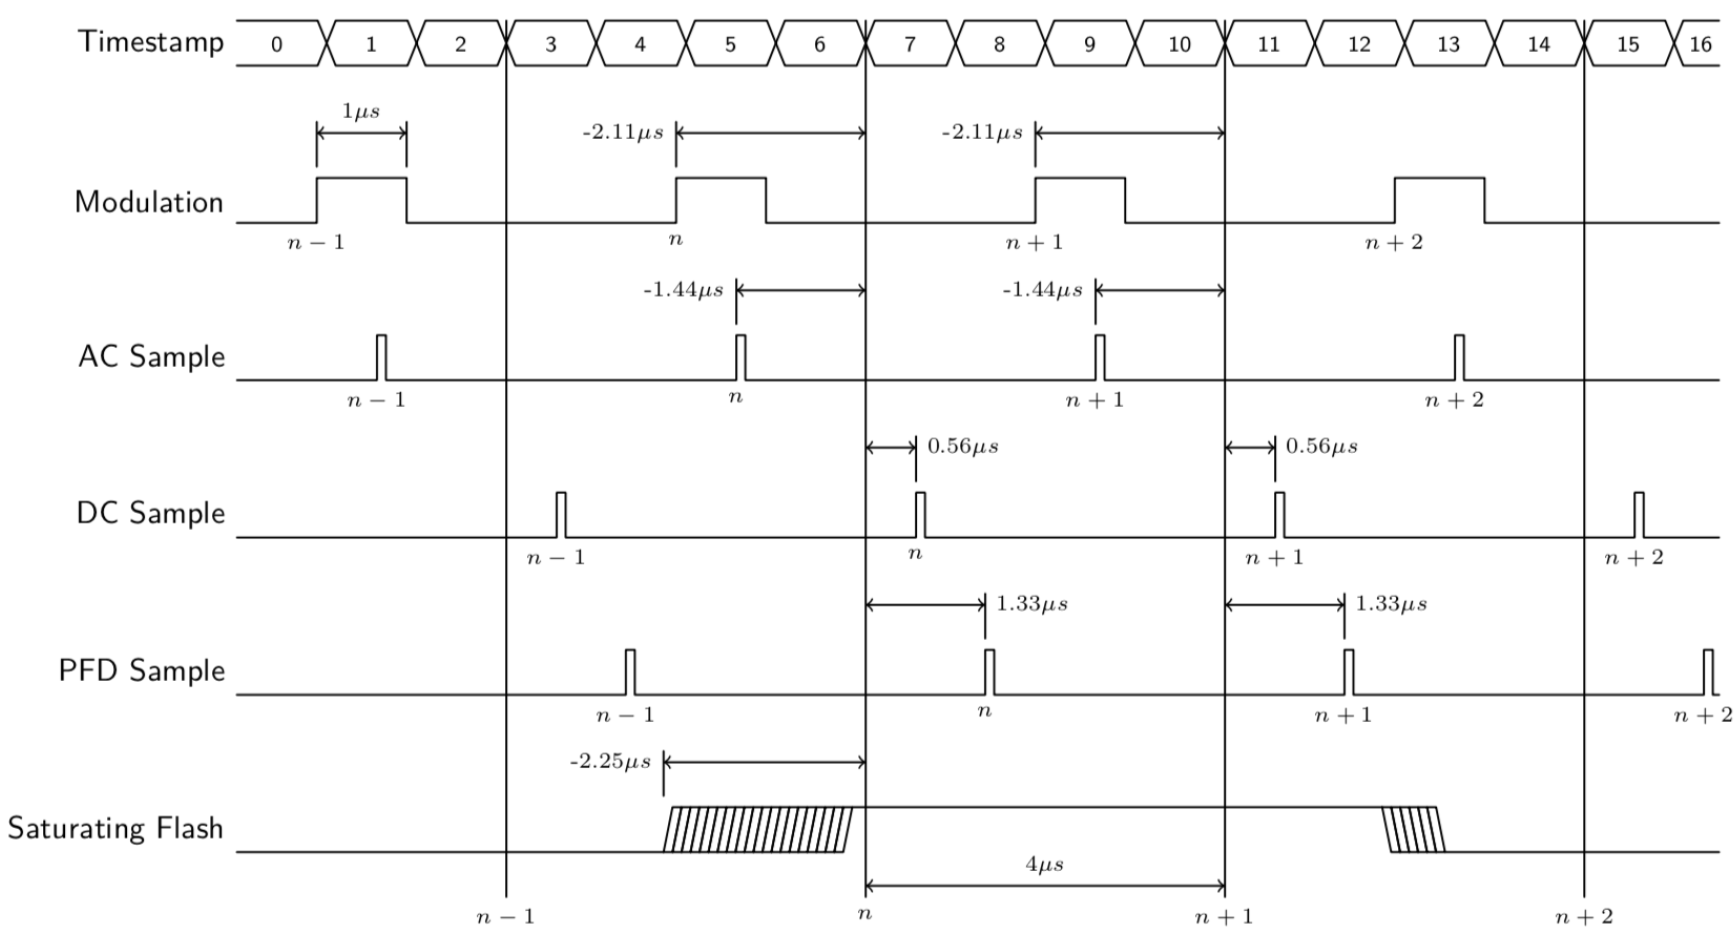
The vertical lines marked n − 1, n, etc. represent data output at a common time stamp. The measurements made associated with that stamp differ slightly from the actual time stamp by small amounts. For example, the PFD (actinic) measurement is made 1.33 µs after the reported time, while the modulated fluorescence is measured 1.44 µs prior to the reported time. These offset values appear in each flash event file, so any firmware updates that change timing will be documented in the fluorometer's output (Listing 8‑4).
Listing 8‑4. Timing information.
{
"EVENT_ID":308,
"DEVICE":"MPF-551000",
"DATE":"20211005",
"TIME":"15:03:15",
"TIMESTAMP":1633464195.5,
:
"DC_SECS_OFFSET":5.6e-07,
"AC_SECS_OFFSET":-1.44e-06,
"PFD_SECS_OFFSET":1.33e-06,
"FLASH_SECS_OFFSET":-2.25e-06,
"SECS":[-0.04000175, -0.03000175, ..., 0.63999825, 0.64999825],
"FLUOR":[1346.83, 1355.88, 1357.69, 1357.92, ..., 1559.26],
:
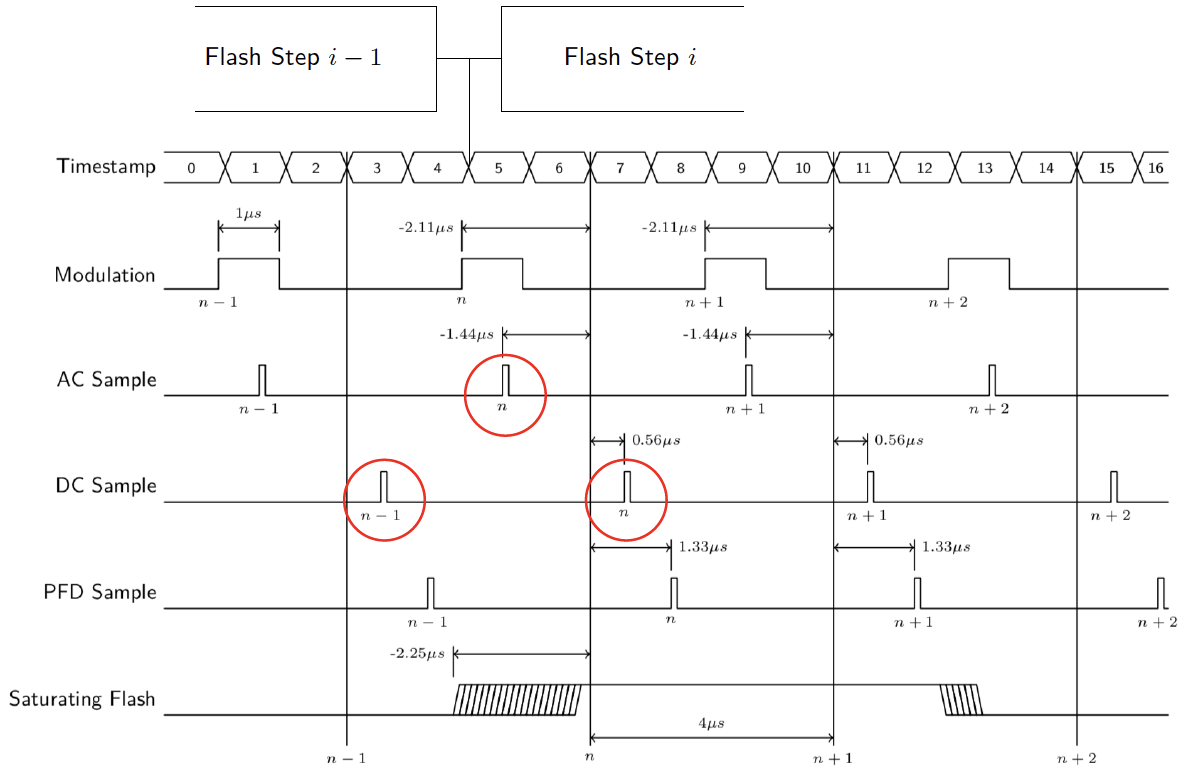
Timing and flash steps
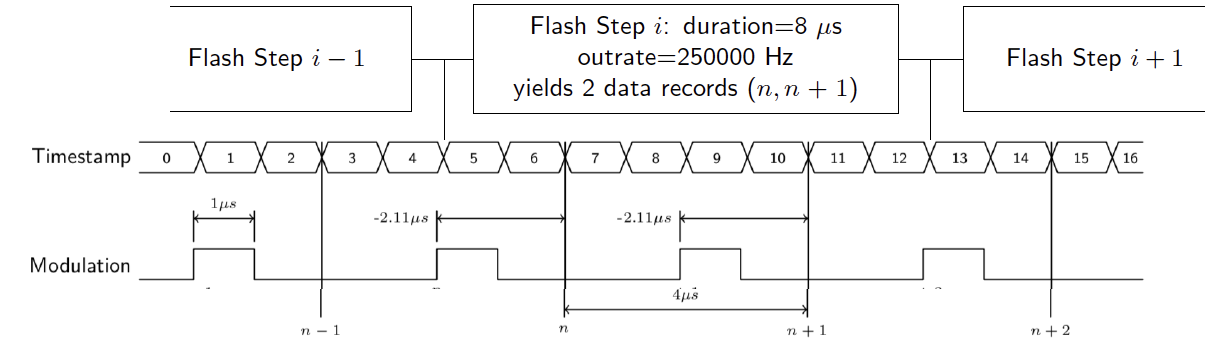
To relate Figure 8‑97 to when custom flash steps start and stop, note the following: a step's beginning or ending does not correspond to the vertical n lines. Rather, steps start and stop at times that correspond to the rising edge of the modulation pulse. Also, step duration times (if non-zero) are not allowed to be shorter than the modulation period, guaranteeing one data point.
Figure 8‑98 illustrates with a step that lasts 8 µs.
Computing AC fluorescence
The LI-6800 fluorometer measures DC fluorescence, and computes modulated (AC) fluorescence from it (Figure 8‑99). The AC and DC sample lines in the diagram represent measurements of the same signal (DC), but the AC values occur when the modulation pulse is on, and the DC values when it is off.
Modulated fluorescence Fn at time n, is computed from
8‑29

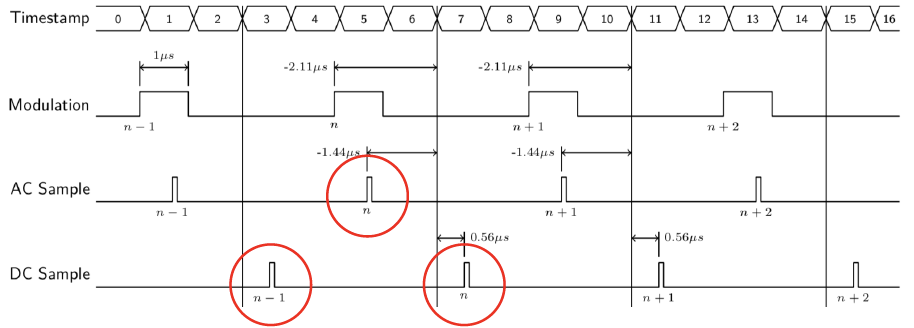
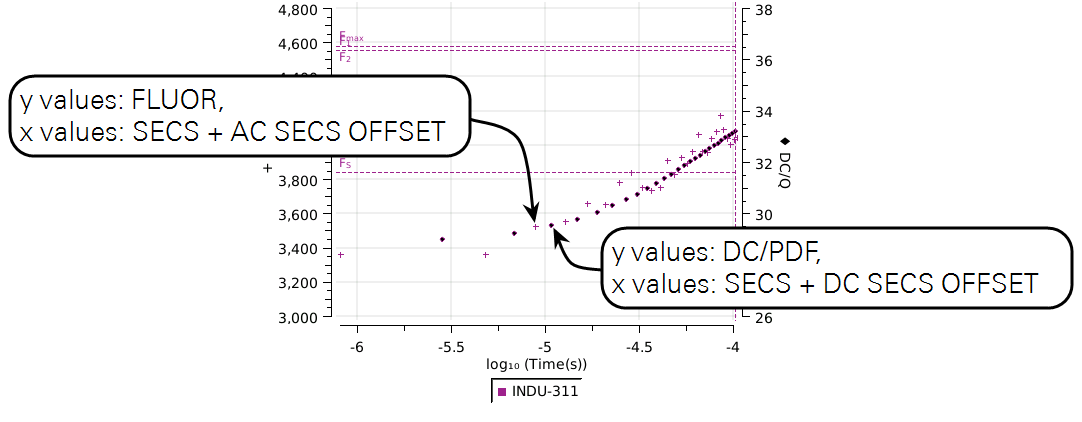
When plotting flash time series data taken at lower output rates, time offsets between AC and DC are inconsequential. However, when plotting data measured at the highest output rate, the AC and DC adjustments are necessary to accurately plot the data. Figure 8‑100 illustrates.
Time adjust to start of flash
Standard flashes, and custom flashes that use the +tadj command, adjust the SECS vector so 0 is the best estimate of the start of the flash.
This calculation uses the time to of the first code specified by the +tadj command (e.g., time of the first code=3), the modulation rate fm, data output rate fd, and the estimated flash offset tf (FLASH_SECS_OFFSET in the file).
The total time adjustment time tΔ required is
8‑30

where td is the delay between the start of a step and the first output record.

There is relative uncertainty about tf , however, as the exact value depends on starting and ending actinic values.
Here's how this plays out in an INDUCTION file with data spaced every 4 µs, and having 5 margin points (code=2), followed by the flash data (code=3). The original SECS data, as received from the fluorometer, would look like this
SECS:[0, 4.0e-06, 8.0e-06, 1.2e-05, 1.6e-05, 2.0e-05, ...]
CODE:[2, 2, 2, 2, 2, 3, ...]
The flash happened between the 5th and 6th data point. A +tadj 3 will compute an adjustment time (tΔ) using the time of the first code 3 value (2.0e-05) and the FLASH_SECS_OFFSET (-2.25e-05). Since fm and fd are the same at the start of an induction flash, equation 8‑31 becomes
8‑32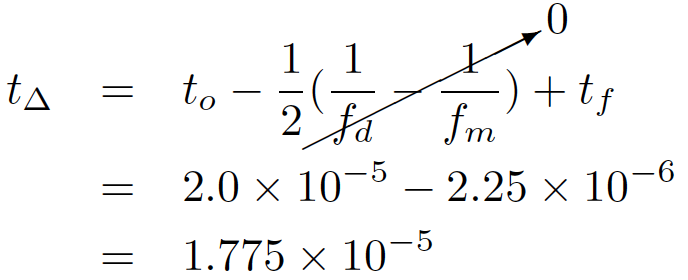
and the final form of the event files looks like this:
Listing 8‑5. +tadj 3 uses FLASH_SECS_OFFSET and the time of the first code 3 data to compute T_OFFSET and subtract it from all elements in the SECS vector.
{
"EVENT_ID":309,
"DEVICE":"MPF-551000",
"DATE":"20220613",
"TIME":"10:46:07",
"TIMESTAMP":1655135167.1,
:
"FLASH_SECS_OFFSET":-2.25e-06,
:
"SECS":[-1.775e-05, -1.375e-05, -9.75e-06, 6.25e-06 ... ],
:
"CODE":[2, 2, 2, 2, 2, 3, 3, ...]
:
"T_OFFSET":1.775e-05,
:
}
Despiking modulated fluorescence
The interaction between the AC fluorescence computation and flash step timing is shown in Figure 8‑102. Note that if a large change in actinic (e.g., saturating flash) happens in step i, the first value of AC fluorescence associated with step i (time step n) will be based on three measurements that straddle the actinic change, rendering that computation meaningless.
When despiking is enabled (+dspk Meta command), the potentially erroneous modulated fluorescence value at time n is replaced with the average of the n - 1 and n + 1 values.
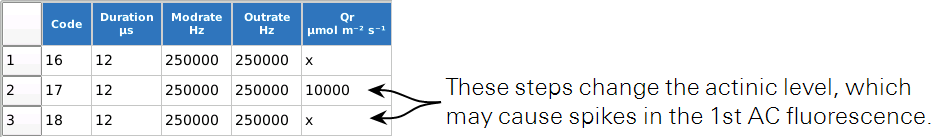
Spiking is easily illustrated with a simple custom flash program that has despiking turned off, shown below.
Computing DC/Q
When analyzing a flash and considering the DC fluorescence, it is common to use DC/Q, that is, the DC signal normalized by the actinic light Q. Note the following:
- Even though actinic is sampled with the modulating beam off (
PFD Samplein the timing diagrams), when the fluorometer reports PFD (whether in a flash or not), it adds in the average modulated intensity (reported asREDMODAVG). This accounts for the modulated beams contribution to the total intensity. However, when we computeDC/Q, the Q value does not want to include the modulated beam's contribution, because it is not there whenDCis measured. Therefore, when normalizingDC, we subtract theREDMODAVGvalue from the PFD value. - When
outrateis at or close tomodrate, the last data record of a step can show slightly anomalous values ofDC/Q, and Figure 8‑104 illustrates why. In the last step of a flash (n− 1 in the figure below), theDCsample occurs before the actinic change for the next step. The PFD sample, however, may catch the actinic in transition.
To insure this behavior does not produce spurious DC/Q values for the last record of a step, we substitute the n − 2 value of PFD for the n − 1 value, before doing the computation.
| CODE | 16 (Qr = x) | 17 (Qr = 10000) | 18 (Qr = x) | ||||||
|---|---|---|---|---|---|---|---|---|---|
| SECS | 0 | 4e-06 | 8e-06 | 1.2e-05 | 1.6e-05 | 2e-05 | 2.4e-05 | 2.8e-05 | 3.2e-05 |
| DC | 2614 | 2590 | 2590 | 283660 | 283437 | 283723 | 3551 | 2820 | 2747 |
| PFD | 119.69 | 119.937 | 5254.1 | 10354.1 | 10352.1 | 4555.52 | 138.356 | 122.039 | 119.814 |
| DC/PFD | 21.839 | 21.594 | 0.493 | 27.396 | 27.380 | 62.281 | 25.666 | 23.107 | 22.927 |