More details on files
Data files are tab-delimited text files, and if you selected the option, .xlsx files. Each file includes a header—which is information that describes the rest of the file.
The contents of the header will depend on whether you selected variables in Check to log as a row in Logging options. Underneath the header is the data from each measurement. Here again, the columns included depend on the variables you choose. You will find some or all of the following:
| Header label | Description | Variables table |
|---|---|---|
| Const | Gas exchange constants | Table 4‑10 |
| FLR | Fluorometer computations | Table 4‑151 |
| FlrLS | Fluorometer light source data | Table 4‑81 |
| FlrStats | Fluorometer statistics | Table 4‑17 |
| GasEx | Gas exchange variables | Table 4‑18 |
| LQConst | Light source constants | Table 4‑24 |
| LTConst | Leaf temperature constants | |
| LeafQ | Light | Table 4‑23 |
| MPF | MultiPhase flash values | Table 4‑301,2 |
| Match | Match data | Table 4‑262 |
| Meas | Measured variables | Table 4‑28 |
| Meas2 | Additional measured data | Table 4‑292 |
| QConst | Light source constants | Table 4‑32 |
| Raw | Raw data | Table 4‑332 |
| Stability | Stability parameters | Table 4‑402 |
| Status | Status data | Table 4‑38 |
| Status2 | Additional status information | Table 4‑392 |
| Sys | System variables | Table 4‑41 |
| UserDef | User defined constants |
Remarks are stored in the log files. In text data files, remarks are recorded in the text data file, either in the header information or inline with the other measurements. In Excel files, they are in a separate tab from the measurements (called Remarks). Remarks will always include the time stamp.
Data files for each flash made by the fluorometer are stored in the instrument's memory. Inside the folder you'll see text files, and possibly .xlsx files with names like the following examples:
RECT-3-20160217-16_54_29
MPF-4-20160126-16_45_11
INDUCTION-5-20160202-21_42_17
DARK-6-20160202-21_42_23
RCRDG-6-20161112-11_24_53
In each of these file names, the first set of capital letters indicates the flash type.
- RECT is for rectangular flash
- MPF is for a multiphase flash
- INDUCTION is an induction event
- DARK is for the dark pulse.
- RCRDG is the continuous fluorescence trace.
The first digit is the flash number. Each flash made by the fluorometer is assigned a number, and the number increments once per measurement. The remaining numbers are the date and time stamp, following this convention: yyyymmdd-hh_mm_ss. Year is indicated by yyyy, mm is the month, dd is day, hh is hour, mm is minute, ss is second.
Interpreting a flash data set
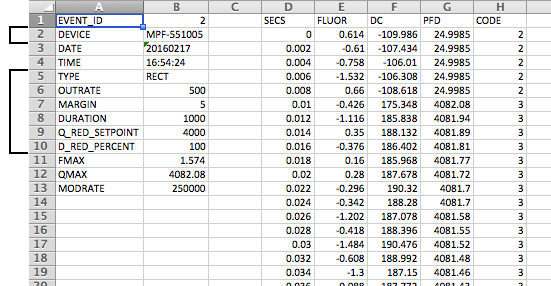
If you open a rectangular flash file in Microsoft Excel, you will see something like this:
| Fluorometer Serial Number | 
|
| Fluorometer Settings | |
The left two columns are information about the flash event. Columns D to H are the fluorescence data.
| Column | Meaning |
|---|---|
| Secs | Time |
| Fluor | |
| DC | Actinic light |
| PFD | Photon Flux Density |
| Code | The sequence of the flash that is underway at the time.
|
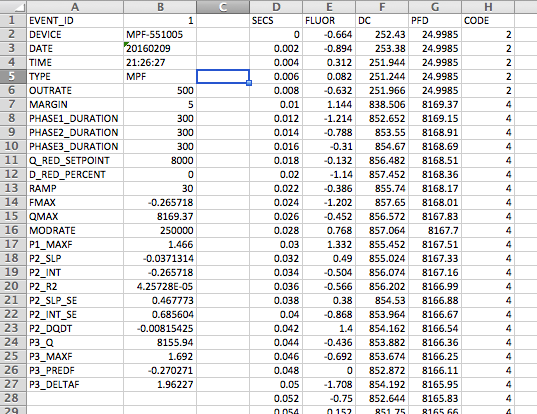
If you open a typical multiphase flash data set, expect something like this:
The continuous fluorescence trace
When you record the fluorometer trace (Fluorometry > Settings > Measuring), the resulting data file will be stored in the /home/licor/flrevents directory and the name will begin with RCRDG... followed by the date and time that recording began. The resulting file is tab-delimited. The data frequency will be about 2 Hz, except during flash or dark events, in which case it is determined by the output frequency that you specified for the event.
CODE TIME FLUOR DC PFD RED BLUE FARRED REDMODAVG
1 1478561051.8 1.80625 113.31 100.013 89.996998089 10.016001911 0.0 1.99973
1 1478561052.4 1.6265 113.091 99.983 90.004796583 9.978183420399999 0.0 1.99973
1 1478561053 1.699 113.041 100.022 90.005496854 10.016503146 0.0 1.99973
1 1478561053.6 2.296 112.79 100.015 89.998797795 10.016202205 0.0 1.99973
1 1478561054.2 2.14475 112.784 99.9829 90.0047065629 9.978173440519999 0.0 1.99973
1 1478561054.8 1.388 113.628 100.01 89.99429853000001 10.01570147 0.0 1.99973
1 1478561055.4 2.45675 113.051 99.9943 90.0146688714 9.97968112575 0.0 1.99973
1 1478561056 1.97575 113.334 99.9834 90.0051566634 9.97822333992 0.0 1.99973
1 1478561056.6 1.7955 112.926 99.9909 90.0119081709 9.978971830919999 0.0 1.99973
:
Listing 4‑1. The start of the RCRDG... file.
| Label | Description |
|---|---|
| CODE | Record identifier (see Table 4‑3) |
| TIME | Seconds |
| FLUOR | AC fluorescence |
| PFD | Total photon flux density (µmol m-2 s-1) |
| RED | Red (non-modulated) photon flux density (µmol m-2 s-1) |
| BLUE | Blue photon flux density (µmol m-2 s-1) |
| FARRED | Far red flux fluorescence (µmol m-2 s-1) |
| REDMODAVG | Averaged photon flux density contributed by the modulation (µmol m-2 s-1) |
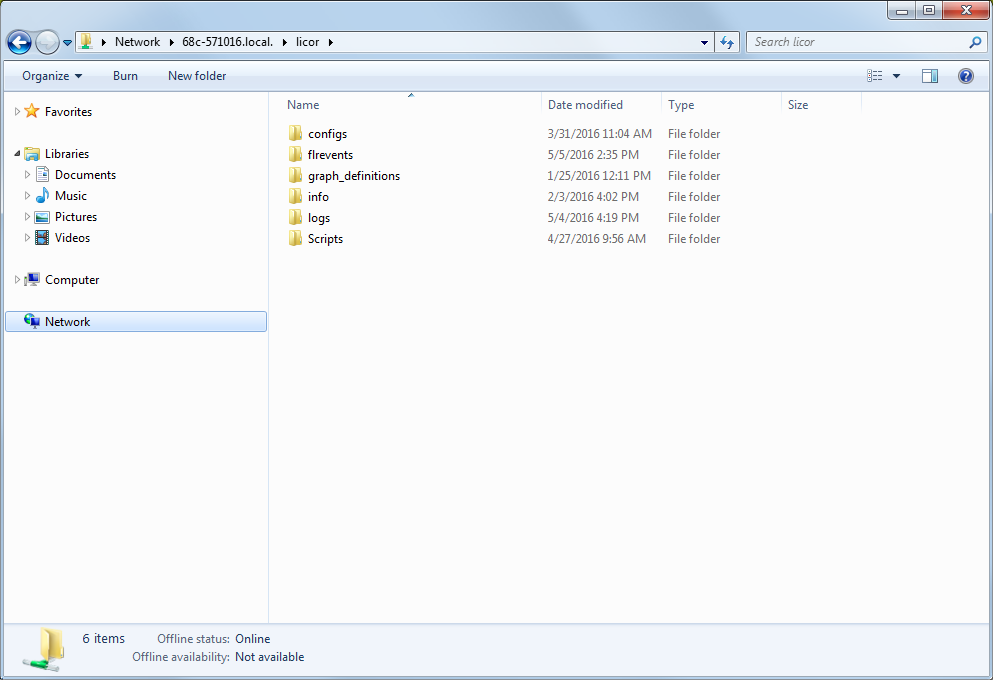
In addition to the data files, the LI-6800 file system includes configuration files, graph definitions, and other files that are either logged information, settings (saved as plain text files), and instructions for the instrument (saved as .py and .json files). You can access all of these when connected to the instrument's file system.
We're interested in the settings—the contents of the configs folder. Since these are plain text files, you can open and edit them in any text editor, so feel free to explore them on your own if you are so inclined.
Copying configuration files is just like moving files in any other computer file system. You'll save the files to your computer, and then load them onto another instrument by placing them in the same directory that they were in originally.
Snapshots
Snapshots are stored in the directory /home/licor/info/snapshots, and are named for the date and time when they occurred. They are .json files, consisting of the latest values for each of a number of topics at the time of the snapshot.
The format of a system snapshot is slightly changed in version 1.5. It is now a single .json map with 5 parts: topics, head, flr, console, tests. The head, console, and flr are new for 2.0. See .
- Topics - topics and payloads covering most aspects of system operation.
- Head - complete configuration of the sensor head.
- Console - complete configuration of the console.
- Flr - complete configuration of the fluorometer (if any).
- Tests - latest log of each system warmup test.
Listing 4‑2. The five sections of a snapshot file (topics, head, console, flr, and tests).
{
    "topics:": {
        "licor/li6850/output/DATA": {
            "TIME": 1604939190,
            :
        },
        :
    },
    "head": {
        "licor": {
            "li6850": {
                "ver": "1.4.3",
                :
            }
        }
    },
    "console": {
        "licor": {
            "li6860": {
                "ver": "1.4.08",
                :
            }
        }
    },
    "flr": {},
    "tests": {
        "Cal_Coeff_Test": [
            "Cal_Coeff_Test started at 2020-11-06 15:20:55",
            :
        ],
        :
    }
}

