
Fluorometer theory and equation summary
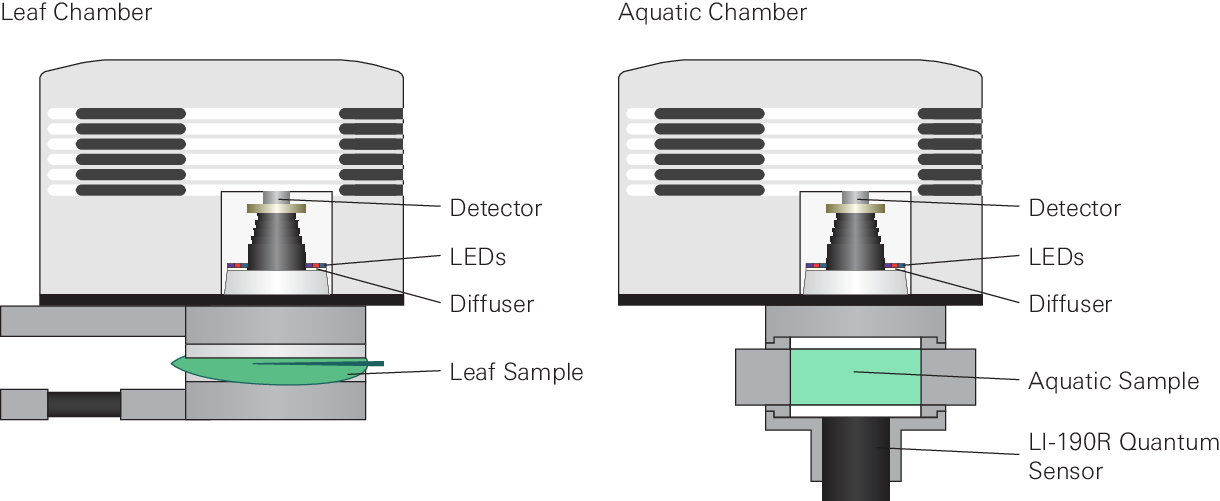
The fluorometer consists of LEDs of various colors (see Figure 8‑5) and an optical detector. For gas exchange measurements it encloses a leaf or is coupled with the aquatic chamber (Figure 8‑1).
Overview of the measurement
The LI-6800 employs two techniques to evaluate chlorophyll a fluorescence: 1) measurements of fluorescence emission with a pulse-amplitude modulation (PAM) fluorometer, and 2) measurements of maximum fluorescence yield upon application of a saturating flash of light (52). Each technique uses different LEDs, which have distinct experimental functions. PAM chlorophyll a fluorometers provide actinic light (continuous; sometimes called DC) and modulated light (sometimes called AC) shown in Figure 8‑2, A, B, and C.
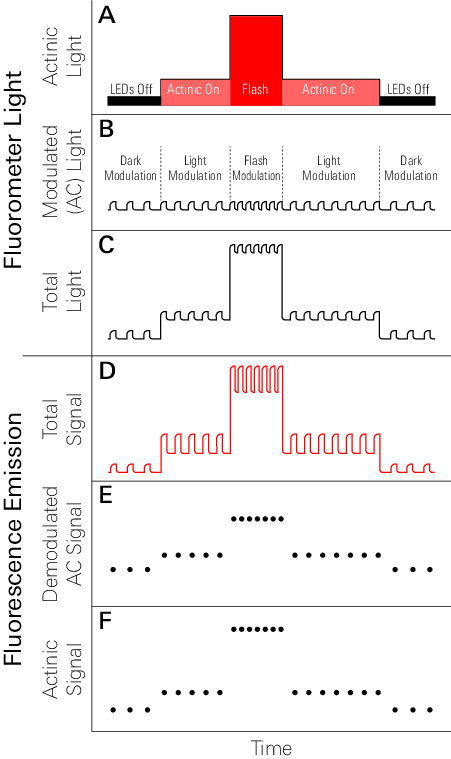
The modulated light consists of short light pulses (Figure 8‑2, B) with rise and fall times within tens of nanoseconds. In the LI-6800 fluorometer, each pulse is approximately 1 microsecond and the frequencies of the pulses range from 50 Hz to 250 KHz, depending upon the type of measurements being performed. The amplitude of each pulse is fixed at a constant value of 100 µmol m-2 s-1. The product of the pulse width, frequency, and amplitude provide a measure of the integrated intensity (i.e., quanta in units of µmol m-2 s-1) of the modulated light.
The combined PAM chlorophyll a fluorescence and saturation flash techniques are predicated on the assumption that the integrated, modulation light intensity is dim enough so as to NOT induce photosynthesis, but simply induce a low level of steady-state fluorescence that probes various aspects of the prevailing state of the photosynthetic light reactions (52).
The continuous, or actinic light (Figure 8‑2, A) is used to 1) activate photosynthesis over a range of intensities and for extended periods of time, thereby altering the steady-state fluorescence, and 2) measure the maximum fluorescence during rapid (i.e., 1 second) saturation flashes at irradiances much greater than full solar intensity (52). The modulated LEDs of the LI-6800 fluorometer are distinct from the red and blue LEDs used for continuous light. The intensities of all three sets of LEDs can be controlled independently. While modulated and continuous light sources originate from independent LEDs, the combined light incident on a leaf is the sum of both types of light (Figure 8‑2, C).
Modes of fluorescence
Two modes of fluorescence are measured with the LI-6800 fluorometer (Figure 8‑2, D). During leaf measurements, the amplitude and pulse width of the modulation light remains constant, whereas the modulation frequencies can vary according to user-prescribed values that depend upon the experimental protocol (Figure 8‑2, B). With a dark-adapted leaf in the chamber, the modulated light source elicits pulses of fluorescence (Figure 8‑2, D), termed modulated fluorescence. Since the amplitudes of the modulated light pulses remain constant, the resulting modulated fluorescence is referred to as the quantum yield of fluorescence (ΦF) (53, 54).
The actinic, or continuous, light is initially depicted as being off (Figure 8‑2, A), therefore no continuous fluorescence is stimulated and the modulated ΦF can be seen to transiently rise above zero (Figure 8‑2, D) in a manner that solely reflects the relative elicitation of fluorescence from the leaf due to the modulated light. Simultaneous illumination of a leaf with both modulated and actinic light sources elicits continuous fluorescence, on top of which are pulses of modulated ΦF. Application of a short, intense saturating flash of continuous light results in a significant increase in the amplitude of the continuous fluorescence. Once again, modulated ΦF is elicited, albeit at a greater amplitude, on top of the flash-induced, continuous fluorescence. The continuous light, whether it be of the actinic or the saturation flash variety, alters the redox photophysics of the PSII reaction center (55) in such a manner that changes in the amplitudes of the modulated ΦF’s reflect, rather than changes in the amplitudes of the modulated light pulses, alteration of the rate constants of various, photosynthesis-related processes.
Demodulation of fluorescence signals
The fluorometer measures both modulating and continuous fluorescence signals (Figure 8‑2, E and F). Demodulation is the electronic process of extracting and separating the modulating and continuous fluorescence components from the combined fluorescence signal (Figure 8‑2, D). The continuous signal is derived from the measurements of fluorescence while the modulating LEDs are off, whereas the modulating signal is derived by subtracting each on-reading from the average of the two adjacent off-readings.
Chlorophyll photophysics
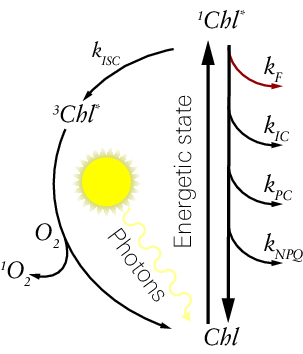
Various photophysical processes control the energy state of chlorophyll during photosynthesis. Using a simple, hypothetical model of an isolated chlorophyll molecule (Figure 8‑3), excitation of a ground-state chlorophyll (Chl) molecule by a photon results in the very rapid formation, either directly or indirectly, of the singlet-excited state of chlorophyll (1Chl*). It is thermodynamically favorable for 1Chl* to return to Chl and it can do so via a number of processes.
The rate constants
When considering a hypothetical population of isolated chlorophyll molecules, the proportion of 1Chl* decaying to Chl is determined by the parallel, first order rate constants (k) of three processes: fluorescence (kF), internal conversion (kIC), and intersystem crossing (kISC) into the triplet state of chlorophyll (3Chl*) (53, 56). 3Chl* can decay to the Chl through being quenched by specialized pigments (carotenoids) or by reacting with O2 to produce 1O2.
When chlorophyll molecules are integrated into the photosynthetic machinery, two additional processes serve a role in deexcitation: Photochemistry (PC), the coupled electron transfer processes that comprise linear electron transfer and Non-Photochemical Quenching (NPQ), a composite of reactions that serve to dissipate excess absorbed light energy. These two processes are denoted with the rate constants  and
and  , respectively.
It should be noted that these five reactions predominate under most conditions to competitively dissipate populations of 1Chl*, but there are a number of auxiliary reactions that can also be engaged under certain, unique conditions. The implications of some of these additional dissipation pathways are discussed in the context of applying the 6800-01A to algal systems later (see Chlorophyll a fluorescence in algae suspensions), but are ignored in the formulation of the fluorescence parameters here.
The flux of fluorescence photons from the sample (fF) can be defined as:
8‑1

Where q represents light intensity (mol photons m-2 s-1). From this, the dimensionless quantum yield of fluorescence, ΦF, can then be defined as:
8‑2

Combining the above provides the mathematical convention for ΦF as it is commonly formulated:
8‑3

Note that the rate constants for PC and NPQ are considered apparent because they are in reality much more complex than a simple first order rate constant.  is multiplied by
  , the proportion of the oxidized primary electron acceptor (QA) within the PSII reaction center:
8‑4

Where  and
and  represent the concentrations of the oxidized (open) and reduced (closed) chemical forms of QA, respectively.
NPQ is an inducible process engaged under actinic illumination. To denote the degree of engagement we multiply  by the coefficient px. For a sufficiently dark-adapted sample there is no NPQ, such that px is zero (
 ). Under illumination the degree of NPQ is variable, such that px is greater than zero and less than or equal to one (
 ).
).
The PAM chlorophyll a fluorescence method in conjunction with the saturation flash technique, provides measurements of useful, well-defined ΦF parameters. Including the two proportionality coefficients for the apparent rate constants of PC and NPQ, in the common formulation of ΦF provides the standard model we will use here to define these:
8‑5

For a sample in a sufficiently darkened state, an estimate of the minimum ΦF (Fo) can be made. Measurement of Fo assume the pool of QA is completely oxidized ( ), such that
  , and that since NPQ is only induced under actinic light, that pz is zero (
 ). Substituting into the standard model, Fo is defined as:
8‑6

The darkened maximum ΦF (Fm) is measured during a short (sub second), intense (4,000 to 16,000 μmol photons m-2 s-1) flash of light that is intended to cause the population of oxidized QA to approach zero ( ). The measurement of Fm is made on a sufficiently darkened sample and on a short enough time scale, such that pz remains zero (
 ). The definition of Fm is therefore:
8‑7

The minimum ΦF measured in a sample under steady-state actinic illumination (Fs) is defined as:
8‑8

Here it is assumed that a mixed population of oxidized and reduced QA is present, and as such the value of  is somewhere between one and zero depending upon light intensity, stress level, etc. Actinic light induces NPQ formation and thus pz is no longer a zero value (
 ).
).
The maximum ΦF under steady-state illumination ( ), like Fm, is determined during an intense, short flash of light that is intended to cause
  . NPQ is presumed to remain engaged during this time, such that pz remains a non-zero value (
 ).
).
8‑9

For a sample acclimated to some level of actinic illumination, an estimate of the minimum ΦF in the light ( ) can be made. In the 6800-01A, this is done by illuminating the sample with far-red light while briefly moving it into the dark. This is presumed to preferentially move electrons through PSI and drive the pool of QA to the oxidized sate, such that
  . This method assumes that NPQ remains engaged over the dark period and pz remains a non-zero value.
8‑10

From these well-defined measurements of ΦF, a series of fluorescence parameters are derived in the LI-6800 each representing a particular aspect of photochemistry.
The maximum quantum yield, or quantum efficiency, of PSII electron transfer ( ; Fv/Fm in the FLR data group), a sensitive indicator of various environmental stresses that effect the photosynthetic machinery, is defined as:
8‑11

The light acclimated, operating quantum yield of PSII electron transfer (ΦPSIIF; PhiPS2 in the FLR data group):
8‑12

In theory, ΦPSII can be used to quantify the flux of electrons (fETR) through PSII, which is a proxy for the linear electron transfer rate. Deriving ETR from ΦPSII requires knowledge of the light absorption by the sample and how absorbed photons are partitioned between PSI and PSII. The normal formulation is:
8‑13

Where α is light absorption at the wavelengths used for measurements, q is the quantum flux of photons, and  is the proportioning coefficient describing how absorbed photons are distributed between PSI and PSII.
  is difficult to measure in situ. In the aquatic chamber, α is particularly difficult to estimate and is expected to vary widely, particularly as function of sample density, making it difficult to provide a reasonable default value. ΦPSII functionally has units of electrons per photon (mol e- mol photon-1), and since α and
  are dimensionless, the units of fETR end up as mol e- m-2 s-1. Given the difficulty with constraining α and the non-sensical nature of expressing fETR on a two-dimensional (i.e., per area) basis for a suspension of discrete organisms distributed in three-dimensional space, the LI-6800 adopts the convention of expressing relative fETR (
 ; rETR in the Flr data group) in place of fETR:
8‑14

The light acclimated potential quantum yield of PSII electron transfer ( , Fv’/Fm’ in the FLR data group):
8‑15

At a given light intensity  will typically be larger than ΦPSII, and at moderate to high light both will fall below
  . At low light intensities
  will typically approach or equal
  . In algal systems some unique physiology can result in measurements of quantum yields in the light exceeding the dark-adapted maximum
  . In the following section some of these reasons, as well as methodological approaches to resolve the issues they create, are discussed.
Three parameters describing the degree of non-photochemical quenching are reported by the 6800-01A when dark and light adapted data are available. qN and  (qN and qN_Fo in the FLR data group, respectively) are constrained to between zero and one, and differ in the particular minimum ΦF they are referenced to. NPQ (NPQ in the FLR data group) is not constrained to an upper limit.
8‑16

8‑17

8‑18

Similarly, two parameters describing the degree of photochemical quenching are reported: qP and  (qP and qP_Fo in the FLR data group, respectively). Like qN and
  , qP and
  are constrained to between zero and one, and differ in the particular minimum ΦF they are referenced to.
8‑19

8‑20

From qP an estimate of the fraction of open reaction centers (qL, qL in the FLR data group) can be made. The right most formulation gives the actual formulation of qL used in the LI-6800.
8‑21

From qL the fraction of closed reaction centers is simply  , which is reported as 1-qL in the FLR data group.