
Theory and equation summary
In this section, we describe how the LI-6800 probes the gas exchange processes in a leaf.
Leaf-level interactions with the atmosphere
Leaves are bounded by epidermal cell layers that help to separate the leaf intercellular air space from the atmosphere. Between the epidermal layers are various other cell types, e.g., palisade, mesophyll, bundle sheath, etc., depending upon the many different varieties of leaf morphologies found in nature. As a starting point, we'll refer to a simplified schematic of a leaf cross-section throughout this preface (Figure 9‑1).
A typical plant cell has a ligneous wall and a plasma membrane that encapsulate the aqueous, cytosolic compartment. While there are many important cellular organelles, the cell depicted here is chloroplast-centric: the only organelle shown within the cell is a double membrane chloroplast, which encloses the aqueous stromal compartment. Localized within the stroma is a complex network of thylakoid membranes that also have been significantly simplified in the schematic. Integrated within the thylakoid membrane are all the proteins, pigments and redox cofactors that function to transduce light energy into the transfer of electrons and protons, the combined effect of which results in the storage of light energy in chemical forms of energy (i.e., NADPH and ATP) (5). These chemical intermediates can be used to power, among other processes, the enzymatic reduction of CO2 to the level of sugar phosphates (6).

 ) indicate resistance to diffusion. The relative concentrations of gases are indicated by the size of characters.
Atmospheric gases (CO2, O2, H2O and others) diffuse into and out of the intercellular leaf air space through stomatal apertures (Figure 9‑2). Stomatal apertures cause resistance to gas diffusion (7). The intercellular air space is assumed to be saturated for water vapor at leaf temperature (8). The relative water vapor concentration within the leaf (Wi) is typically greater than the water vapor concentration in the atmosphere (Wa) as a result of this stomatal resistance. Stomatal resistance also results in a lower CO2 concentration in the leaf intercellular air spaces (Ci) than in the atmosphere (Ca).
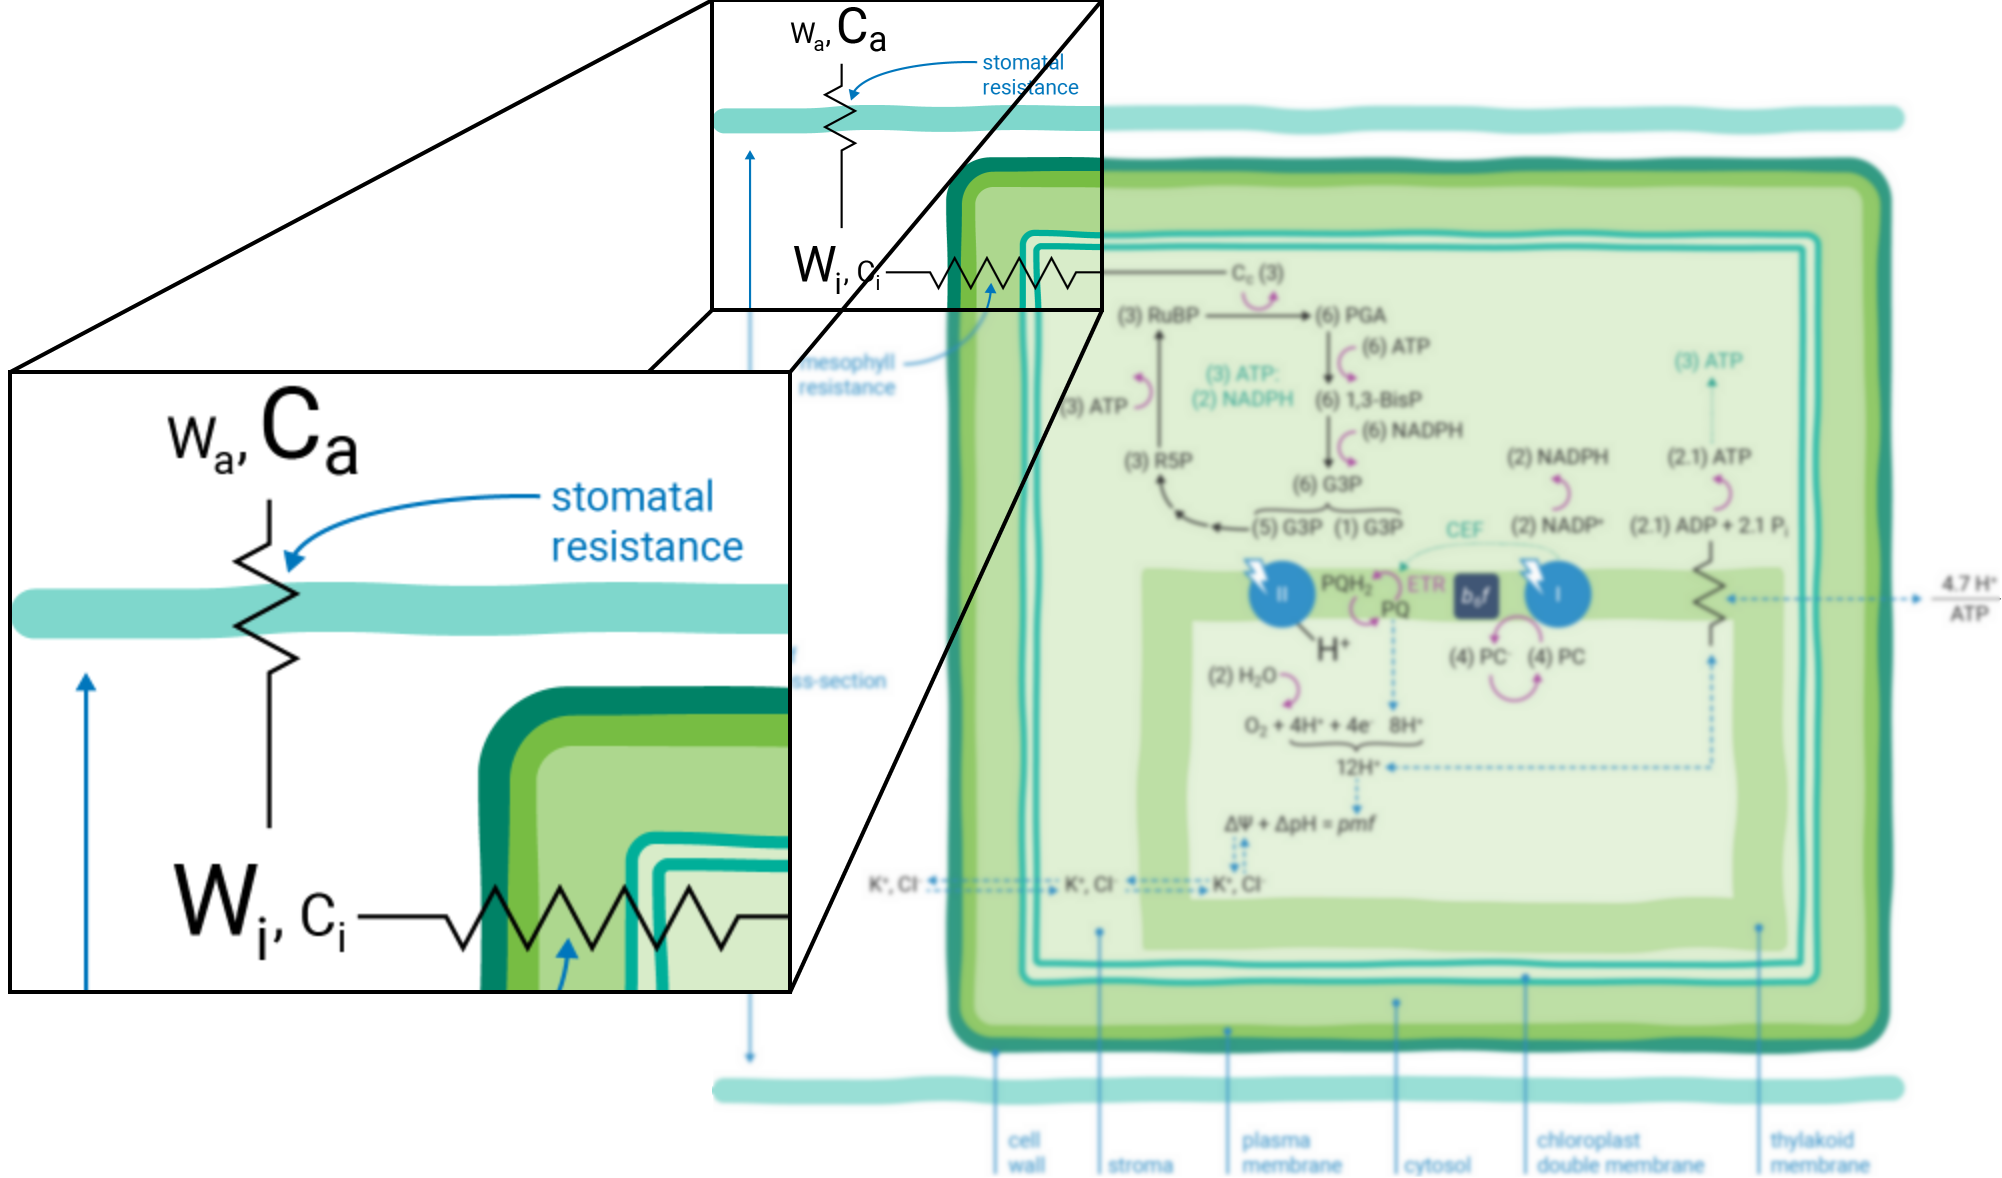
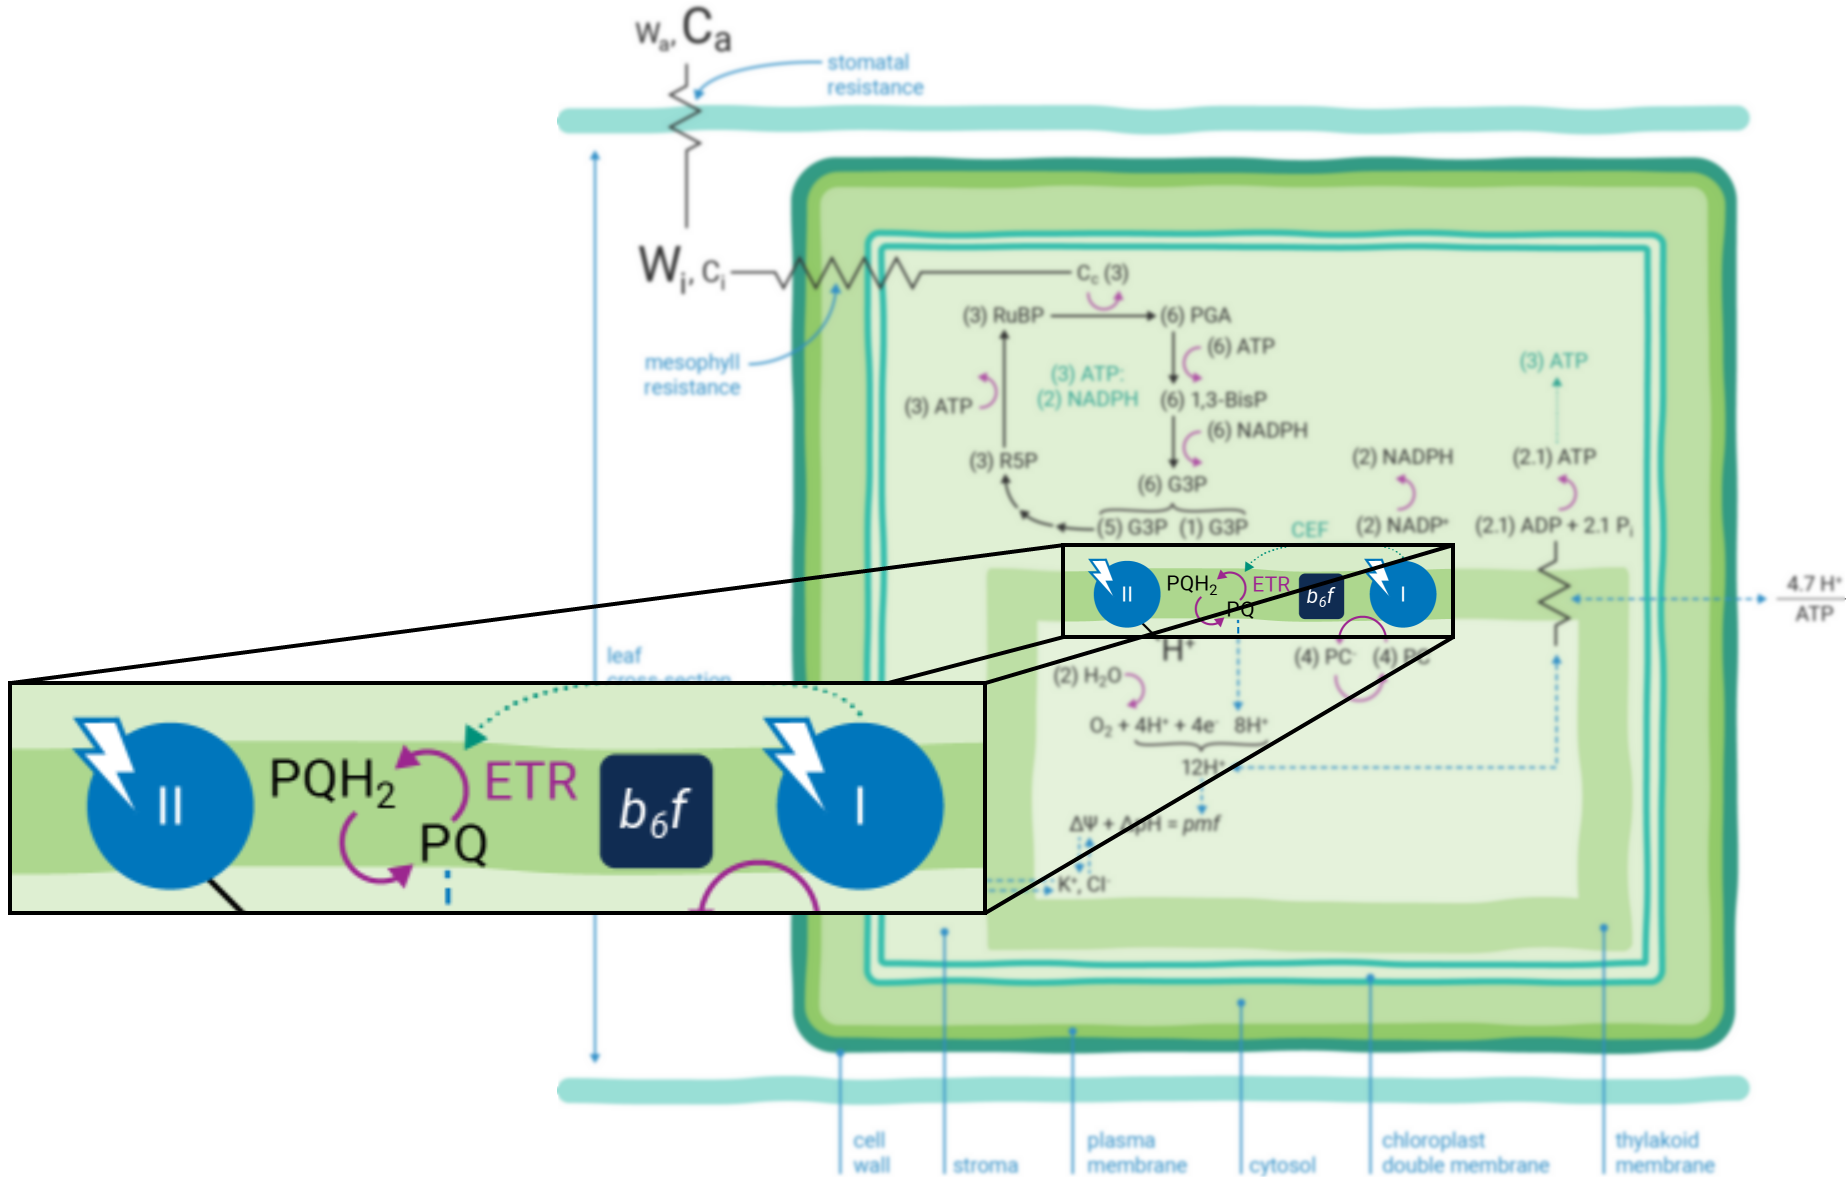
Leaves principally absorb light within the visible region (mostly red and blue) of the electromagnetic spectrum (9). Light absorption, which powers photosynthesis (Figure 9‑3), occurs within specialized pigment-binding protein complexes referred to as photosystems I and II (PSI and PSII) (10). These photosystems are localized within the chloroplast thylakoid membranes (11) and they function in series to facilitate linear electron transfer (ETR; µmol electrons m-2 s-1). Linear ETR is a proton-coupled process (12, 13) that establishes a trans-thylakoid proton motive force (pmf) consisting of both electric field (ΔΨ) (14) and pH (ΔpH) gradients (15).
Photosynthesis-driven transpiration begins with evaporation of H2O from cell wall orifices and into leaf intercellular air spaces (16). Transpiration moves H2O from below-ground soil sources to the atmosphere, transporting ions (e.g., K+ and Cl-, etc.) (17) throughout the plant. These ions serve many cellular purposes including regulation of the relative partitioning of the pmf into ΔΨ and ΔpH components (15, 18).
Energy producing and consuming reactions
The energy producing (i.e., NADPH and ATP formation) and consuming (CO2 assimilation, etc.) reactions of photosynthesis are tightly coordinated (19). The tight coordination is a function of the rigid stoichiometric relationships of key steps within the series of photosynthetic reactions. Assuming 100% quantum conversion at PSI and PSII (20), absorption of four photons at each photosystem results in the net oxidation of two H2O molecules, thereby releasing four protons (H+) into the thylakoid lumen and the generation one molecule of O2 (Figure 9‑1). The electrons freed during these thermodynamically favorable reactions can be subsequently used to form two molecules of NADPH. This transfer of electrons is a somewhat more explicit description of linear ETR.
If the Q-cycle at the cytochrome b6f complex operates constitutively (13, 21 - 23), oxidation of two H2O molecules would result in the net accumulation of twelve protons in the thylakoid lumen, thereby contributing to the pmf (12). The resulting amount of ATP generated as these twelve protons move down their electrochemical gradient through the chloroplast ATP synthase is determined by the enzyme’s H+/ATP ratio (24). The ATP synthase imposes a resistance to proton efflux from the lumen to the stroma of the chloroplast (Figure 9‑4) (5). The H+/ATP ratio of the ATP synthase is contested (25), but if the ratio is four, movement of twelve protons through the ATP synthase would result in the formation of three ATP molecules. Thus, oxidation of two H2O molecules would result in two NADPH and three ATP molecules, precisely the chemical stoichiometry needed to assimilate a single CO2 molecule (6).
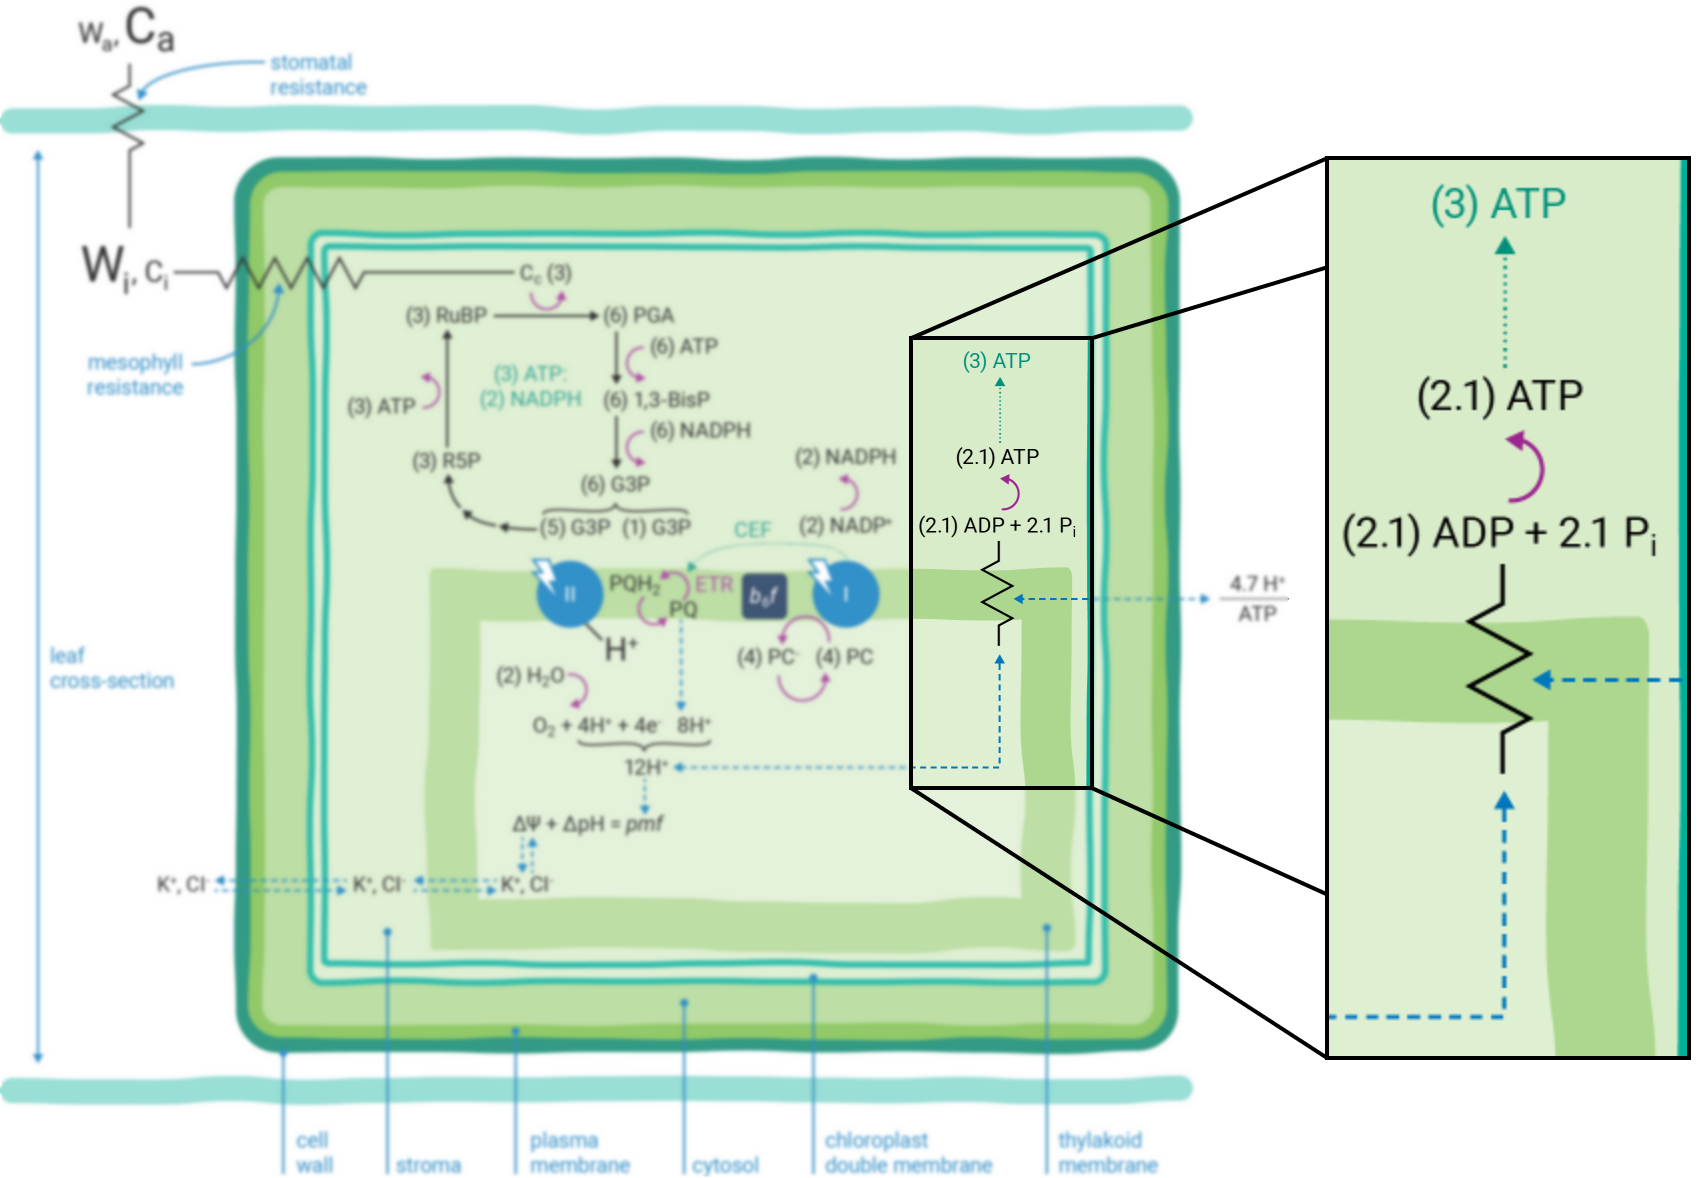
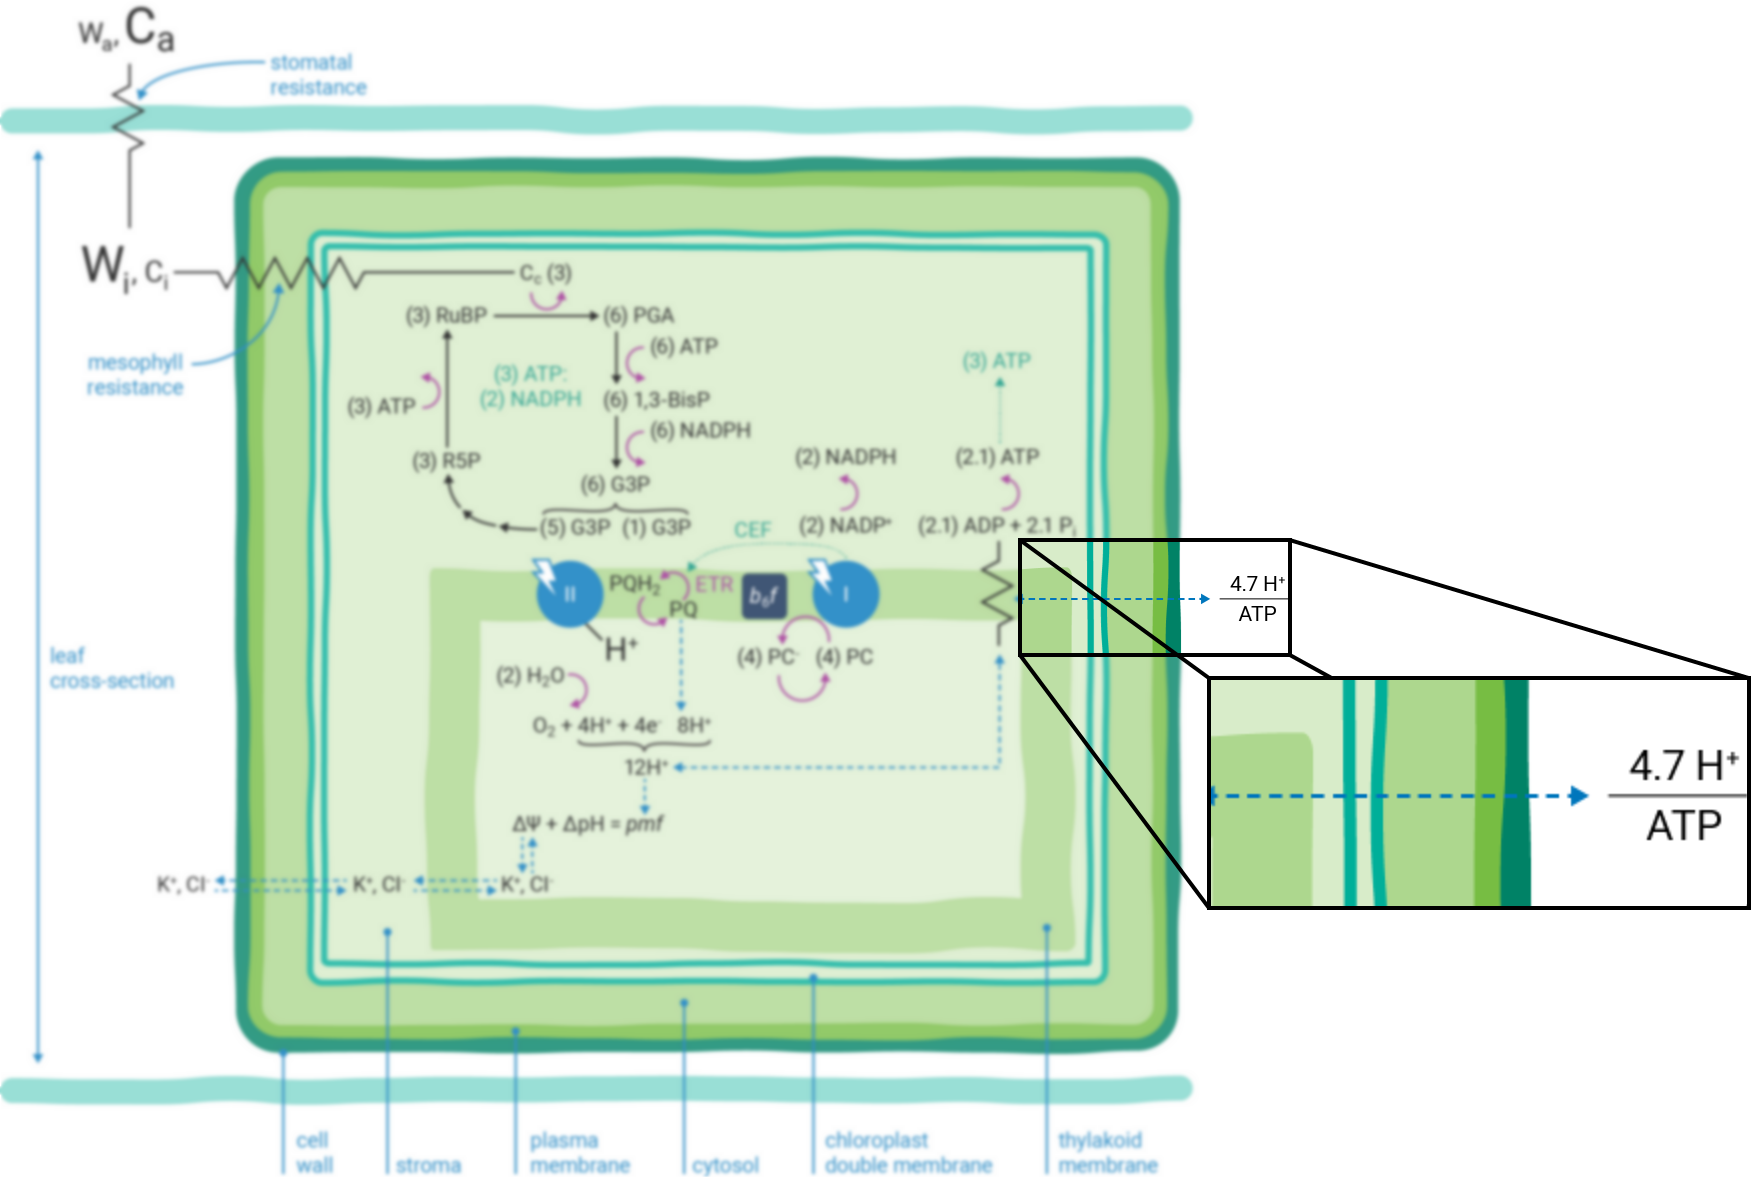
In contrast, given the putative c-subunit composition of the chloroplast ATP synthase (26) (Figure 9‑5), an H+/ATP ratio of 4.7 has been suggested. The net result is a deficit in the amount of ATP produced by linear ETR alone in comparison to that needed to balance the ATP:NADPH ratio for CO2 assimilation alone. Cyclic electron transfer (ETR) around PSI has been suggested as a mechanism for augmenting the pmf, thereby accounting for the deficit of ATP produced by linear ETR (27, 28). The rate of cyclic ETR around PSI needed to accommodate for the short fall in ATP formation has been suggested to be about 12% of linear ETR (25).
In either case, the relationship between linear ETR and the rate of CO2 assimilation is predicted to have a ratio of slightly more than four under conditions when CO2 assimilation is the predominant sink for ATP and NADPH (29). Such conditions occur when photorespiration is inhibited by performing experiments on C4 plants or, under low O2, on C3 plants.
Photosynthetic light reactions must be highly adaptive to a dynamic environment to coordinate the energetic demands for ATP and NADPH while simultaneously regulating light capture (30). Processes other than CO2 assimilation (such as photorespiration, nitrogen and sulfur metabolism) have different ATP and NADPH requirements. Non-photochemical quenching (NPQ) of excess absorbed light energy serves as a photo-protective mechanism (31, 32, 33), preventing formation of highly reactive forms of oxygen: singlet oxygen (1O2) and the superoxide radical anion (O2-).
Energy-dependent quenching (qE) (34), the predominant component of NPQ, is a dual function of the ΔpH component of the pmf (31). The ΔpH both 1) activates a thylakoid lumen-localized enzyme violaxanthin de-epoxidase, which converts violaxanthin (V) to zeaxanthin (Z) in the PSII antenna (35); and 2) regulates protonation of thylakoid lumen-exposed, amino acid residues associated with PSII proteins (36, 37).
Dynamic coordination of the light reactions is required to meet the energetic and photoprotective demands during fluctuating biochemistries that occur during environmental stress, such as drought, for example (5, 30). The coordination is mediated by changes in cyclic ETR around PSI and changes in the proton conductance of the chloroplast ATP synthase (gH+) (18, 38). The former is thought to be predominantly involved in regulating the output ratio of ATP:NADPH, while the latter is thought to be primarily responsible for modulating qE sensitivity (5, 30).
Energy production and photoprotection
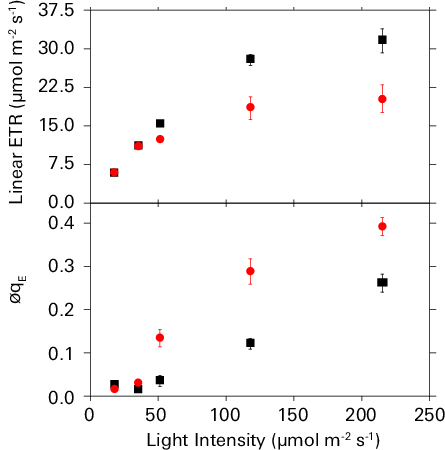
Under fluctuating biochemical demands, qE sensitivity refers to a relative increase in the amount of qE at a given flux of linear ETR (18, 39). Linear ETR and qE increase in hyperbolic and sigmoid manners, respectively, with increasing light intensity under ambient CO2 and 21% O2 (Figure 9‑6, black squares), as well as under 50 ppm CO2 and 21% O2 (Figure 9‑6, red circles). The lower CO2 concentration artificially imposes a change in biochemical demand that mimics various environmental stresses. At the highest light intensity, lowering the CO2 concentration decreased linear ETR by 42% in comparison to values under ambient CO2, whereas qE increased by approximately 2-fold under the same low CO2 concentration treatment. In essence, qE became more sensitive to linear ETR in response to the diminished biochemical demand. Combining analyses of electron and proton transfer reactions of photosynthesis has previously shown that changes in qE sensitivity are predominantly attributable to proportional changes in gH+ (18, 39).
Coordination of assimilation and transpiration
Optimal assimilation of CO2 from the atmosphere by leaf-level photosynthesis is directly coupled with H2O loss. Energy use from light capture, carbon assimilation, and H2O loss is coordinated through regulation of stomatal conductance (gs) (7) and mesophyll conductance (gm) (40 - 44). Research into understanding the inter-dependencies of these regulatory mechanisms has led to interest in selecting for plants to increase the gm:gs ratio, the result of which could lead to more water use efficient plants (45).
Assessing the gas exchange parameters
The gas exchange model described below assumes that the system has no leaks and that air is perfectly mixed in the chamber. In practice, this does not always happen. We present a detailed description of the computations when these assumptions are not met in Mass balance derivation using a two-compartment model.
An open gas exchange system
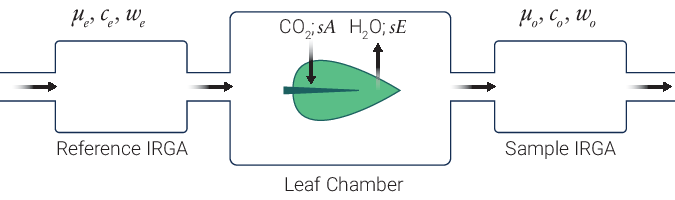
The LI-6800 is an open gas exchange system (8) that measures many parameters needed to estimate photosynthetic gas exchange. The gas exchange system measures the flow rate (µmol air s-1) entering the leaf chamber (µo) and the CO2 and H2O concentrations entering (c0 and w0, respectively) and exiting (ca and wa, respectively) the leaf chamber (Figure 9‑7).
The LI-6800 computes the mass flow per time (i.e., µmol CO2 s-1 and mmol H2O s-1) of these gases into and out of the chamber. The differences between the CO2 and H2O concentrations into and out of the leaf chamber are due to leaf-level CO2 assimilation and transpiration on a leaf area (s) basis (µmol CO2 m-2 s-1 and mmol H2O m-2 s-1). During photosynthetic carbon assimilation (A), the leaf takes up CO2 from the air entering the chamber while simultaneously releasing H2O via transpiration (E) into the chamber air. While the flow rate of air coming out of the chamber (µa) is not directly measured, it is assumed to be:

where s represents leaf area. Transpiration from the leaf is adding water vapor to the chamber, which changes the air density and therefore is added to the total flow into the leaf chamber.
The open-system measurements can subsequently be used to estimate important gas exchange parameters (8, 46). Transpiration, on a leaf area (s) basis, is calculated as:

We can rearrange equations 9‑1 and 9‑2 to give:
9‑3

Similarly, we compute net CO2 assimilation (ANet) (46, 47) as:

Using equation 9‑1, equation 9‑4 rearranges to:
9‑5

The cascade of derived parameters
In accordance with reasonable assumptions (8), we use E to derive an expression that represents the total conductance of a leaf to water vapor flux (gTw):

In general, transpiration comes from stomata located on both sides of the leaf. On each side, water vapor diffuses through the stomata and then through the boundary layer to the mixed atmosphere. For each side of the leaf, total resistance to water vapor diffusion (rw) is the sum of stomatal resistance (rsw) plus boundary layer resistance (rbw). So,
9‑7

and
9‑8

for lower (l) and upper (u) leaf surfaces, respectively. We assume boundary layer resistance is the same on both sides of the leaf, so rbw =  =
=  . We define a stomatal ratio:
9‑9

Total stomatal resistance is a parallel combination of stomatal resistances from the upper and lower surfaces, so
9‑10

Total conductance measured by equation 9‑6 represents a parallel combination of series resistances from the upper leaf surface and lower leaf surface, so
9‑11
 ,
,
since gi = 1/ri. From these relationships it can be shown that
9‑12
 .
.
Or, in terms of conductances,
9‑13
 .
.
Solving for gsw yields:
9‑14
 .
.
Similarly, for conductance to CO2,
9‑15

where 1.6 is the ratio of the diffusivities of CO2 to water vapor in air and 1.37 is the same ratio in the boundary layer.
Lastly, we give an expression for Ci (8):

It should be noted that equation 9‑16 is derived from the compilation of many fundamental parameters measured by the LI-6800 gas exchange system.
The Farquahar-von Caemmerer-Berry model
Development of the Farquhar-von Caemmerer-Berry (FvCB) model of photosynthesis (46) was made possible with the types of above-mentioned measured and derived parameters. The general form of the FvCB model is (47, 50):

Equation 9‑17 expresses ANet as a function of the minimum rate of photosynthesis that can be supported by: 1) RuBisCO activity (wc); 2) energetic chemical-intermediate (i.e., ATP and NADPH) production for ribulose 1,5-bisphosphate (RuBP) regeneration (wj); and 3) triose phosphate export and utilization (wp). The CO2 compensation point in the absence of day respiration (Γ*) and day respiration (Rd) are routinely estimated from literature sources but can also be measured (51). While expressions for all three potentially limiting processes can be more fully defined (50), we will focus on the RUBP-regeneration limited expression because it directly links measurements of linear ETR and A. The full expression for RUBP-regeneration limited photosynthesis is (47, 50):

J is the electron transport rate needed to supply energy for carboxylation and oxygenation reactions catalyzed by RuBisCO. We’ll say more about J below. The coefficients 4 and 8 can be altered depending upon the assumptions about the relative energy demands for ATP and NADPH (50).